Just published the latest deep dive on Silicon Pipeline Research: What is $AMD worth in 2030? 💻
The market fundamentally misunderstands the OpenAI/Meta warrant deals. It’s not a "105% cash discount"—it’s performance-linked equity to buy ecosystem loyalty.
🎯 Base Case: $960 | 🚀 Bull Case (PT@2030): $1,460
Key takeaways:
🔹 GPUs won't have just one winner. AMD is the only merchant silicon alternative to $NVDA.
🔹 Inference is the real battlefield, and MI355X/MI455X token economics are ~40% cheaper.
🔹 The Helios rack ramp (yields + HBM allocation) is the true near-term bottleneck, not demand.
🔹 EPYC server CPUs act as the high-margin "shield" for the GPU "spear."
At today's ~$514, the base case is already priced in. Buying now is an option on the $1,460 bull case.
Read the full 2030 valuation model and supply chain teardown here 👇
https://t.co/tsGnIDP0QZ
CoreWeave Q3 earnings delivered a solid double beat, yet the aftermarket stock reaction remained remarkably flat—and the numbers show exactly why market sentiment remains capped by leverage:
Q3 2026 CoreWeave Beat Breakdown:
• Revenue:$3.66B vs. $3.54B est. (+168% YoY)
• GAAP EPS: -$1.27 vs. -$1.55 est. (Loss narrowed)
• GAAP Operating Income:$207M (Adj. $379M)
• Net Interest Expense:$846M (Q4 guidance stepping up to $1.05B–$1.15B)
The core operational dilemma is clear: operating profits are growing, but net interest expense is running at over 4x GAAP operating income, swallowing operational gains as full-year CapEx targets $37B–$39B.
The key macro signal to track isn't quarterly revenue beats, but CoreWeave’s secondary market bond/debt yields. The moment secondary yield spreads begin to tighten meaningfully, it will signal that institutional capital has found a sustainable path to digest and price AI infrastructure debt risks.
Until then, high leverage remains the primary governor on multiple expansion. $CRWV #AI #Semiconductors #CapEx #CoreWeave
🚨 NOMURA: THE MARKET MAY BE MISREADING THE ENTIRE AI DATA CENTER BOOM.
Big Tech is spending hundreds of billions on AI infrastructure. Free cash flow is under pressure. Investors are worried the AI boom isn't profitable.
But Nomura argues something very different:
AI infrastructure is already highly profitable. The cash flows simply haven't caught up with the investment cycle.
Here's the breakdown 🧵👇
1/ The profitability numbers tell a different story.
According to Nomura's November 2 report:
• AWS revenue: $46B, +39% YoY
• AWS operating margin: 38.7%
• Google Cloud revenue: $30.7B, +103% YoY
• Google Cloud operating margin: 36.2%
• Azure growth: +48%
These are not the numbers of an industry struggling to generate operating profits.
2/ The real issue is timing, not necessarily profitability.
Big Tech pays for data centers, GPUs, networking and memory upfront.
Revenue and cash generation arrive over subsequent years.
That creates a classic free-cash-flow J-curve:
CAPEX accelerates → FCF deteriorates → Infrastructure generates revenue → Investment growth moderates → FCF recovers.
3/ Nomura expects operating income to surge before free cash flow.
Its illustrative forecasts suggest operating-income growth could peak around 2029, while FCF growth accelerates later.
That distinction matters enormously for investors valuing AI infrastructure businesses.
4/ Why can't hyperscalers simply stop spending?
Because AI increasingly threatens their existing businesses.
Search, advertising, shopping, software and cloud services are being reshaped by AI agents.
Companies that underinvest today risk surrendering customers, data and market share tomorrow.
5/ Demand may not be the primary constraint. Capacity is.
Nomura cites enormous contracted cloud backlogs:
• Google Cloud: $560.8B
• AWS: ~$496B
• Microsoft commercial RPO: $677B
These figures have different reporting definitions, but collectively illustrate substantial contracted demand.
6/ Big Tech has financing alternatives to cutting CAPEX.
Nomura identifies four paths:
① Accelerate investment
② Freeze CAPEX
③ Use joint ventures and operating leases
④ Monetize contracted future cash flows
Its preferred expectation is continued investment supported by increasingly sophisticated financing structures.
7/ Oracle offers a real-world example.
Nomura highlights Oracle's combination of long-term leases, project financing, customer prepayments and customer-provided hardware.
The broader message: hyperscalers can restructure who finances infrastructure without necessarily reducing how much infrastructure gets built.
8/ This distinction is critical for semiconductors and memory.
Negative hyperscaler FCF does not automatically imply collapsing demand for GPUs, DRAM, HBM or other data-center components.
If spending continues through financing structures, semiconductor demand can remain resilient even while hyperscalers optimize their balance sheets.
9/ What could invalidate the thesis?
A genuine compute oversupply.
Watch:
• Cloud revenue growth
• GPU rental pricing
• Contracted backlog growth
• Data-center utilization
• Memory supply commitments
• Hyperscaler investment guidance
These are more useful indicators than negative FCF alone.
10/ The investment takeaway:
The key question is not simply:
"Why is Big Tech burning so much cash?"
It is:
"Will the infrastructure being built today generate enough durable cash flow to justify its cost of capital?"
Nomura is optimistic.
But the answer ultimately depends on pricing, utilization, investment discipline and the durability of AI demand.
The AI infrastructure cycle may be a cash-flow timing problem rather than a profitability crisis.
$NVDA $MU $GOOGL $MSFT $AMZN $META $ORCL
BofA's CY30 Server CPU forecast perfectly validates our valuation framework.
CY30 Value Share: ARM Merchant (37.9%) > $AMD (30.7%) > $INTC (22.0%).
Our AMD model assumes a server CPU share of 28% in the Base Case and 32% in the Bull Case. BofA’s 30.7% projection slots right in the middle. The CPU remains the high-margin shield. Capturing 30%+ of this exploding $210B TAM is exactly how AMD funds the GPU price war.
Spot on. This is precisely why we’re bullish on $MU in our latest article:
While HBM margins currently lag traditional DRAM due to contract timing, the 2027 contract repricing cycle will bring a major catch-up surge, sharply boosting HBM margins.
Ultimately, $MU is positioned to benefit from both DRAM (today's higher margins) and HBM (tomorrow's margin expansion).
Fullnote:https://t.co/LJCdWVoQAd
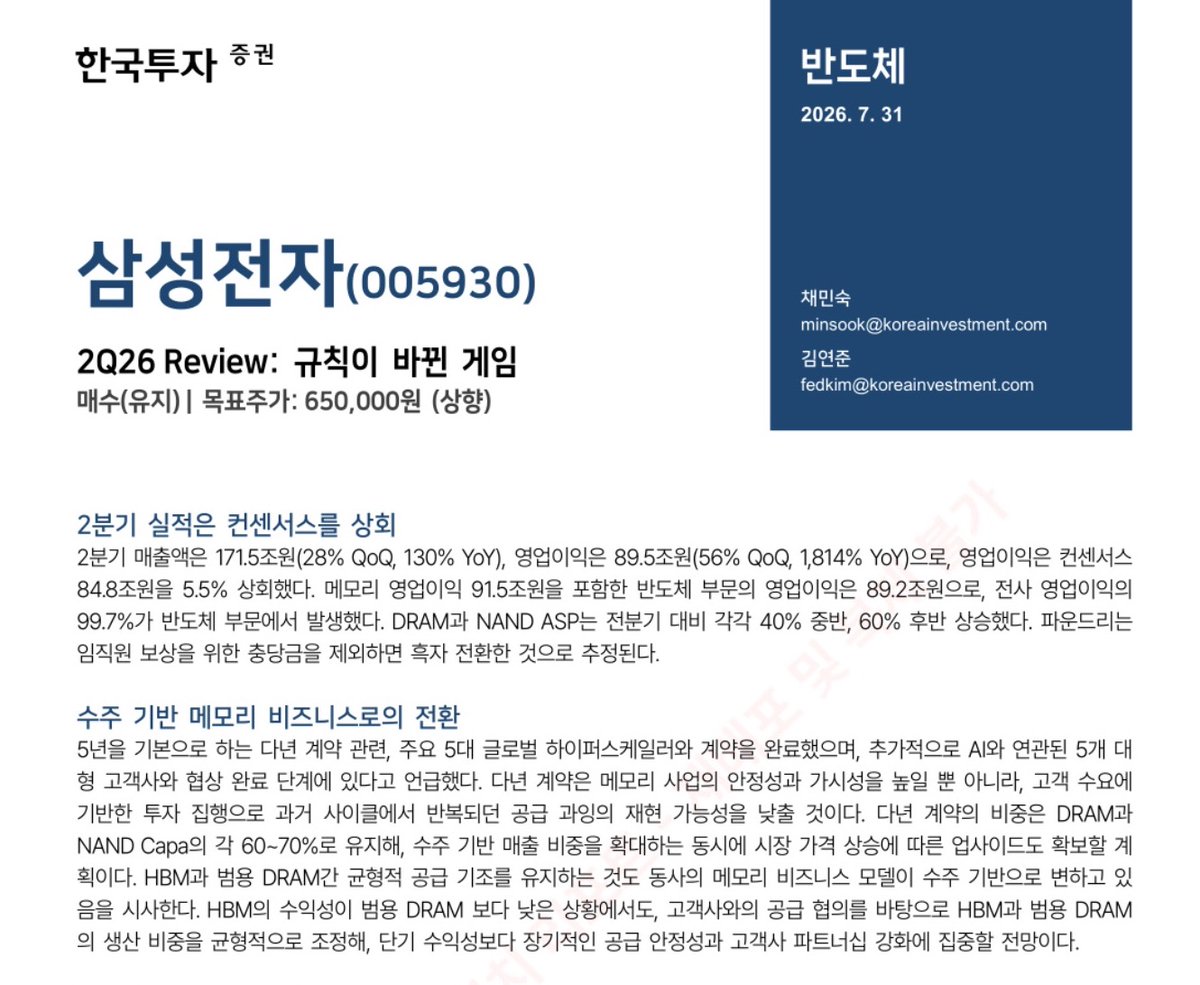
2026-07-31 / KOREA INVESTMENT & SECURITIES / ANALYST NOTE
KIS NOTE: MEMORY BECOMES LIKE AN AIRLINE TICKET — RESERVE 'SEATS' FIVE YEARS AHEAD
1. The semiconductor division generated 99.7% of Samsung Electronics’ second-quarter operating profit, while the MX business, which handles smartphones, swung to a loss.
Samsung Electronics is rapidly shifting from a diversified electronics company selling appliances and smartphones into one whose earnings are heavily determined by memory prices.
That increases its exposure to the semiconductor boom, but it also leaves profits far more dependent on the memory cycle than before.
2. Samsung Electronics has completed multiyear agreements, generally based on five-year terms, with the five largest global hyperscalers and is nearing the completion of negotiations with five more major AI-related customers.
The important change is not simply the length of the contracts. Production and investment decisions are now beginning with confirmed customer orders.
That could weaken the old model of expanding fabs based on demand forecasts and then flooding the market with whatever supply remained unsold.
3. Samsung Electronics plans to keep multiyear supply agreements at roughly 60% to 70% of its DRAM and NAND production capacity.
Securing long-term customers for most capacity creates a floor for both pricing and volume, while leaving some supply available to benefit from rising market prices.
The structure is designed to provide earnings stability without giving up the upside of a memory-price boom.
4. Even if HBM margins remain below those of commodity DRAM, Samsung Electronics plans to balance production between the two products based on supply agreements with customers.
Rather than directing all capacity toward whichever product offers the highest immediate margin, the company intends to supply the full range of memory its customers require.
Long-term supply relationships and share within customer accounts are beginning to matter more than short-term profitability.
5. Reflecting the expansion of multiyear contracts and the possibility of higher HBM prices in 2027, operating-profit forecasts for 2026 and 2027 were raised by 3% and 7%, respectively.
The significance of this change is not limited to lifting the peak level of earnings.
If long-term contracts support the floor for pricing and volume, profits could remain elevated for longer even after the memory boom ends.
6. Samsung Electronics’ TSV capacity is expected to rise from 200,000 wafers per month in the second quarter of 2026 to 300,000 wafers per month in the fourth quarter of 2027.
HBM is also projected to account for roughly 16% of total DRAM shipments in 2027.
The strategy has two tracks: strengthen technological competitiveness around HBM4 while also expanding share in commodity DRAM and NAND.
7. Backed by record-level cash generation, Samsung Electronics reaffirmed its policy of returning 50% of free cash flow to shareholders.
Expansion and shareholder returns no longer need to compete with each other. Enormous memory profits could fund both at the same time.
The stock currently trades at roughly 1.3 times estimated 2027 book value, which does not appear to fully reflect the shift toward long-term contracts, stronger cash generation, and a more generous shareholder-return policy.
#삼성전자 #반도체 #메모리 #인공지능 #고대역폭메모리 #HBM4 #디램 #낸드 #장기공급계약 #하이퍼스케일러 #주주환원 #SamsungElectronics #Semiconductors #Memory #AI #HBM #HBM4 #DRAM #NAND #LongTermAgreements #Hyperscalers #ShareholderReturns $SSNLF $SSNNF $NVDA $MU $SOX $SOXX $SMH $DRAM $RAM $EWY $KORU
HBM uses 32% of Micron’s wafers to generate just 12% of revenue.
Read that again.
The market is pricing HBM purity at a premium, while open-market DDR5/LPDDR prices are exploding uncapped.
We broke down the wafer economics, the pricing asymmetry, and the exact clock for this trade:
https://t.co/X6xKMjOeYr
For my first post, I’m sharing a letter @NVIDIA signed on why open models matter.
AI will transform every industry, power every company, and be built by every country.
Open models strengthen safety and cybersecurity, accelerate innovation and diffusion, and enable sovereignty.
The world needs both frontier closed models and frontier open models.
https://t.co/AUKzoQ5Ikb
@AIStockSavvy Demand was never the question on $ORCL , the backlog settled that. Execution risk was. "Materially de-risked" on the build-out is exactly the datapoint bulls needed. Backlog + on-time capacity = $400 is a floor, not a stretch.
OAI projected spending on computing power to around $750 billion through 2030, up from a projection of roughly $600 billion earlier this year.
$ORCL ‘s future demand is NOT FAKE.
@WisemanCap Agree, the average 12-mo PT is 248 across 44 analysts, 29 of them stood for strong buy. 248 is already a doubled price based on today’s closing. And we look higher. Hold it until we make it
$ORCL is down 65% from its highs, trades at just 21x earnings, and is one of the biggest opportunities in the entire market.
The one and only reason $ORCL has been crushed is its massive reliance on OpenAI and their $300B compute deal.
The market fears OpenAI won’t be able to pay what it promised, leaving Oracle with hundreds of billions invested in infrastructure and no one to buy that capacity.
But as Co-CEO Clay Magouyrk said, the infrastructure AI customers need is largely the same.
If OpenAI can’t pay, $ORCL will have no shortage of customers for that capacity.
AI compute demand isn’t going anywhere.
The market is pricing in a disaster that won’t happen.
The market is repricing $ORCL as a leveraged credit crisis, completely ignoring a $638B wall of ironclad AI contracts. This isn't speculative capex; it's a pre-sold, OpenAI-backed path to a $2 Trillion market cap.
We Spent the last two weeks pulling Oracle's debt schedule apart, expecting to find the problem everyone's worried about. Instead we found this: of $130B in debt, only $39B comes due before 2032, which against ~$165B of earnings over the same window. Then we checked the construction sites. Michigan broke ground after the downgrade. Read the full financial teardown and capacity model:
https://t.co/iYN6VI3DvF