The Leaders Behind Modern Apple
Founded in 1976 by Steve Jobs, Steve Wozniak, and Ronald Wayne, Apple rose fast, stagnated for nearly two decades, almost died, and then came back to become the most valuable company in history.
Michael Scott, 1977–1981
Apple's first CEO. He scaled the Apple II and took the company public in 1980, one of the largest IPOs since Ford. His abrupt 1981 layoffs and his follow-up comment, “I'll fire people until it's fun again,” cost him the board's confidence, and he was pushed out.
Mike Markkula, 1981–1983
Employee number three and Apple's first major investor. He supplied the early funding and business discipline that turned a garage startup into a functioning company and recruited its next CEO.
John Sculley, 1983–1993
Recruited from Pepsi by Steve Jobs with the famous closing line "Do you want to sell sugar water for the rest of your life, or do you want to come with me and change the world?", Sculley grew revenue through the Macintosh and desktop publishing. Ironically, his power struggle with Jobs contributed to Jobs leaving in 1985. Apple later lost its direction as Windows gained dominance and expensive new bets, such as Newton, struggled.
Michael Spindler, 1993–1996
Presided over Apple's decline as Windows took the market. He spent his tenure quietly trying to sell Apple, holding merger talks with IBM, Sun, and Philips that all collapsed. The board eventually replaced him.
Gil Amelio, 1996–1997
He famously said Apple was "like a ship with a hole in the bottom and my job is to get the ship pointed in the right direction." His turnaround failed, but he made one of the most consequential decisions in Apple's history: acquiring NeXT in 1996, which brought Steve Jobs back.
Steve Jobs, 1997–2011
Apple was approaching bankruptcy when Jobs returned. He took a $1 annual salary as CEO. He cut the product line to four machines, secured a lifeline investment from Microsoft, and rebuilt the company around design and simplicity. The iMac, iPod, iTunes, retail stores, iPhone, and iPad turned a struggling computer maker into a global technology platform.
Revenue grew from about $7B to over $100B and market value from roughly $2B to $350B, a ~175x increase and one of the greatest corporate turnarounds in history.
Tim Cook, 2011–2026
Cook scaled what Jobs built into the world's largest company. Through operational mastery, he drove the iPhone to global dominance, turned Services into a growth engine, launched Apple Watch and AirPods, and transitioned Macs to Apple's own silicon. Market value grew to nearly $5T, a 14x gain, and revenue to over $400B. Some argued that innovation became more incremental under Cook.
John Ternus, 2026–Present
Apple's longtime hardware engineering chief took over in September 2026, with Cook now executive chairman. His challenge: find Apple's next growth engine.
Blackstone - From Advisory Boutique to over $1T in AUM
“Why not? If we came across the right opportunity in a great investment class at the right time, why not go for it?”
That philosophy became central to @blackstone evolution. Founded in 1985 by Stephen A. Schwarzman and Peter Peterson, Blackstone began as a mergers and acquisitions advisory firm before expanding across multiple alternative asset classes.
Private Equity Business
From its earliest years, the founders knew that many transactions required an investment partner. In 1987, after two years of advisory work, the firm raised its first private equity fund and began investing directly. Today, Private Equity is one of Blackstone’s largest businesses by AUM.
Multi Asset Investing
In 1990, Blackstone launched a hedge fund investment business, initially to manage capital for the firm’s senior executives. It later opened the platform to others and expanded it into fund-of-hedge-funds strategies, customized investment solutions, and other public and private market alternatives. The business ultimately evolved into Blackstone Multi-Asset Investing.
Real Estate
Blackstone established its real estate investment business in 1991. Its early activity included hospitality-related investments, and the platform subsequently expanded across office, logistics, residential, retail, data centers, and other property sectors in NA, Europe, and Asia.
Credit & Insurance
In 2008, Blackstone acquired GSO Capital Partners, which managed roughly $10B at the time. The acquisition established the foundation of Blackstone’s credit platform, which later expanded across private credit, liquid credit, asset-based finance, infrastructure credit, and insurance-related investment management. Today, Credit & Insurance is Blackstone’s largest business by total AUM.
Key Millstones
2007: Blackstone became a publicly traded partnership on the NYSE under the ticker BX, raising over $4B in its IPO.
2015: Spun off its advisory and restructuring businesses, sharpening its focus on alternative asset management.
2019: Converted from a publicly traded partnership into a corporation. The change broadened the potential investor base for its shares.
Today
Blackstone is the world’s largest alternative asset manager, with approximately $1.35T in AUM as of June 30, 2026, with the following breakdown:
· Real Estate ($314B), spanning global, Europe, and Asia
· Private Equity ($454B), including Corporate Private Equity, Energy Transition, Infrastructure, Life Sciences, and related strategies
· Credit & Insurance ($469B)
· Multi-Asset Investing ($109B)
From an advisory firm to $1.35T in AUM, Blackstone’s growth reflects decades of expansion across alternative assets.
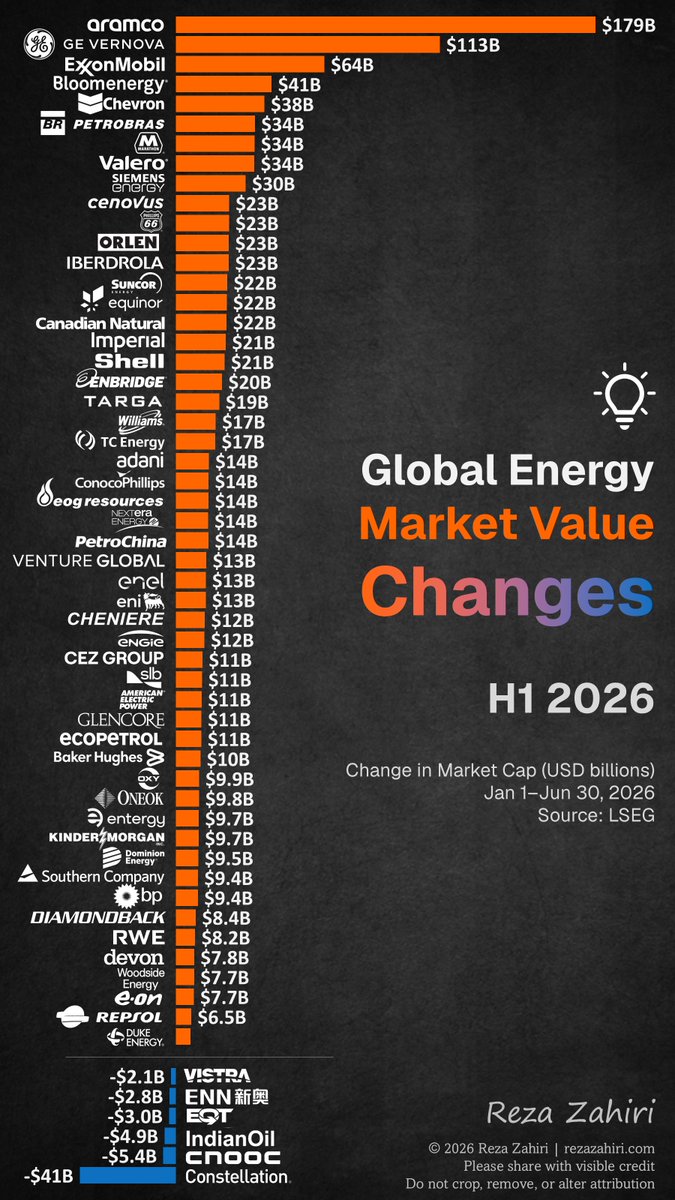
Global #energy companies created substantial market value during the first half of 2026, but the gains were not evenly distributed.
The largest increases came from:
• Saudi Aramco: +$179B
• GE Vernova: +$113B
• ExxonMobil: +$64B
• Bloom Energy: +$41B
• Chevron: +$38B
Power infrastructure companies continued to benefit from rising electricity demand, driven by #AI #datacenters, electrification, and grid modernization. GE Vernova and Bloom Energy were among the largest beneficiaries.
Integrated energy companies, including Saudi Aramco, ExxonMobil, Chevron, Petrobras, Shell, and TotalEnergies, also created significant market value, supported by resilient energy demand, strong cash generation, and disciplined capital allocation.
The medical imaging industry is a diverse ecosystem spanning multiple imaging modalities, clinical applications, and competitive landscapes.
The global medical imaging equipment market was approximately $45B in 2025. At a high level, it consisted of five major modalities:
→ 𝐗-𝐫𝐚𝐲: $13.5B
→ 𝐔𝐥𝐭𝐫𝐚𝐬𝐨𝐮𝐧𝐝: $10.3B
→ 𝐌𝐑𝐈: $8.0B
→ 𝐂𝐓: $7.0B
→ 𝐍𝐮𝐜𝐥𝐞𝐚𝐫 𝐈𝐦𝐚𝐠𝐢𝐧𝐠: $5.2B
Each modality serves a distinct set of clinical needs:
• 𝐔𝐥𝐭𝐫𝐚𝐬𝐨𝐮𝐧𝐝: spans radiology, cardiology, women’s health, point-of-care, surgery, urology, and vascular imaging.
• 𝐗-𝐫𝐚𝐲: extends beyond general radiography to orthopedics, dental imaging, mammography, and C-arms used in image-guided procedures.
• 𝐌𝐑𝐈: plays a central role in neurology, oncology, musculoskeletal imaging, and cardiovascular assessment.
• 𝐂𝐓: is widely used across oncology, cardiology, neurology, trauma, and emergency medicine.
• 𝐍𝐮𝐜𝐥𝐞𝐚𝐫 𝐈𝐦𝐚𝐠𝐢𝐧𝐠: supports oncology, cardiology, and neurology through functional and molecular imaging.
A handful of companies, including GE HealthCare, Philips, Siemens Healthineers, Fujifilm Group, Canon, and United Imaging Healthcare, compete across multiple modalities. Many others have built strong positions by specializing in a single technology or clinical niche.
In my previous post, I looked at Biopharma stock performance in the first half of 2026. However, percentage returns alone do not capture the full picture. A 20% move in a large-cap company creates or destroys far more value than the same move in a smaller company.
Looking at changes in market capitalization provides a different perspective.
Johnson & Johnson and Eli Lilly and Company led the sector, each adding over $100 billion in market value. Merck, AbbVie, Novartis, and Amgen also generated substantial shareholder value during the period.
On the other hand, companies such as Zoetis, CSL, Alnylam Pharmaceuticals, Insmed Incorporated, AstraZeneca, Regeneron, and Novo Nordisk experienced major declines.
I previously looked at MedTech stock performance during the first half of 2026. However, a 20% decline in a large-cap company is fundamentally different from that in a small-cap company. Looking at changes in market capitalization better reflects the magnitude of value created or destroyed in investors' eyes.
Here is a look at the same period through a different lens: market value created and destroyed. Across the companies in this analysis, roughly half a trillion dollars in market value was wiped out during the first six months of 2026.
The first half of 2026 was highly uneven across biopharma and life sciences stocks, including pharma, biotech, diagnostics, life sciences tools, CDMOs, and specialty therapeutics.
Several companies delivered strong gains, led by Moderna, WuXi AppTec, Bayer, Exelixis, Johnson & Johnson, West Pharmaceutical Services, Zydus Group, Torrent Pharmaceuticals Ltd, Quest Diagnostics, and Merck.
Others faced meaningful declines, including Zoetis, Insmed Incorporated, Bausch Health Companies Inc., CSL, Grifols, Daiichi Sankyo US, and Alnylam Pharmaceuticals.
When people think about AI, they often think about applications like ChatGPT, Claude, Gemini, Copilot, or Perplexity. But the AI boom has created value across a much broader ecosystem, not just at the application layer.
I previously wrote about Jensen Huang’s description of AI as a five-layer cake, where each layer depends on the one below it:
𝐄𝐧𝐞𝐫𝐠𝐲 powers the stack: power generation, transmission, grid storage, on-site power.
↓
𝐂𝐡𝐢𝐩𝐬 convert energy into compute capacity: foundries, GPUs/ASICs, memory, interconnects.
↓
𝐈𝐧𝐟𝐫𝐚𝐬𝐭𝐫𝐮𝐜𝐭𝐮𝐫𝐞 turns chips into usable scale: hyperscale cloud, GPU clouds, data centers, orchestration, cooling.
↓
𝐌𝐨𝐝𝐞𝐥𝐬 convert compute and data into intelligence: foundation, reasoning, multimodal, small & edge, domain-specific.
↓
𝐀𝐩𝐩𝐥𝐢𝐜𝐚𝐭𝐢𝐨𝐧𝐬 put that intelligence in front of users: consumer, enterprise, coding, creative, healthcare, robotics, industrial.
Looking at H1 2026 stock performance, many of the strongest performers were not application companies. Memory, storage, semiconductor equipment, AI infrastructure, and power-related businesses dominated much of the leaderboard, with some stocks rising more than 7x in just six months.
This reflects where today’s bottlenecks are. A few years ago, the constraints were GPUs and foundation models, which drove significant gains in NVIDIA’s stock and the valuations of private companies like OpenAI and Anthropic. Today, memory, storage, power, and data center capacity have become equally important.
The first half of 2026 was unforgiving for many #MedTech stocks. While companies such as axogen, Glaukos Corporation, Demant, and Envista Holdings Corporation gained momentum, many others ended H1 deep in the red.
Scale did not provide much protection either. Boston Scientific, one of the most valuable MedTech companies, saw its share price fall by more than half. Several other large-cap MedTech names, including Mindray, Abbott, Intuitive, GE HealthCare, Siemens Healthineers, and Danaher, also declined sharply.
Short-term #stock performance is never a complete measure of long-term value creation. But the first half of 2026 does suggest a meaningful recalibration in investor expectations across parts of the MedTech sector. For some investors, this reset may create opportunities where the underlying fundamentals remain strong.
I previously wrote about the top #pharma and #biotech companies by market cap and their respective employee counts. One way to normalize these numbers is to divide the market value by the number of employees, yielding a “market cap per employee” metric.
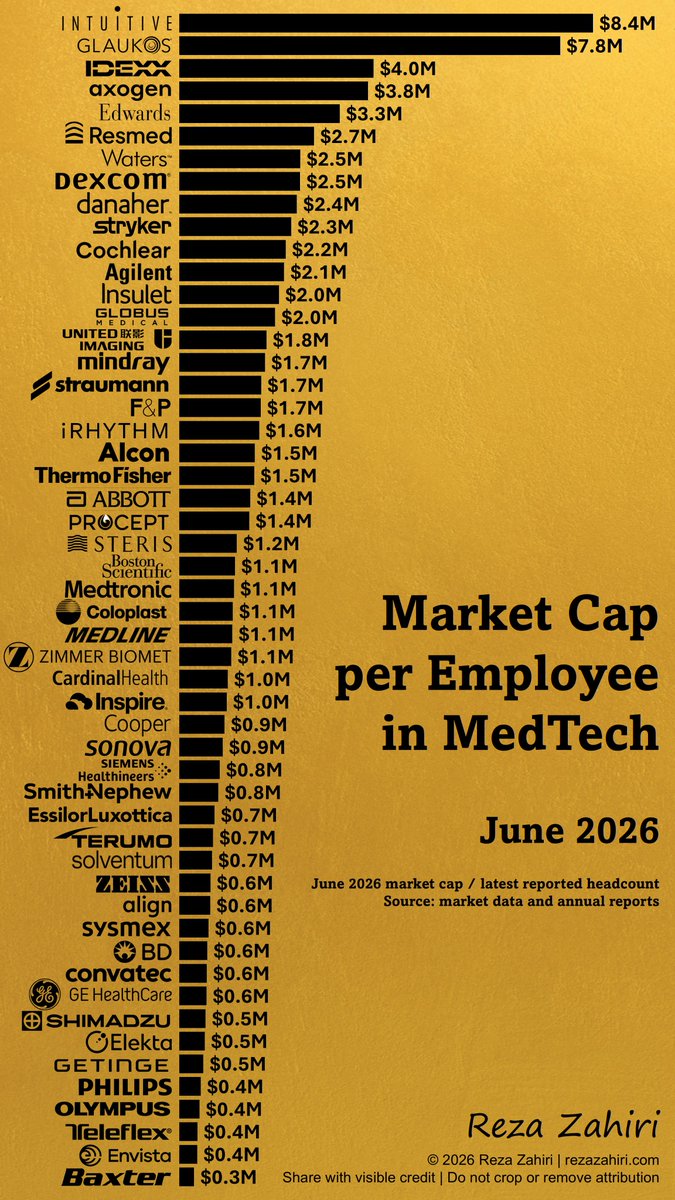
A company that generates greater shareholder value with fewer employees is generally more appealing to investors and employees.
I previously wrote about the top #energy companies by market cap and their respective employee counts. One way to normalize these numbers is to divide the market value by the number of employees, yielding a “market cap per employee” metric.
A company that generates greater shareholder value with fewer employees is generally more appealing to investors and employees.
I previously wrote about the top #medtech companies by market cap and their respective employee counts. One way to normalize these numbers is to divide the market cap by the number of employees, yielding a “market cap per employee” metric.
Here’s a look at some of the world’s most valuable publicly traded Energy companies by market capitalization across oil & gas, utilities, power technology, and energy services
Here’s a look at some of the world’s most valuable publicly traded biopharma companies by market capitalization across pharmaceuticals, biotechnology, and life sciences services:
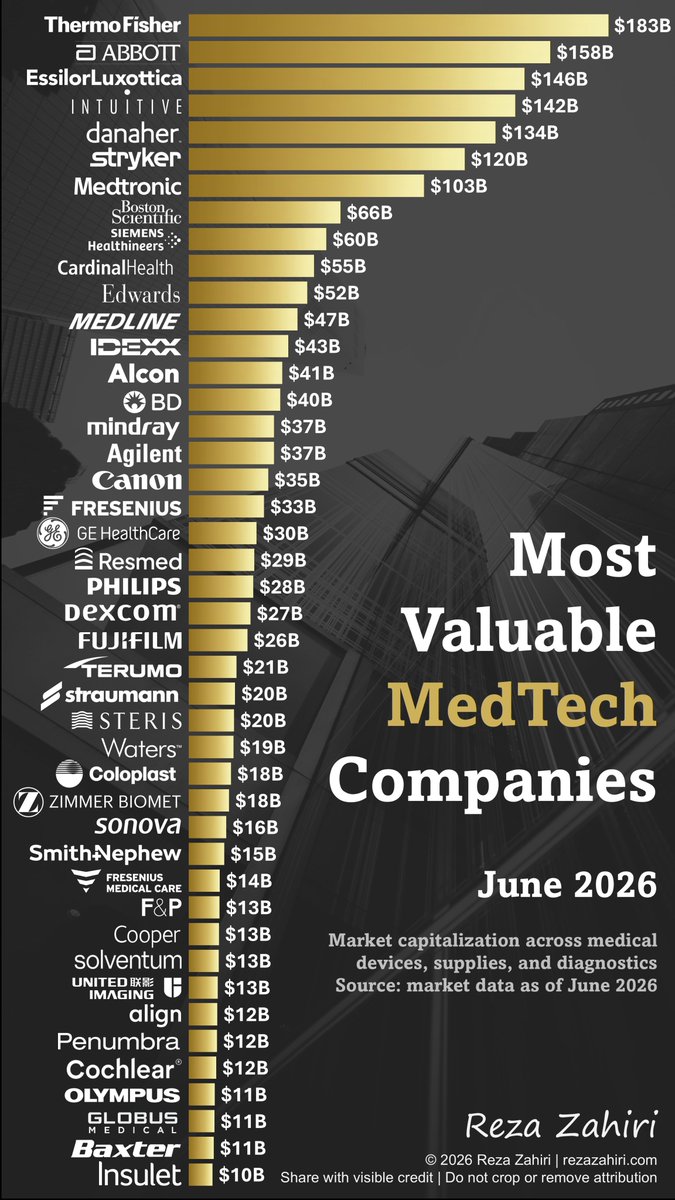
Here’s a look at some of the world’s most valuable publicly traded MedTech companies by market capitalization across medical devices, medical supplies, and diagnostics:
The global energy sector employs millions of people worldwide.
Here’s a look at some of the largest energy employers in 2026, ranked by global employee count across oil & gas, utilities, power technology, and energy services.
The global #pharma and life sciences industry employs millions of people worldwide.
Here’s a look at some of the largest employers in 2026, ranked by global employee count across pharma, biotech, diagnostics, and life sciences services.
The global #MedTech industry employs millions of people worldwide. Here’s a look at some of the largest MedTech #employers in 2026, ranked by global employee count across medical devices, medical technology, medical supplies, and diagnostics.
Pharma Stock Performance 2025
Here is an overview of the annual performance of several leading biopharma companies (market capitalization > $10B). Only stocks with gains above 5% or declines below −5% are shown.
Medical Device Stock Performance in 2025
Here is an overview of the annual performance of several leading medical device stocks. Only stocks with gains above 5% or declines below −5% are shown.