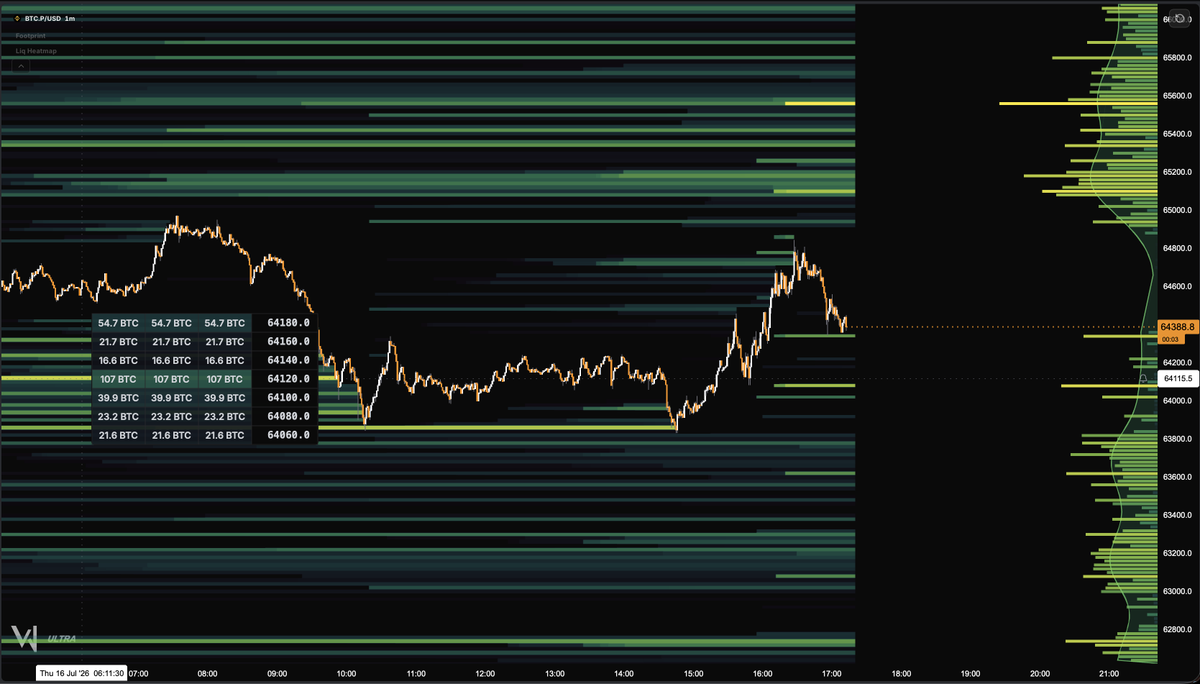
As the founder of LiquidVol, I built the liquidation heatmap I always wanted to use. Fast, customizable, packed with themes, available on multi-chart layouts, and free. Open Indicators and click Liquidation Heatmap to add it to your charts. #Bitcoin#OrderFlow#CryptoTrading
🚀 LiquidVol 3.0 just dropped.
A completely rebuilt platform with better data, powerful new features, and a much smoother experience.
This is our biggest update yet—and only the beginning.
Just watch the video demonstration.
LiquidVol 3.0 is coming.
Fixed Range Volume Profile and Fixed Range Delta Profile are now available directly from the left drawing toolbar, making them extremely fast and easy to access.
Once placed, a floating settings widget allows you to adjust the profile configuration instantly without interrupting your chart workflow.
The Value Area Profile will also include TPO, with a fully customizable Fixed Range TPO Profile that can be drawn smoothly and viewed in split or accumulated mode.
And do not be fooled by platforms in this space that charge extra for TPO while delivering tools that are unnecessarily complicated and frustrating to use. Traders should not have to pay a premium for functionality that feels poorly designed and difficult to work with.
The complete version is not live yet and will be released soon.
We are the first in the space to offer Value Area Profile with integrated TPO and dynamic fixed range TPO. Watch out, others will slowly try to copy as they start running out of ideas 😂
#LiquidVol #OrderFlow #CryptoTrading #TradingTools
@TeamLiquidVol Look at the bubbles right at the walls.
That is where the absorption shows. Price hits the liquidity level, volume comes in, and the reaction happens there. To me, that looks more like filled orders than a last-second pull.
New day, new market read.
Chart reads left to right: early buyers step in, resting buy liquidity below gets swept, sellers fail to continue, and price rotates higher.
In the zoomed section, liquidity was taken and the liquidation oscillator showed liquidations appearing at the level, but price still failed to continue lower. That trapped late sellers and helped drive the move back up.
Later, upper liquidity was taken with no real rejection, showing buyers stayed in control.
Now price is pressing toward the next resting sell orders above.
To view this on LiquidVol:
Open the Order Flow button in the navigation bar → turn on OB Heatmap → set Bubble Trades current filter to 24 minimum → for Liquidated Trades, open Discovery and search for it.
No trade suggestion, just showing how order flow tools help explain price reaction in real time.
#OrderFlow #Liquidity #RestingOrders #Footprint #VolumeProfile #PriceAction #MarketStructure #TradingEducation #IntradayTrading #TradingTools
@Robwhitlow3 Order flow isn’t hard, the platforms are. Most tools overwhelm traders with information, making it seem impossible to learn. Once you know what to focus on, it all starts to make sense.