I’m going to use this account to write more consistently about Bitcoin, Hyperliquid and crypto markets.
Mostly notes, research, thoughts and mistakes I’m learning from.
The goal is simple: less noise, more signal.
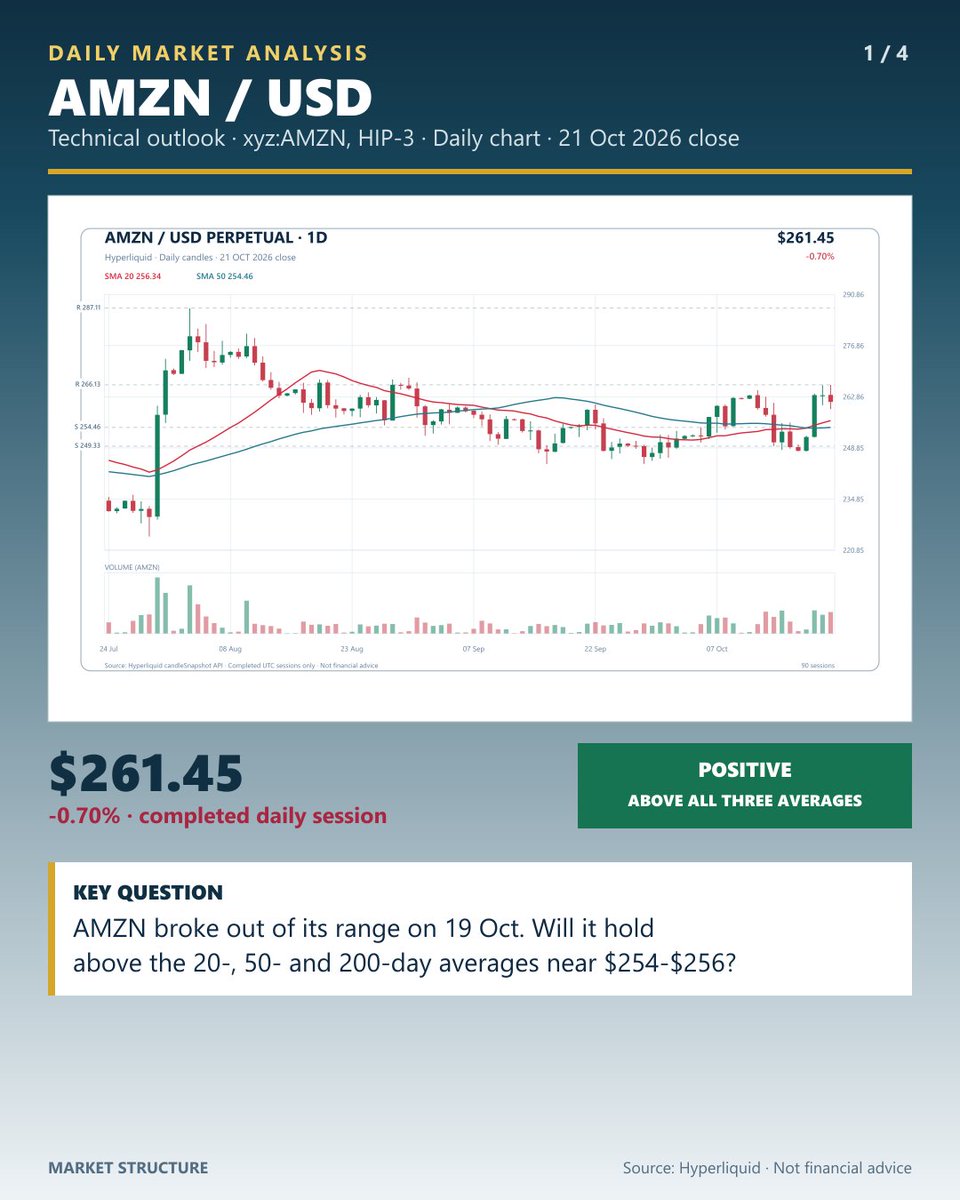
$AMZN — POSITIVE, BROKE OUT OF ITS RANGE AND NOW ABOVE ALL THREE AVERAGES (WAS NEUTRAL ON 30 SEP)
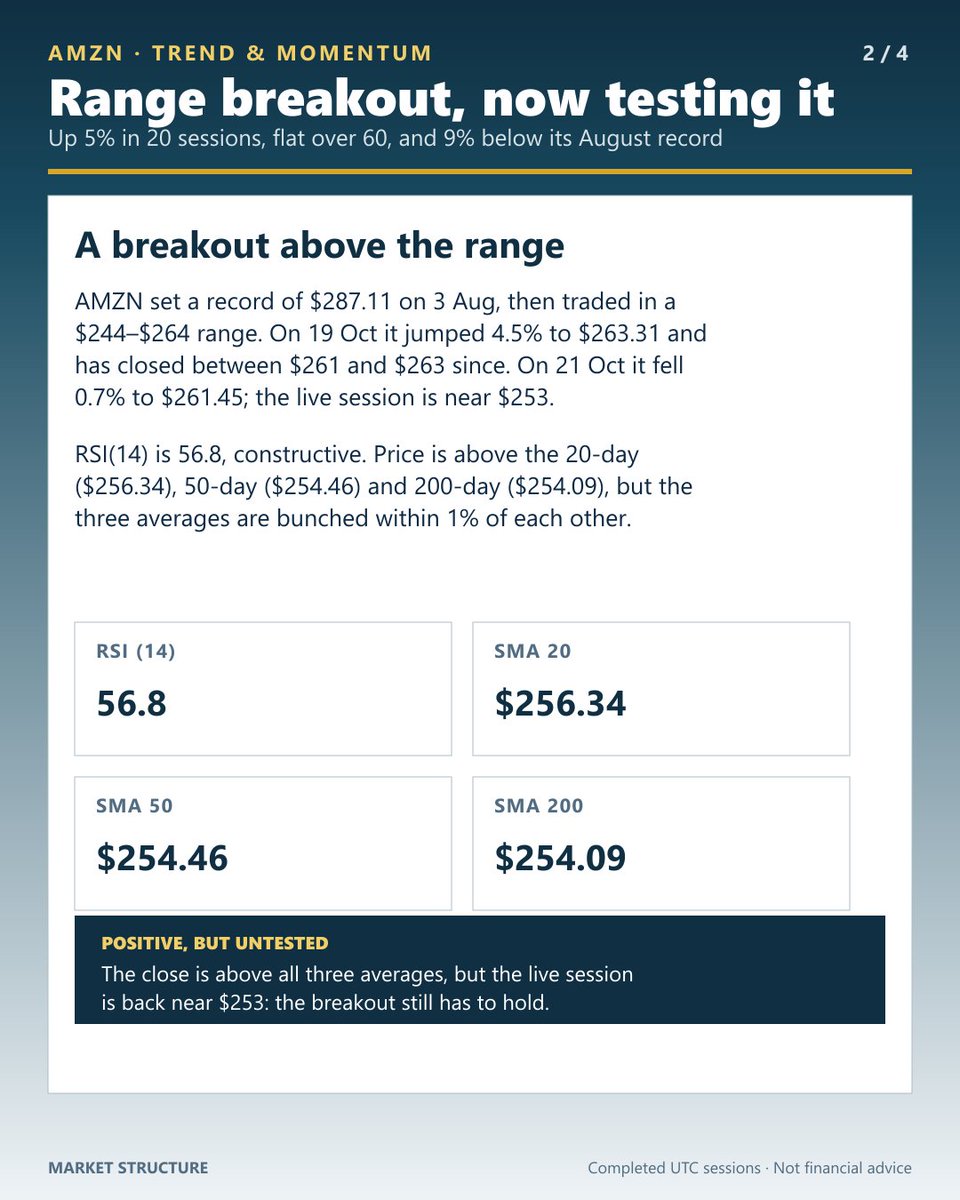
AMZN (xyz:AMZN on Hyperliquid) closed at $261.45 on 21 Oct 2026, down 0.70% on the session and 8.9% below its $287.11 record of 3 Aug.
On 30 Sep it was neutral, tangled around the 200-day inside a $244–$261 range. On 19 Oct it jumped 4.5% to $263.31 and has closed between $261 and $263 since, clearing the $261.08 level we flagged. It is up 5% over 20 sessions and flat over 60 (+1%). RSI(14) is 56.8, and price is above its 20-day ($256.34), 50-day ($254.46) and 200-day ($254.09), which are bunched within 1% of each other. ATR is 2.2% of price and 21 Oct volume was 1.9x its 20-day average. The live session is near $253, so the breakout still has to hold.
Bullish scenario: a daily close above $266.13 (the 21 Oct high) would extend the breakout and reopen the path toward the $287.11 record.
Risk scenario: a close below $249.33 (the 14 Oct low) would lose all three averages and send price back inside the old range, invalidating the breakout.
Levels to watch:
• Resistance: $266.13 / $287.11
• Support: $254.46 / $249.33
• Bearish trigger: close below $249.33
Full technical setup in the attached chart.
Trade perpetuals on Hyperliquid:
https://t.co/BgNRoVAdML
#ad — Referral link. I may receive benefits if you join through it.
Data: Hyperliquid xyz:AMZN perpetual, completed daily candles through 21 Oct 2026 UTC. Not financial advice.
#AMZN #Amazon #Hyperliquid
$ZEC — POSITIVE, BACK ABOVE ALL THREE AVERAGES AFTER A 17% REBOUND (WAS NEUTRAL ON 3 OCT)
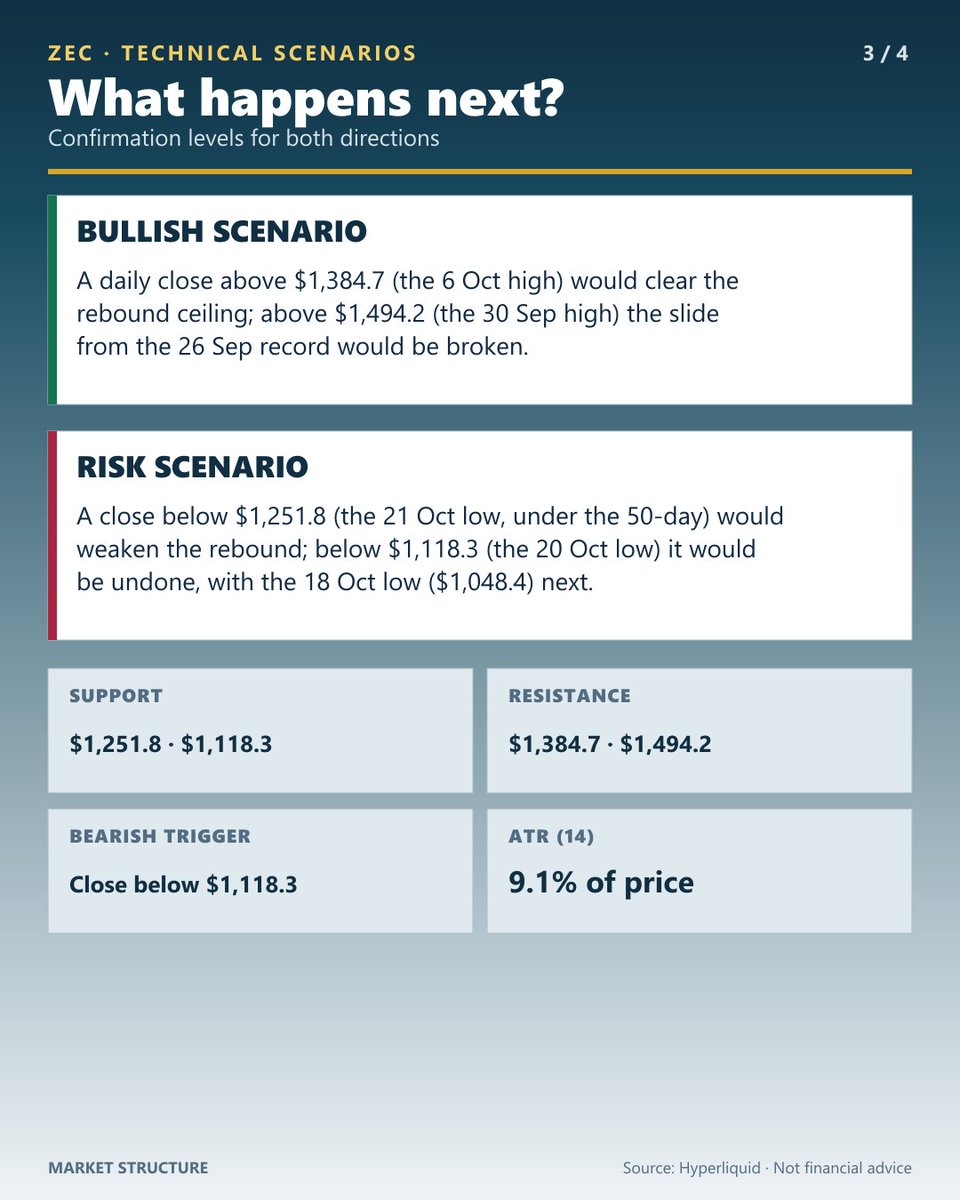
ZEC (Hyperliquid perpetual) closed at $1,315.0 on Wed 21 Oct 2026, up 4.56% on the session and 22% below its $1,695.0 record high of 26 Sep.
Update on our 3 Oct analysis (NEUTRAL at $1,305.7, support $1,272, resistance $1,442 and $1,494): the risk scenario played out first. ZEC closed below $1,272 and fell 22% from its $1,438.6 close on 30 Sep to $1,127.4 on 17 Oct, with a low of $1,048.4 on 18 Oct, close to the old $1,046 support, which held. It then rebounded 17% to $1,315.0, above its 20-day ($1,238.7), 50-day ($1,281.1) and 200-day ($693.0), on 1.2x its 20-day average volume. It is down 1.6% over 20 sessions but up 64% over 60. RSI(14) is 54.6. ATR is 9.1% of price, so daily swings are very large. In the new session price is down about 6.1%, near $1,235.3, giving back the rebound and sitting on the 20-day.
Bullish scenario: a daily close above $1,384.7 (the 6 Oct high) would clear the rebound ceiling; above $1,494.2 (the 30 Sep high) the slide from the record would be broken.
Risk scenario: a close below $1,251.8 (the 21 Oct low, under the 50-day) would weaken the rebound; below $1,118.3 (the 20 Oct low) it would be undone, with the 18 Oct low ($1,048.4) next.
Levels to watch:
• Resistance: $1,384.7 / $1,494.2
• Support: $1,251.8 / $1,118.3
• Bearish trigger: close below $1,118.3
Full technical setup in the attached chart.
Trade perpetuals on Hyperliquid:
https://t.co/BgNRoVAdML
#ad — Referral link. I may receive benefits if you join through it.
Data: Hyperliquid ZEC perpetual, completed daily candles through 21 Oct 2026 UTC. Not financial advice.
#ZEC #Hyperliquid
$SUI — NEUTRAL, BELOW ITS 20-DAY BUT ABOVE ITS 50- AND 200-DAY AFTER THE $1.00 FLOOR BROKE (WAS POSITIVE ON 29 SEP)
SUI (Hyperliquid perpetual) closed at $1.0282 on Wed 21 Oct 2026, down 0.16% on the session and 81% below its $5.3746 high of 6 Jan 2025.
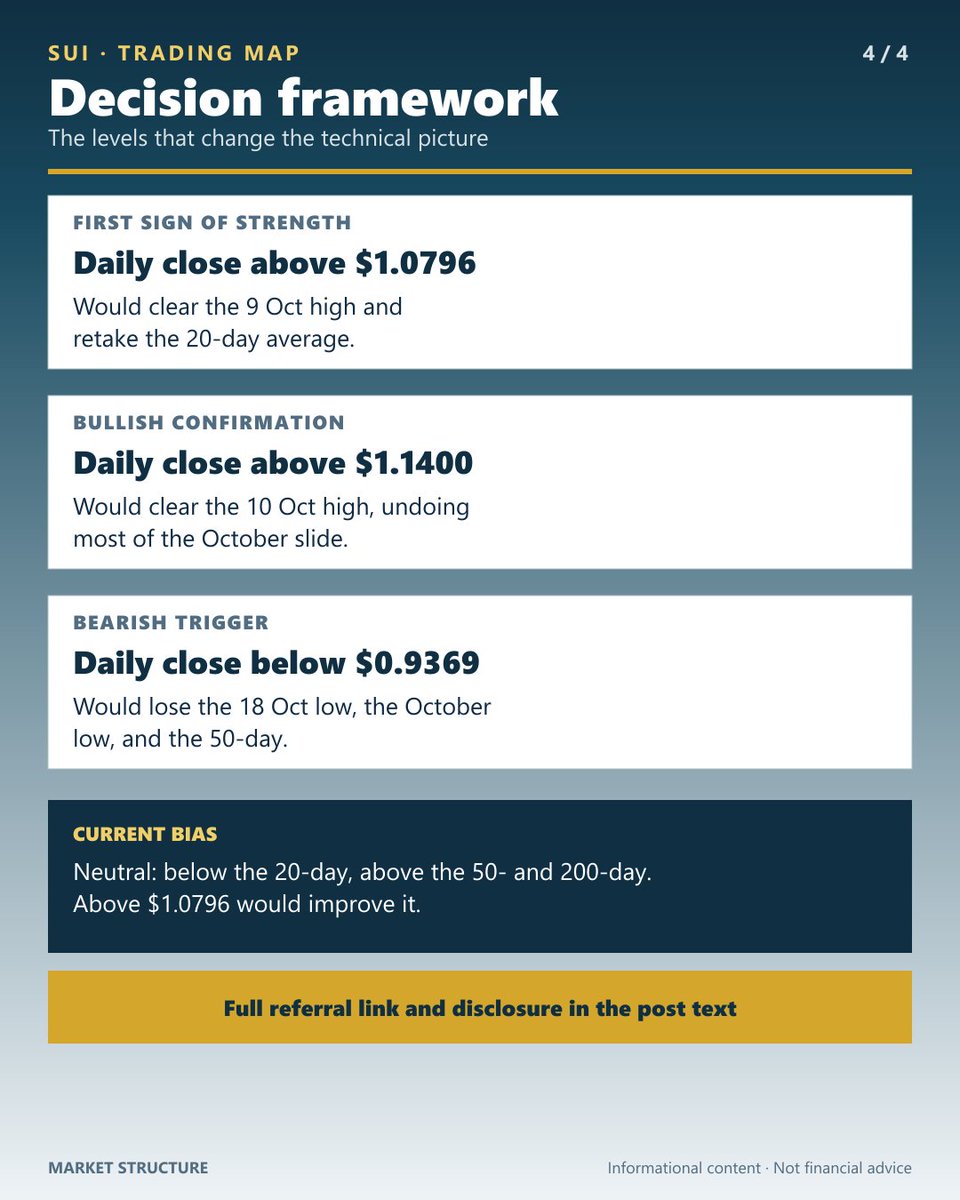
Update on our 29 Sep analysis (POSITIVE at $1.153, target $1.294, invalidation below $1.00): the bullish path never played out, with a highest close of $1.2142 on 5 Oct. Instead SUI fell 20% to $0.97561 on 17 Oct, closing under $1.00, so the invalidation was hit. It has since recovered to $1.0282, 15% below its 5 Oct close, on 0.5x its 20-day average volume. It is down 13% over 20 sessions but still up 26% over 60. RSI(14) is 49.1, and price sits below its 20-day ($1.0798) but above its 50-day ($0.9708) and 200-day ($0.8651). ATR is 7.1% of price. In the new session price is down about 4.1%, near $0.9863, back under $1.00 and still above the 50-day.
Bullish scenario: a daily close above $1.0796 (the 9 Oct high, at the 20-day) would retake it; above $1.1400 (the 10 Oct high) the October slide would be largely reversed.
Risk scenario: a close below $1.0175 (the 21 Oct low) would pressure the rebound; below $0.9369 (the 18 Oct low, the October low) the 50-day ($0.9708) would be lost, with the 200-day far below.
Levels to watch:
• Resistance: $1.0796 / $1.1400
• Support: $1.0175 / $0.9369
• Bearish trigger: close below $0.9369
Full technical setup in the attached chart.
Trade perpetuals on Hyperliquid:
https://t.co/BgNRoVAdML
#ad — Referral link. I may receive benefits if you join through it.
Data: Hyperliquid SUI perpetual, completed daily candles through 21 Oct 2026 UTC. Not financial advice.
#SUI #Hyperliquid
$ADA — NEUTRAL, THE BREAKOUT FAILED: BELOW ITS 20- AND 50-DAY, ABOVE ITS 200-DAY (WAS POSITIVE ON 28 SEP)
ADA (Hyperliquid perpetual) closed at $0.22496 on Wed 21 Oct 2026, up 0.46% on the session and 83% below its $1.3281 high of 3 Dec 2024.
Update on our 28 Sep analysis (POSITIVE at $0.2472, resistance $0.2656, invalidation below $0.2280): the bullish path played out first, with closes above $0.2656 on 5 Oct ($0.27048) and a $0.2829 high on 6 Oct. It then reversed: ADA fell 19% to $0.21933 on 17 Oct and closed below $0.2280 on 16 Oct, so the invalidation was hit. A 2.6% rebound since has taken it to $0.22496, 17% below its 5 Oct close, on 0.7x its 20-day average volume. It is down 8.6% over 20 sessions and 0.6% over 60. RSI(14) is 44.8, and price sits below its 20-day ($0.23892) and 50-day ($0.23095) but above its 200-day ($0.21177). ATR is 6.5% of price. In the new session price is down about 3.5%, near $0.21699, 2.5% above the 200-day.
Bullish scenario: a daily close above $0.24025 (the 13 Oct high, above the 20- and 50-day) would retake both; above $0.25599 (the 12 Oct high) the October drop would be largely reversed.
Risk scenario: a close below $0.22188 (the 21 Oct low) would pressure the rebound; below $0.21091 (the 18 Oct low, near the 200-day at $0.21177) the long-term average would be lost.
Levels to watch:
• Resistance: $0.24025 / $0.25599
• Support: $0.22188 / $0.21091
• Bearish trigger: close below $0.21091
Full technical setup in the attached chart.
Trade perpetuals on Hyperliquid:
https://t.co/BgNRoVAdML
#ad — Referral link. I may receive benefits if you join through it.
Data: Hyperliquid ADA perpetual, completed daily candles through 21 Oct 2026 UTC. Not financial advice.
#ADA #Hyperliquid
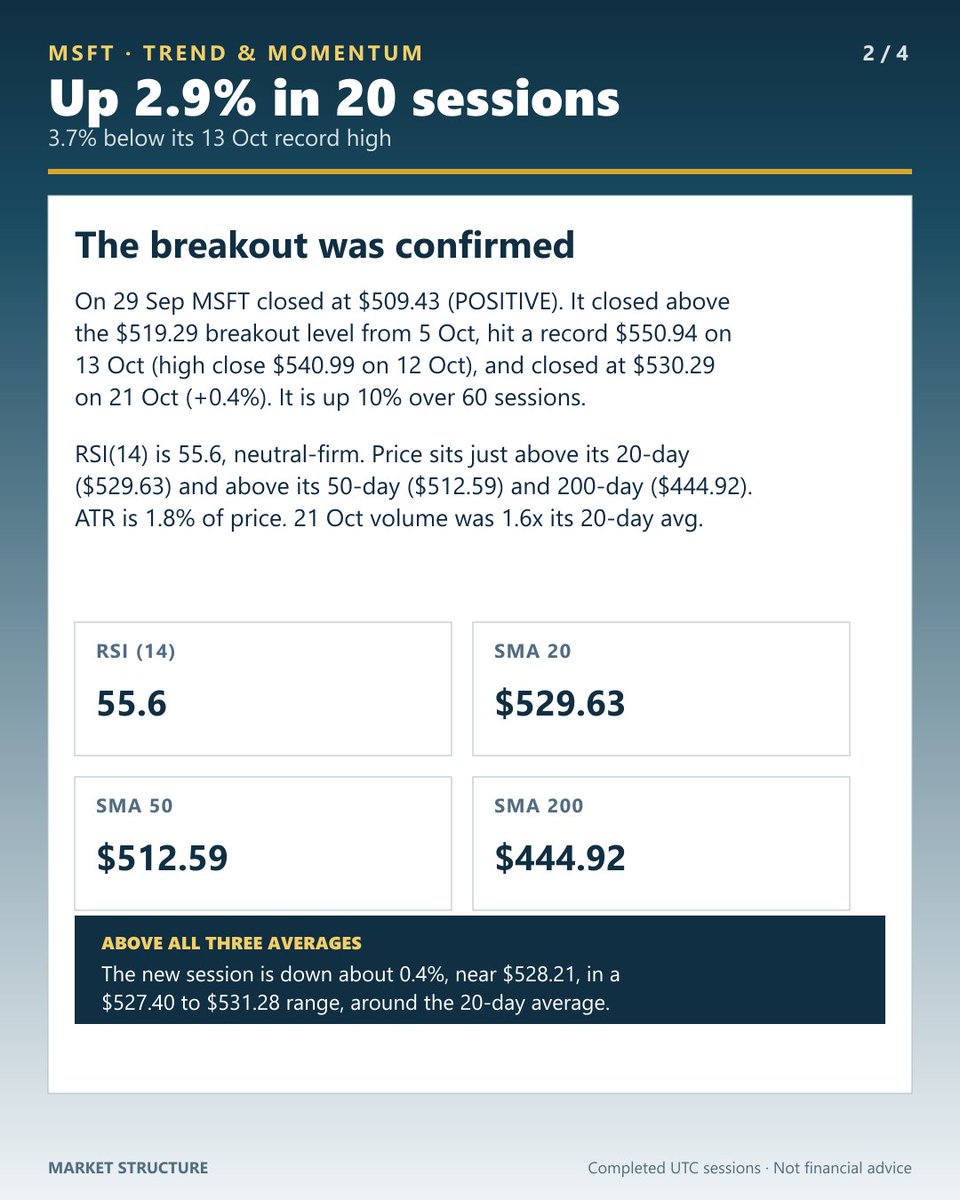
$MSFT — POSITIVE, BREAKOUT CONFIRMED AND STILL ABOVE ALL THREE AVERAGES, 3.7% BELOW ITS RECORD
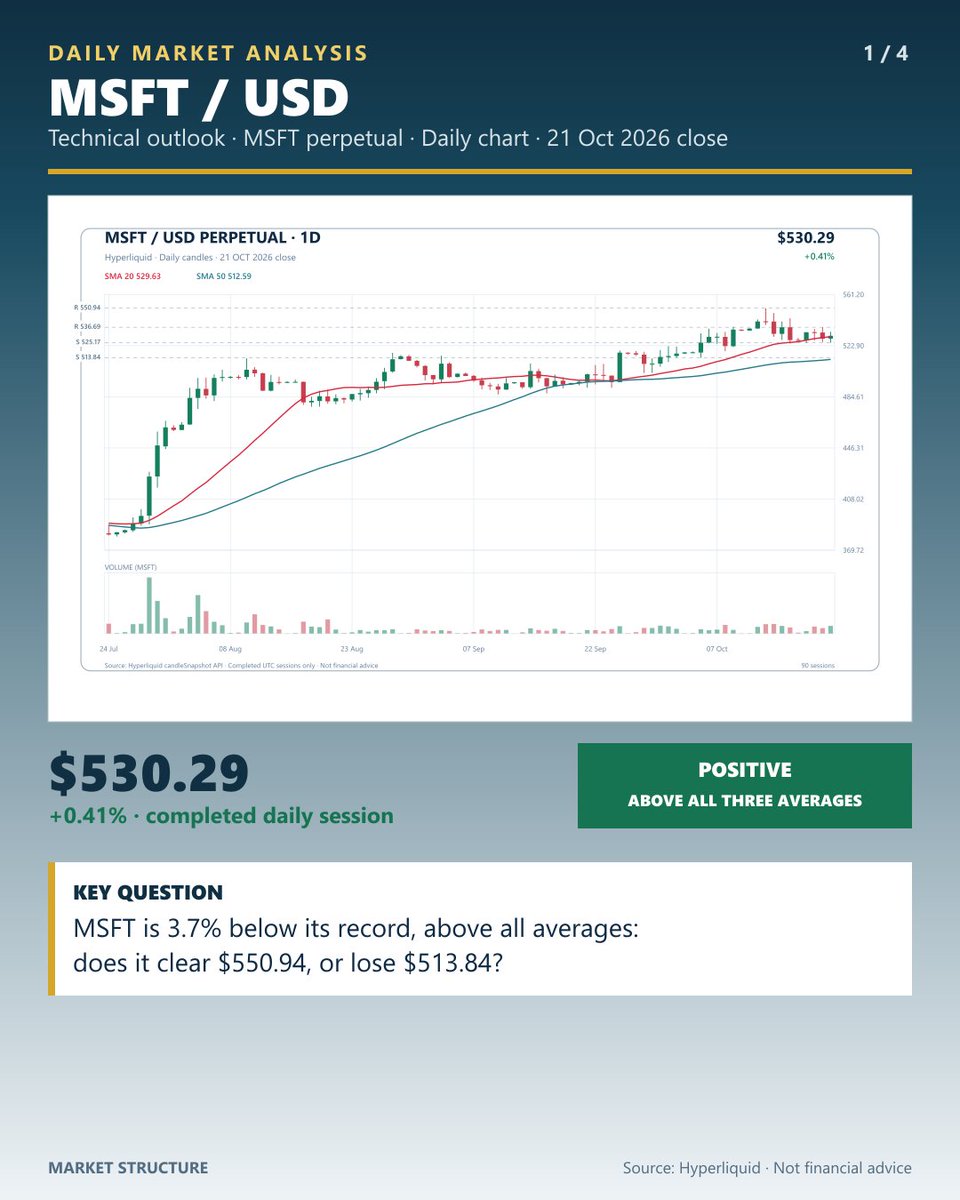
MSFT (xyz:MSFT on Hyperliquid) closed at $530.29 on Wed 21 Oct 2026, up 0.41% on the session and 3.7% below its $550.94 record high of 13 Oct.
Update on our 29 Sep analysis (POSITIVE at $509.43, breakout level $519.29, invalidation $491.30): the bullish scenario played out. MSFT closed above $519.29 from 5 Oct, hit the $550.94 record on 13 Oct (highest close: $540.99 on 12 Oct) and has pulled back since, with a close of $530.29 on 21 Oct on 1.6x its 20-day average volume. The $491.30 invalidation was never tested. It is up 2.9% over 20 sessions and 9.9% over 60. RSI(14) is 55.6, and price sits just above its 20-day ($529.63) and above its 50-day ($512.59) and 200-day ($444.92). ATR is 1.8% of price. In the new session price is down about 0.4%, near $528.21, around the 20-day.
Bullish scenario: a daily close above $536.69 (the 20 Oct high) would clear the latest lower high; above $550.94 (the 13 Oct record high) MSFT would hold a new high on a closing basis.
Risk scenario: a close below $525.17 (the 21 Oct low, under the 20-day) would weaken the advance; below $513.84 (the 5 Oct low, near the 50-day) the October breakout would be at risk.
Levels to watch:
• Resistance: $536.69 / $550.94
• Support: $525.17 / $513.84
• Bearish trigger: close below $513.84
Full technical setup in the attached chart.
Trade tokenized stock perpetuals on Hyperliquid:
https://t.co/BgNRoVAdML
#ad — Referral link. I may receive benefits if you join through it.
Data: Hyperliquid xyz:MSFT perpetual, completed daily candles through 21 Oct 2026 UTC. This is a synthetic HIP-3 perpetual, not the underlying stock. Not financial advice.
#MSFT #Hyperliquid
$STBL — NEUTRAL, ABOVE ITS 20-DAY BUT BELOW ITS 50- AND 200-DAY AFTER A ONE-DAY SPIKE
STBL (Hyperliquid perpetual) closed at $0.02466 on Mon 19 Oct 2026, up 7.57% on the session and 96% below its $0.61138 high of 24 Sep 2025.
STBL fell 15% from $0.02559 on 5 Oct to $0.02173 on 14 Oct, then rose 19.5% on 15 Oct. On 16 Oct it spiked to $0.05337 on 248M units of volume and closed at $0.02441; that wick is not a level the market held. It is down 6% over 20 sessions and 9% over 60. RSI(14) is 50.4, and price is above its 20-day ($0.02430) but below its 50-day ($0.02532) and 200-day ($0.02776). ATR is 15.5% of price, inflated by the 16 Oct wick, and 19 Oct volume was 0.6x its 20-day average, which includes the spike.
Bullish scenario: a daily close above $0.02611 (the 15 Oct high, above the 50-day) would retake the 50-day; above $0.02710 (the 18 Oct high, near the 200-day) the October slide would be reversed.
Risk scenario: a close below $0.02208 (the 19 Oct low) would fade the bounce; below $0.02032 (the 15 Oct low) the October low would be lost, with $0.01983 (the 18 Jul low) the low of this series.
Levels to watch:
• Resistance: $0.02611 / $0.02710
• Support: $0.02208 / $0.02032
• Bearish trigger: close below $0.02032
Full technical setup in the attached chart.
Trade perpetuals on Hyperliquid:
https://t.co/BgNRoVAdML
#ad — Referral link. I may receive benefits if you join through it.
Data: Hyperliquid STBL perpetual, completed daily candles through 19 Oct 2026 UTC (republished with the corrected title). Not financial advice.
#STBL #Hyperliquid
$GOLD — NEGATIVE, STILL BELOW ALL THREE AVERAGES AND TESTING THE $4,071 SUPPORT AGAIN
GOLD (xyz:GOLD perpetual on Hyperliquid) closed at $4,126.50 on Wed 21 Oct 2026, up 0.25% on the session and 26% below its $5,600.20 high of 29 Jan.
Update on our 13 Oct analysis (NEGATIVE at $4,157.00, support $4,071.10, resistance $4,224.40): the rating holds and no level was cleared on a daily close. GOLD closed between $4,114.20 and $4,183.90 from 14 to 21 Oct, never above the $4,224.40 resistance and never below $4,071.10 (the lowest recent close is $4,110.90, on 7 Oct). It is down 1.4% over 20 sessions and 10% over 60. RSI(14) is 41.7, and price is below its 20-day ($4,151.93), 50-day ($4,256.33) and 200-day ($4,360.02). ATR is 1.3% of price, and 21 Oct volume was 0.9x its 20-day average. In the new session price is down about 0.8%, near $4,093, after a low of $4,068.60, just under the $4,071.10 support intraday.
Bullish scenario: a daily close above $4,224.40 (the 2 Oct high) would clear the 20-day; above $4,385.60 (the 21 Sep high, near the 200-day) the decline would be reversed.
Risk scenario: a daily close below $4,071.10 (the 7 Oct low) would extend the decline from the 22 Sep high; below $3,949.00 (the 30 Jun low) the lowest level in this data would be reached.
Levels to watch:
• Resistance: $4,224.40 / $4,385.60
• Support: $4,071.10 / $3,949.00
• Bearish trigger: close below $4,071.10
Full technical setup in the attached chart.
Trade perpetuals on Hyperliquid:
https://t.co/BgNRoVAdML
#ad — Referral link. I may receive benefits if you join through it.
Data: Hyperliquid xyz:GOLD perpetual, completed daily candles through 21 Oct 2026 UTC. This is a synthetic HIP-3 perpetual, not the underlying metal. Not financial advice.
#GOLD #XAU #Hyperliquid
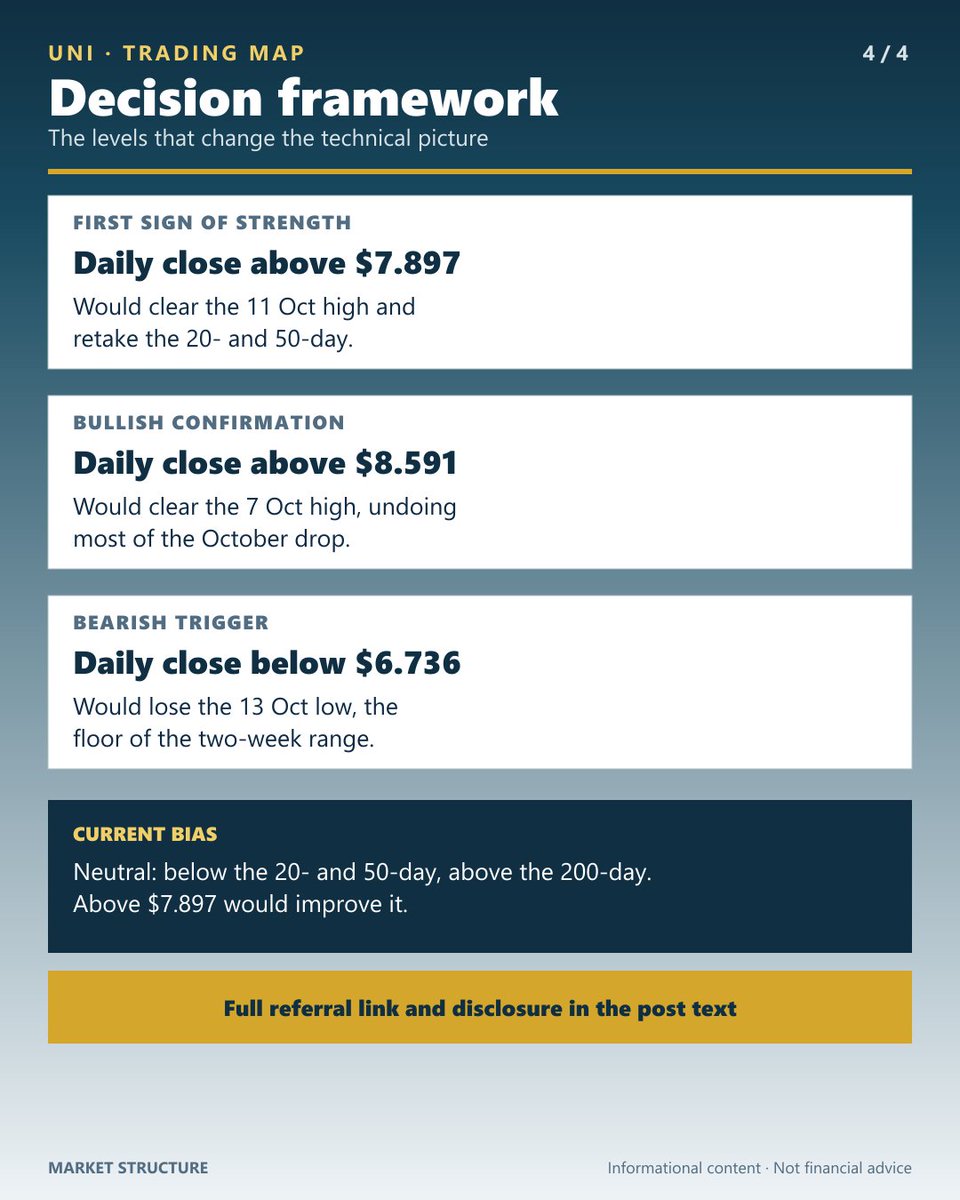
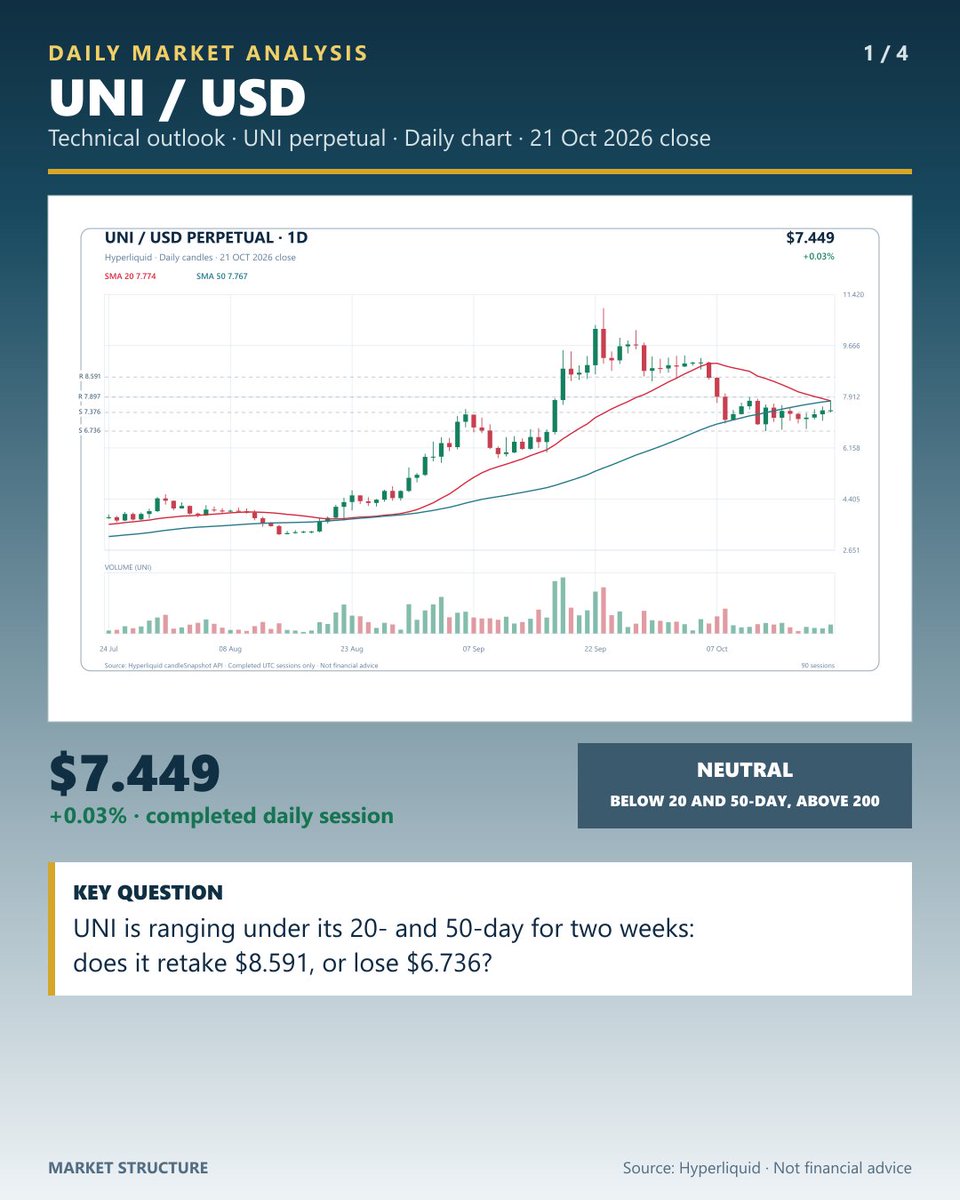
$UNI — NEUTRAL, RANGE-BOUND UNDER ITS 20- AND 50-DAY AFTER THE $7.80 BASE BROKE (WAS NEUTRAL ON 29 SEP)
UNI (Hyperliquid perpetual) closed at $7.449 on Wed 21 Oct 2026, up 0.03% on the session and 62% below its $19.47 high of 8 Dec 2024.
Update on our 29 Sep analysis, when UNI was NEUTRAL at $8.894 with an invalidation level at $7.80: the bullish path never played out, with a highest close of $9.091 against the $9.71 target. Instead UNI fell 7.6% on 7 Oct and 10.0% on 8 Oct to $7.121, below the invalidation, and has since closed between $6.970 and $7.775. It is down 17% over 20 sessions but still up 73% over 60. RSI(14) is 46.7, and price sits below its 20-day ($7.774) and 50-day ($7.767) but well above its 200-day ($4.522). ATR is 8.1% of price, and 21 Oct volume was 1.0x its 20-day average. In the new session price is down about 3.3%, near $7.201, at the low of its range so far.
Bullish scenario: a daily close above $7.897 (the 11 Oct high, above both averages) would retake them; above $8.591 (the 7 Oct high) the October drop would be largely reversed.
Risk scenario: a close below $7.376 (the 21 Oct low) would pressure the range; below $6.736 (the 13 Oct low, the range floor) it would break down, with the 200-day ($4.522) far below.
Levels to watch:
• Resistance: $7.897 / $8.591
• Support: $7.376 / $6.736
• Bearish trigger: close below $6.736
Full technical setup in the attached chart.
Trade perpetuals on Hyperliquid:
https://t.co/BgNRoVAdML
#ad — Referral link. I may receive benefits if you join through it.
Data: Hyperliquid UNI perpetual, completed daily candles through 21 Oct 2026 UTC. Not financial advice.
#UNI #Hyperliquid
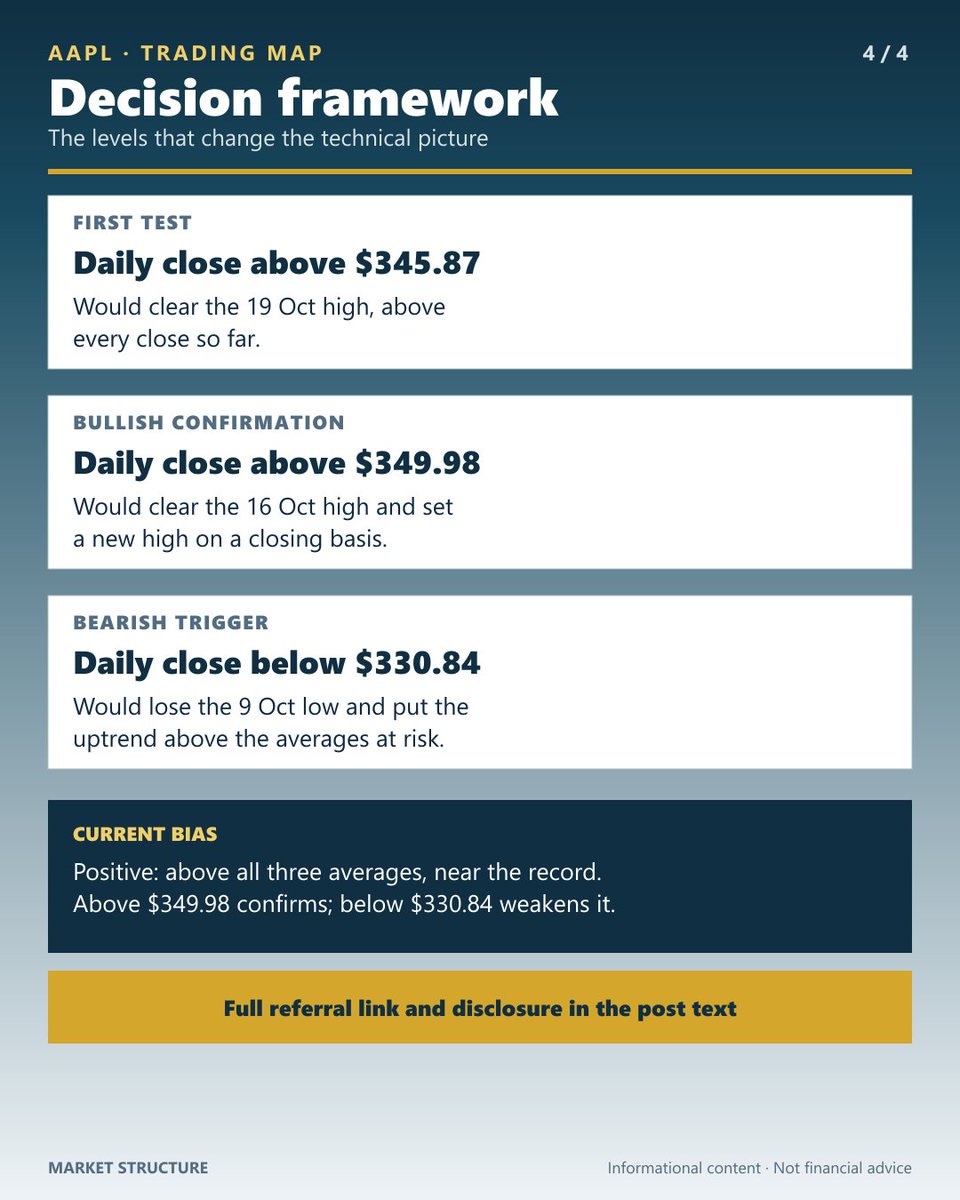
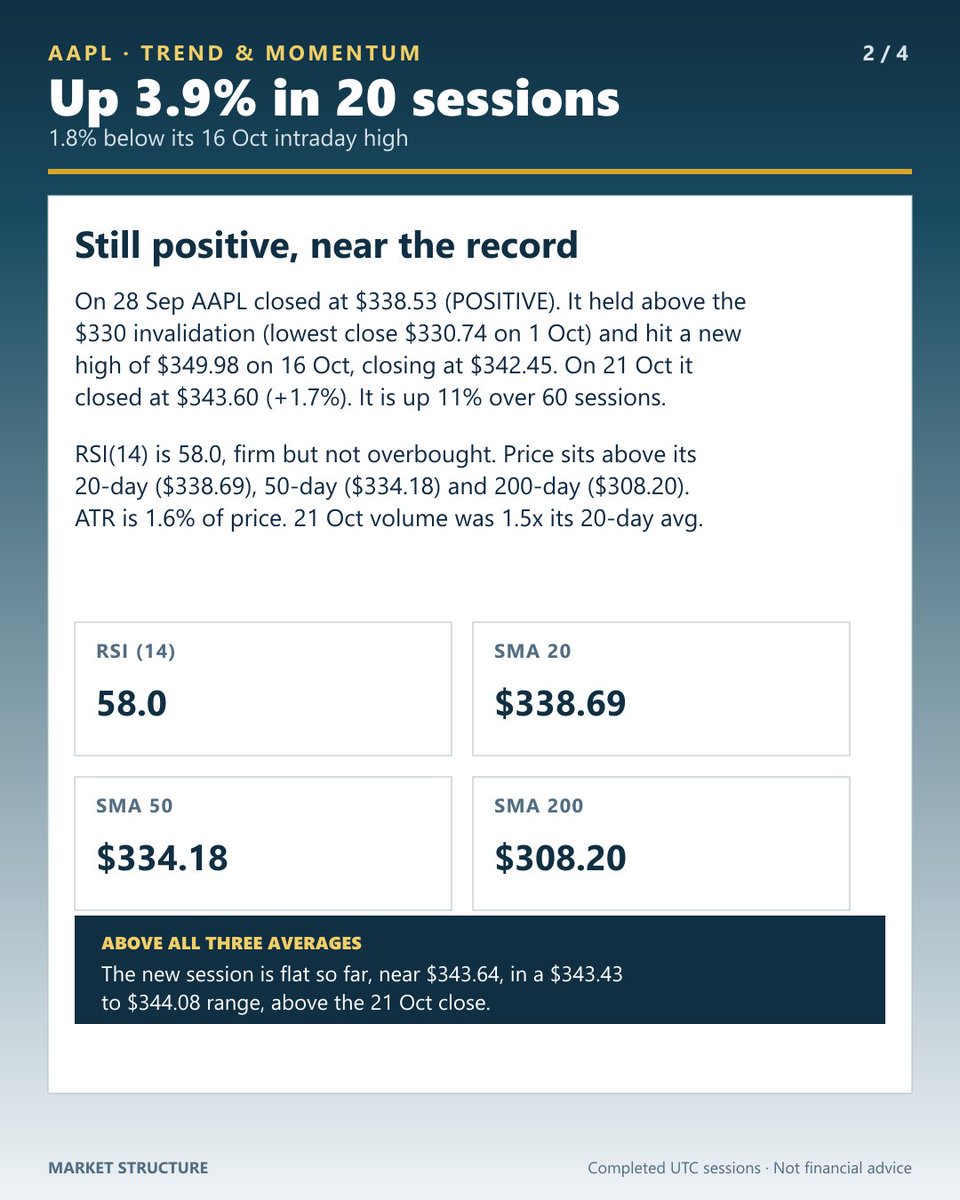
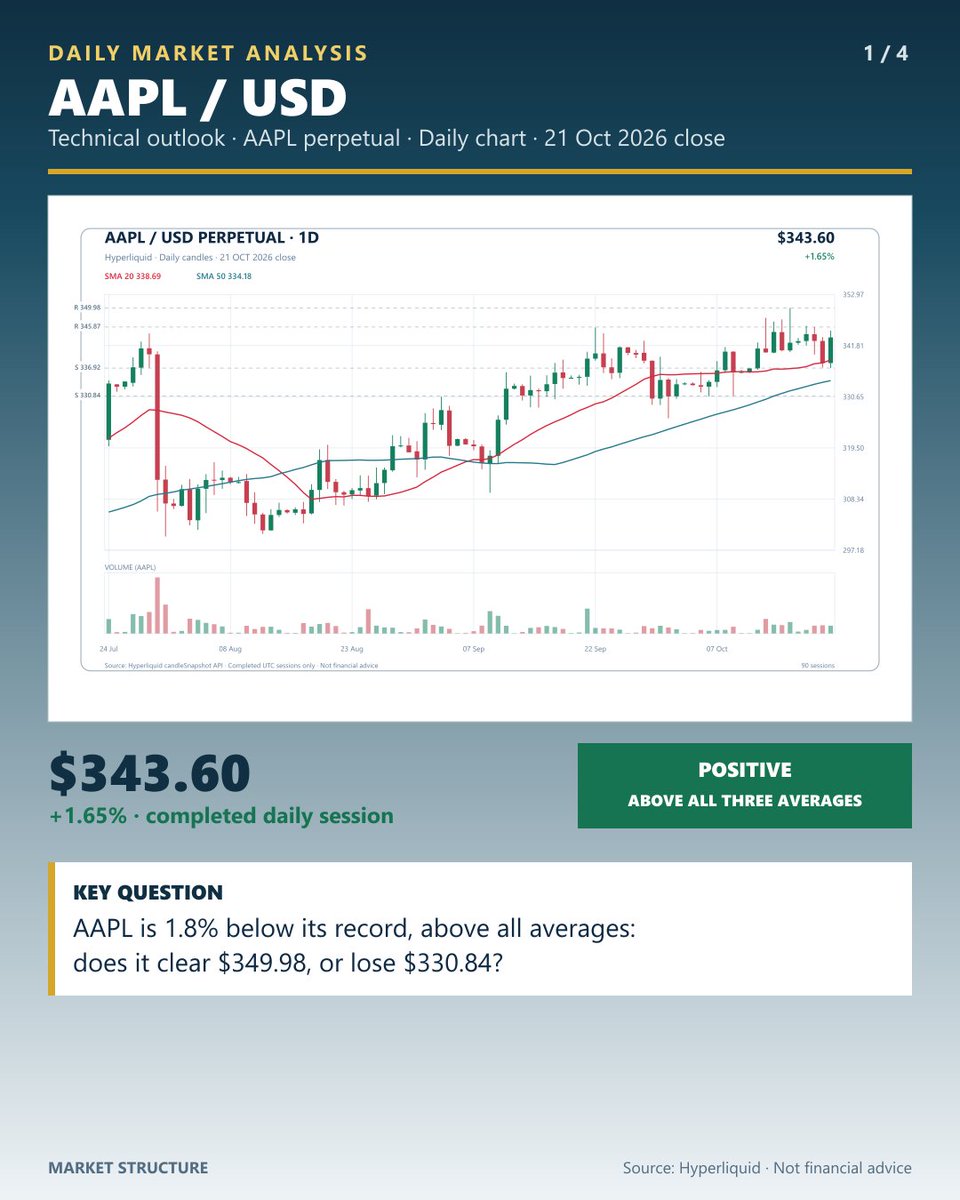
$AAPL — POSITIVE, STILL ABOVE ALL THREE AVERAGES AND 1.8% BELOW ITS RECORD HIGH
AAPL (xyz:AAPL on Hyperliquid) closed at $343.60 on Wed 21 Oct 2026, up 1.65% on the session and 1.8% below its $349.98 high of 16 Oct, a new record.
Update on our 28 Sep analysis (POSITIVE at $338.53, invalidation at $330): the rating holds. AAPL stayed above $330, with a lowest close of $330.74 on 1 Oct, and set a new high of $349.98 on 16 Oct, but that day closed at $342.45 and no daily close has cleared the old $345.75 high yet (highest close: $344.80 on 14 Oct). On 21 Oct it rose 1.7% on 1.5x its 20-day average volume. It is up 3.9% over 20 sessions and 11% over 60. RSI(14) is 58.0, firm but not overbought, and price sits above its 20-day ($338.69), 50-day ($334.18) and 200-day ($308.20). ATR is 1.6% of price. In the new session price is flat so far, near $343.64.
Bullish scenario: a daily close above $345.87 (the 19 Oct high, above every close so far) would clear the first resistance; above $349.98 (the 16 Oct high) AAPL would hold a new high on a closing basis.
Risk scenario: a close below $336.92 (the 21 Oct low) would weaken the advance; below $330.84 (the 9 Oct low, near the old $330 invalidation) the uptrend would be at risk.
Levels to watch:
• Resistance: $345.87 / $349.98
• Support: $336.92 / $330.84
• Bearish trigger: close below $330.84
Full technical setup in the attached chart.
Trade tokenized stock perpetuals on Hyperliquid:
https://t.co/BgNRoVAdML
#ad — Referral link. I may receive benefits if you join through it.
Data: Hyperliquid xyz:AAPL perpetual, completed daily candles through 21 Oct 2026 UTC. This is a synthetic HIP-3 perpetual, not the underlying stock. Not financial advice.
#AAPL #Hyperliquid
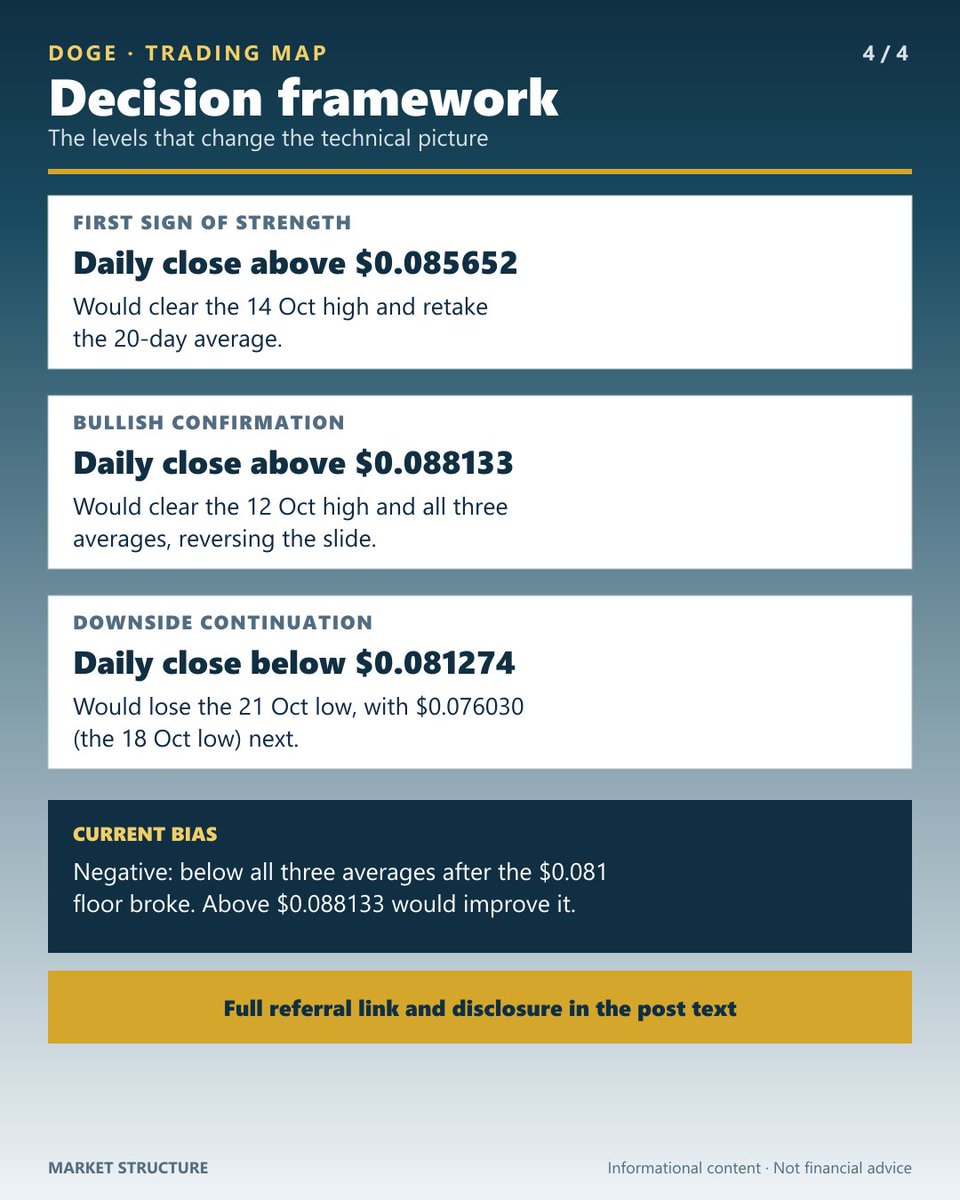
$DOGE — NEGATIVE, BELOW ALL THREE AVERAGES AFTER THE $0.081 FLOOR BROKE (WAS NEUTRAL ON 28 SEP)
DOGE (Hyperliquid perpetual) closed at $0.081921 on Wed 21 Oct 2026, up 0.12% on the session and 83% below its $0.48593 high of 8 Dec 2024.
Update on our 28 Sep analysis, when DOGE was NEUTRAL at $0.0940 above its averages, with an invalidation level at $0.081: price lost the 20-day, closed at $0.080921 on 16 Oct and at $0.079289 on 17 Oct (the lowest close since 19 Aug), so the invalidation was hit. A 3.3% rebound since has taken it back to $0.081921, 14% below its 5 Oct close, on 0.5x its 20-day average volume. It is down 13% over 20 sessions and 11% over 60. RSI(14) is 42.0, and price sits below its 20-day ($0.085714), 50-day ($0.087961) and 200-day ($0.087135). ATR is 5.1% of price. In the new session price is flat so far, near $0.082078.
Bullish scenario: a daily close above $0.085652 (the 14 Oct high, at the 20-day) would retake it; above $0.088133 (the 12 Oct high, above all three averages) the October slide would be reversed.
Risk scenario: a close below $0.081274 (the 21 Oct low) would extend the slide; below $0.076030 (the 18 Oct low, the lowest since 20 Aug) support would break.
Levels to watch:
• Resistance: $0.085652 / $0.088133
• Support: $0.081274 / $0.076030
• Bullish trigger: close above $0.088133
Full technical setup in the attached chart.
Trade perpetuals on Hyperliquid:
https://t.co/BgNRoVAdML
#ad — Referral link. I may receive benefits if you join through it.
Data: Hyperliquid DOGE perpetual, completed daily candles through 21 Oct 2026 UTC. Not financial advice.
#DOGE #Hyperliquid
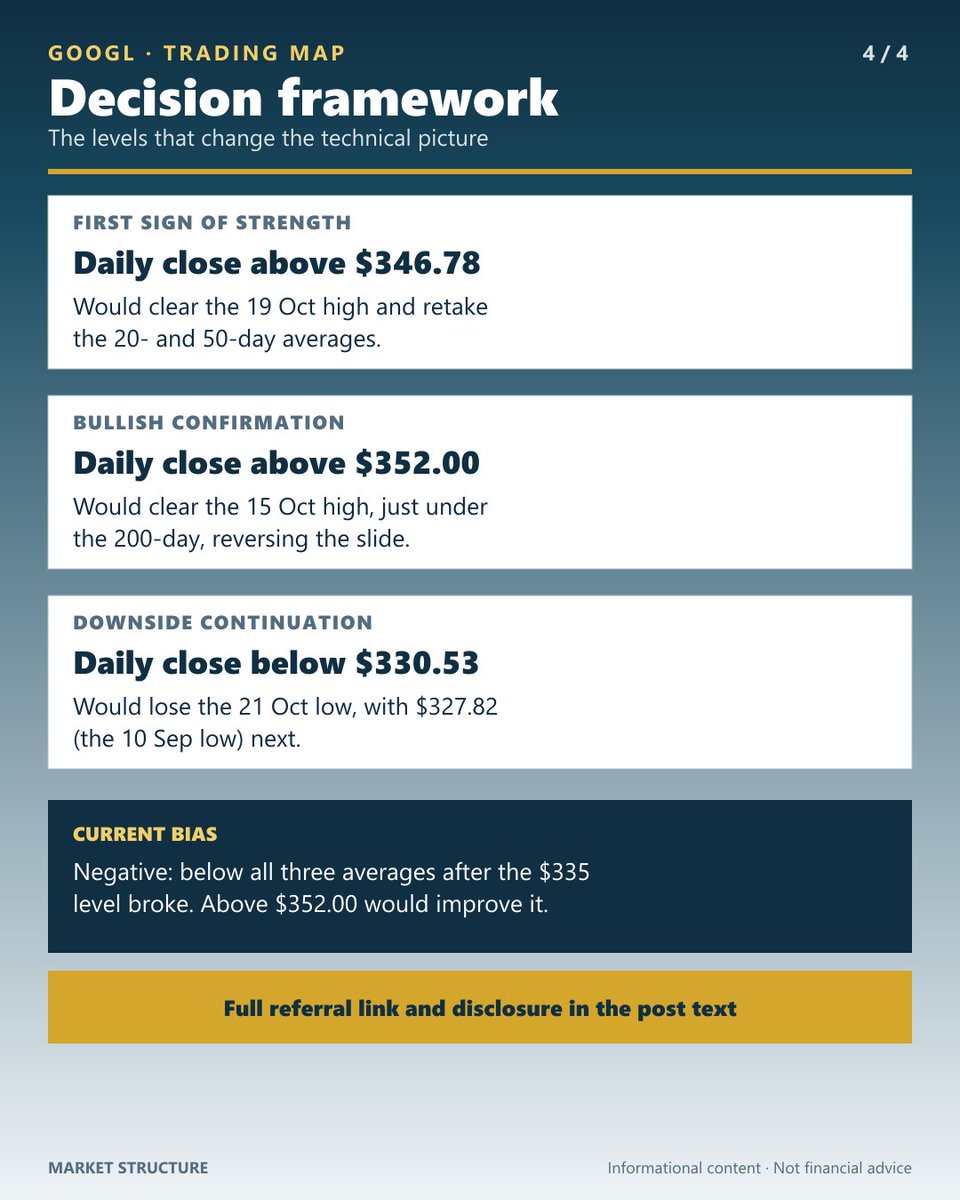
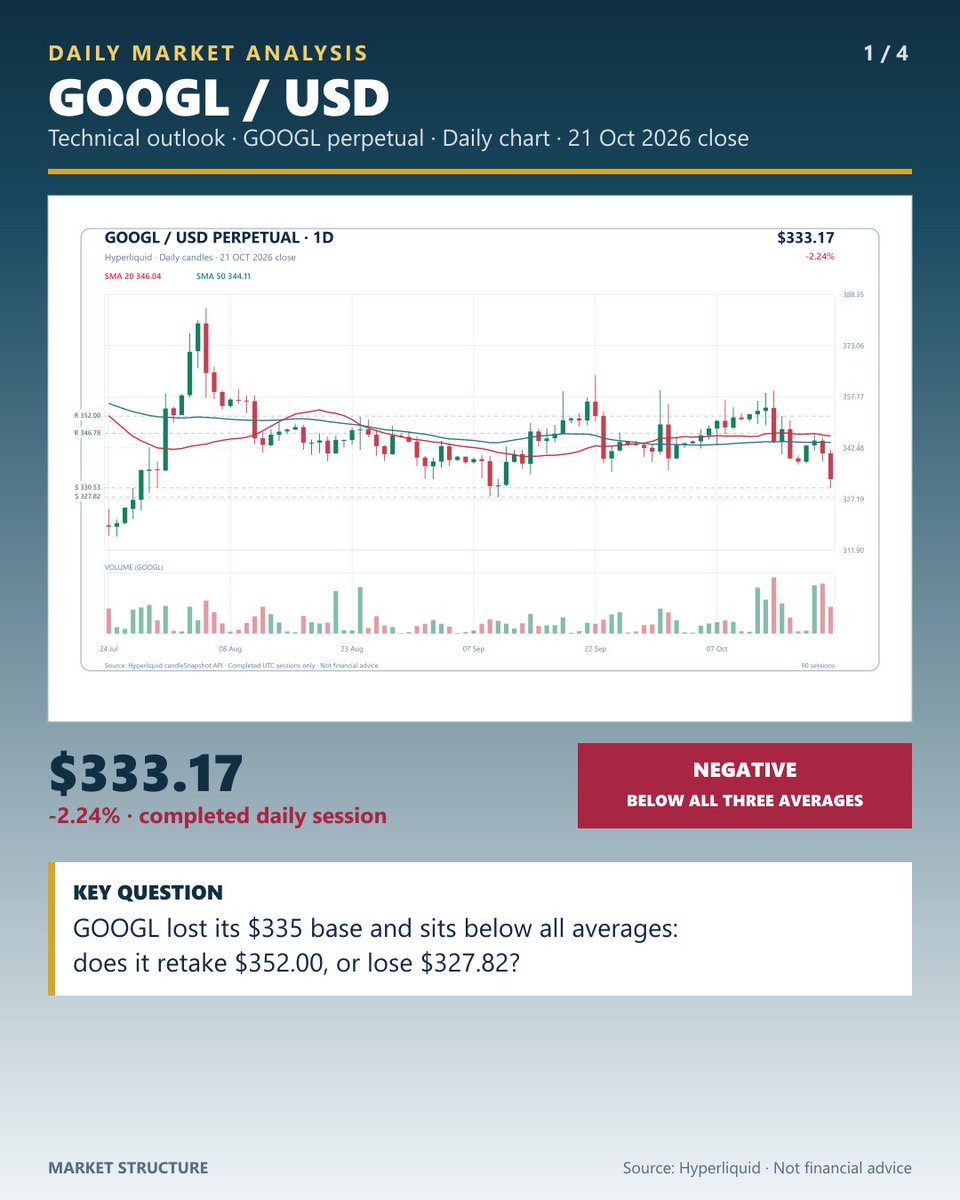
$GOOGL — NEGATIVE, BELOW ALL THREE AVERAGES AFTER THE $335 LEVEL BROKE (WAS NEUTRAL ON 28 SEP)
GOOGL (xyz:GOOGL on Hyperliquid) closed at $333.17 on Wed 21 Oct 2026, down 2.24% on the session and 18.5% below its $408.80 high of 18 May.
Update on our 28 Sep analysis, when GOOGL was NEUTRAL at $342.49 just under its averages: the bullish path partly played out, with closes between $351.05 and $354.53 from 9 to 13 Oct, above the 200-day. It then failed: a drop from $354.53 to $333.17 (-6.0%) on 21 Oct took price under the $335 bearish trigger, on 1.4x its 20-day average volume. It is down 1.8% over 20 sessions and 3.4% over 60. RSI(14) is 37.9, and price sits below its 20-day ($346.04), 50-day ($344.11) and 200-day ($353.96). ATR is 2.3% of price. In the new session price is flat so far, near $333.43.
Bullish scenario: a daily close above $346.78 (the 19 Oct high, above the 20- and 50-day) would retake both; above $352.00 (the 15 Oct high, just under the 200-day) the October slide would be reversed.
Risk scenario: a close below $330.53 (the 21 Oct low) would extend the slide; below $327.82 (the 10 Sep low) the lowest level since early September would break.
Levels to watch:
• Resistance: $346.78 / $352.00
• Support: $330.53 / $327.82
• Bullish trigger: close above $352.00
Full technical setup in the attached chart.
Trade tokenized stock perpetuals on Hyperliquid:
https://t.co/BgNRoVAdML
#ad — Referral link. I may receive benefits if you join through it.
Data: Hyperliquid xyz:GOOGL perpetual, completed daily candles through 21 Oct 2026 UTC. This is a synthetic HIP-3 perpetual, not the underlying stock. Not financial advice.
#GOOGL #Hyperliquid
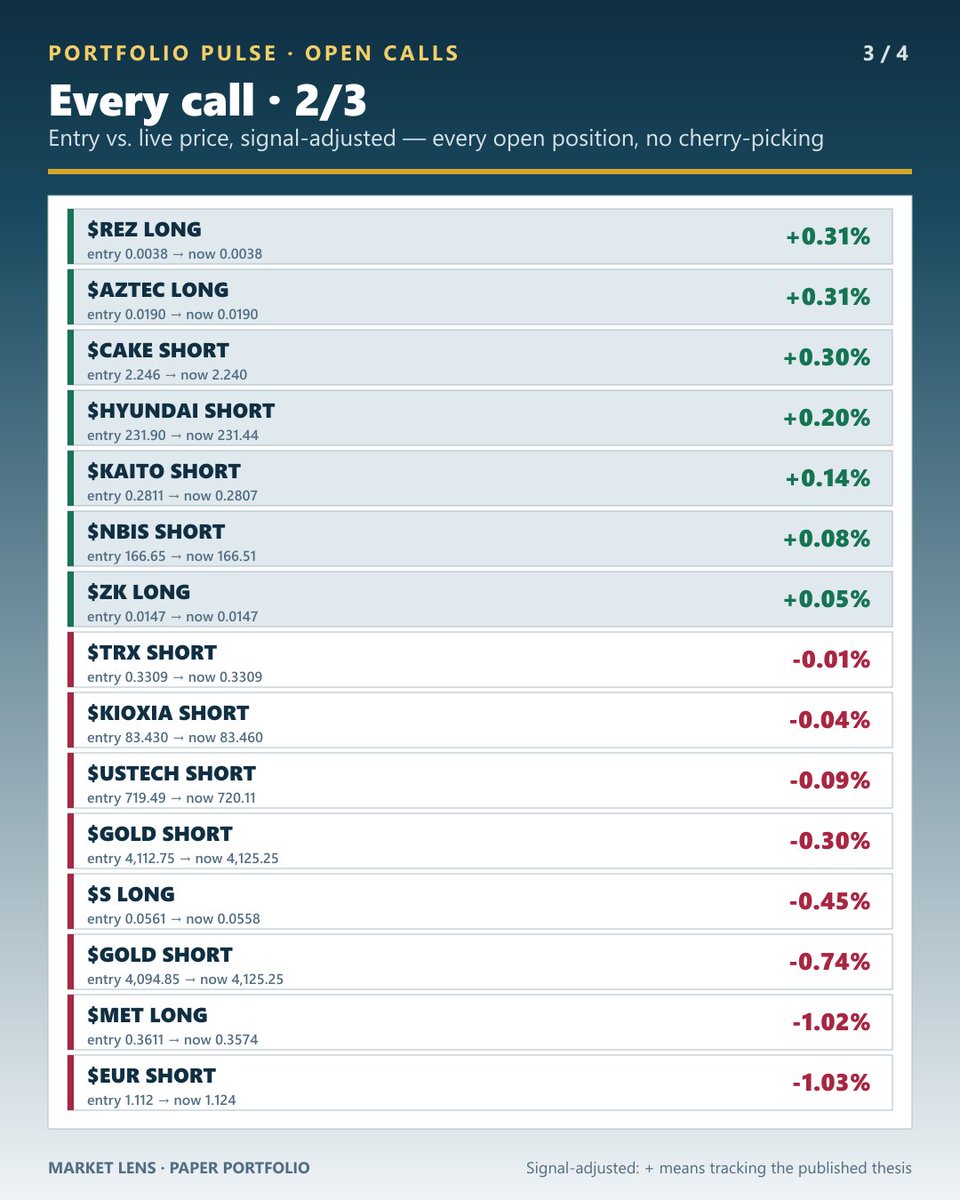
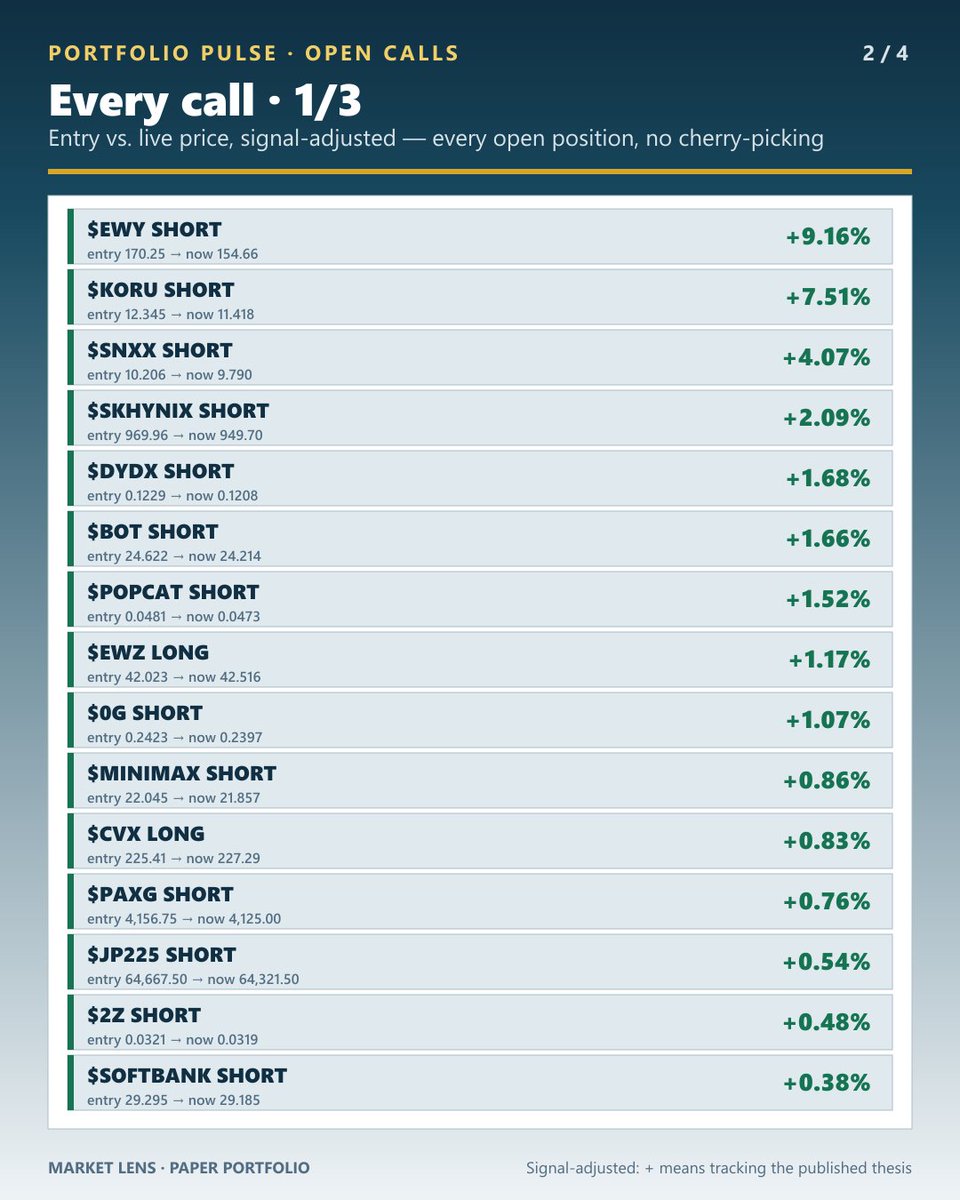
PORTFOLIO PULSE — last ~24h (21 Oct 2026, 23:48 UTC)
BTC: $84,209 (+1.47% over ~24h). Broader tape for context.
Market Lens paper portfolio ($100,000 start, $1,000 per published call): equity $99,422 (-0.58% since inception), 45 open positions, 22/45 currently tracking their thesis.
Unrealized -274 USD · realized -304 USD (93 closed: 33 at their stop, 60 at take-profit) · cash $54,696.
✅ Took profit since the last pulse: $OIL LONG (entry 97.654 → exit 99.68, +2.07%)
✅ Took profit since the last pulse: $PALLADIUM SHORT (entry 1103.65 → exit 1093.1, +0.96%)
✅ Took profit since the last pulse: $IBM LONG (entry 240.905 → exit 242.54, +0.68%)
Best 5:
✅ $EWY SHORT +9.16% (entry 170.25 → 154.66)
✅ $KORU SHORT +7.51% (entry 12.345 → 11.418)
✅ $SNXX SHORT +4.07% (entry 10.206 → 9.790)
✅ $SKHYNIX SHORT +2.08% (entry 969.96 → 949.78)
✅ dydx-chain:native SHORT +1.69% (entry 0.1229 → 0.1208)
Worst 5:
⚠️ ethereum:0x455e53cbb86018ac2b8092fdcd39d8444affc3f6 SHORT -3.33% (entry 0.0916 → 0.0946)
⚠️ $QCOM SHORT -3.88% (entry 169.93 → 176.51)
⚠️ $DASH SHORT -4.66% (entry 49.321 → 51.617)
⚠️ $MNT SHORT -7.10% (entry 0.5204 → 0.5574)
⚠️ $LINK LONG -18.19% (entry 15.287 → 12.505)
All 45 open positions, with entries and stops, are in the images and at https://t.co/9HHH2Sw0Tc
Trade perpetuals on Hyperliquid:
https://t.co/BgNRoVAdML
#ad — Referral link. I may receive benefits if you join through it.
Simulated paper portfolio, for tracking purposes only. Not financial advice.
#Hyperliquid #MarketLens #CryptoTrading
$NBIS — NEGATIVE, BELOW ITS 20- AND 50-DAY AFTER A 34% SLIDE, WITH A 6% BOUNCE ON 3X VOLUME
NBIS (tokenized perpetual, xyz:NBIS on Hyperliquid) closed at $180.57 on Tue 20 Oct 2026, up 6.17% on the session and 40% below its $299.97 high of 22 Jun. The chart has only 134 sessions (since 9 Jun), so there is no 200-day average.
NBIS closed at $250.55 on 6 Oct and fell 34% to $164.68 on 17 Oct, in a thin weekend session with a low of $154.83. It rose 6.2% on 20 Oct to $180.57, 28% below 6 Oct, on 3.1x its 20-day average volume. It is down 24% over 20 sessions and 18% over 60. RSI(14) is 38.1, and price sits below its 20-day ($210.47) and 50-day ($219.78). ATR is 8.9% of price. In the new session price is down about 7.5%, near $166.95, giving back much of that bounce.
Bullish scenario: a daily close above $182.17 (the 20 Oct high) would clear the high of the bounce; above $192.04 (the 16 Oct high) the slide would be partly reversed, with both averages still above.
Risk scenario: a close below $160.46 (the 20 Oct low) would extend the slide; below $154.83 (the 17 Oct low, the October low) support would break, with the 29 Jul low of $141.48 further down.
Levels to watch:
• Resistance: $182.17 / $192.04
• Support: $160.46 / $154.83
• Bullish trigger: close above $192.04
Full technical setup in the attached chart.
Trade tokenized stock perpetuals on Hyperliquid:
https://t.co/BgNRoVAdML
#ad — Referral link. I may receive benefits if you join through it.
Data: Hyperliquid xyz:NBIS perpetual, completed daily candles through 20 Oct 2026 UTC. This is a synthetic HIP-3 perpetual, not the underlying stock. Not financial advice.
#NBIS #Hyperliquid
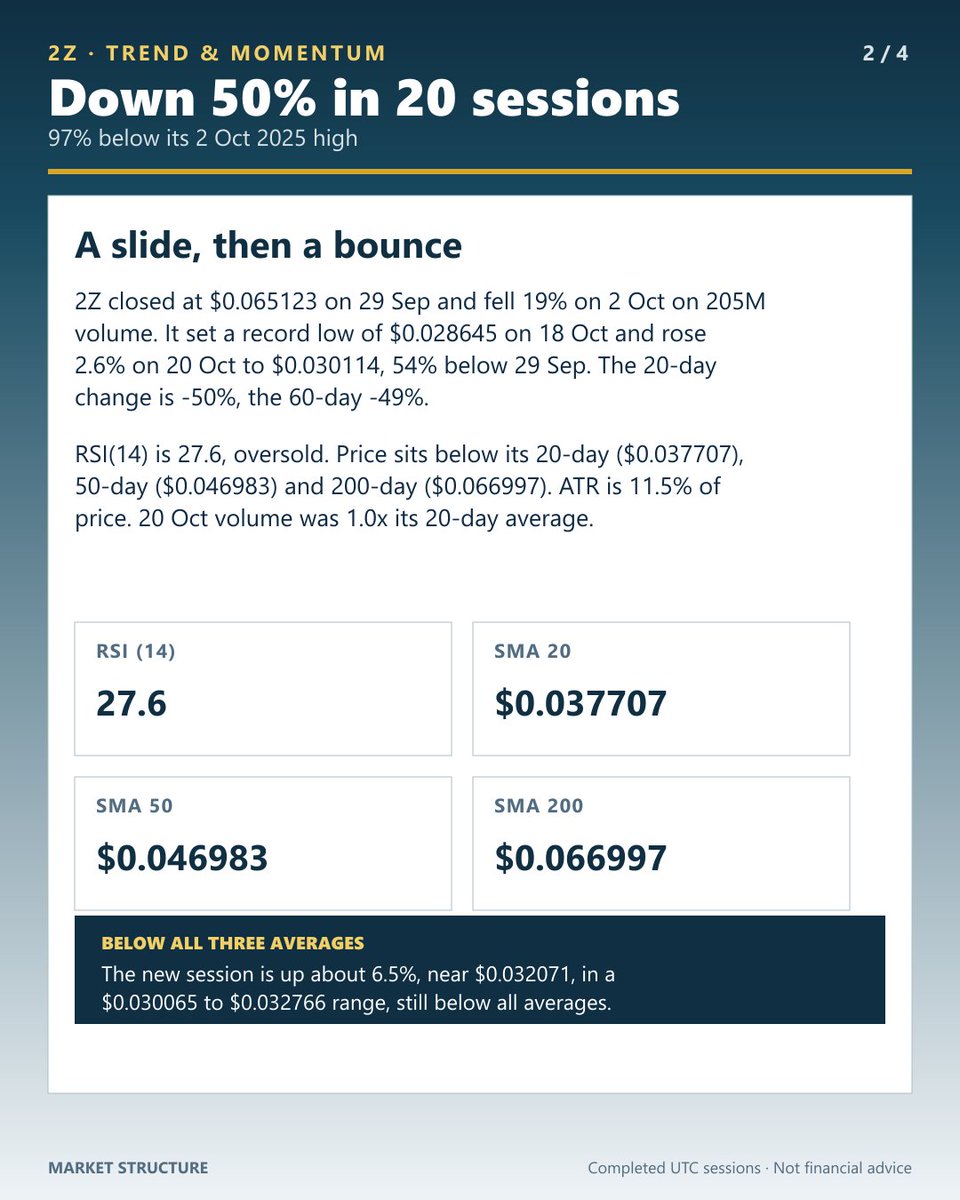
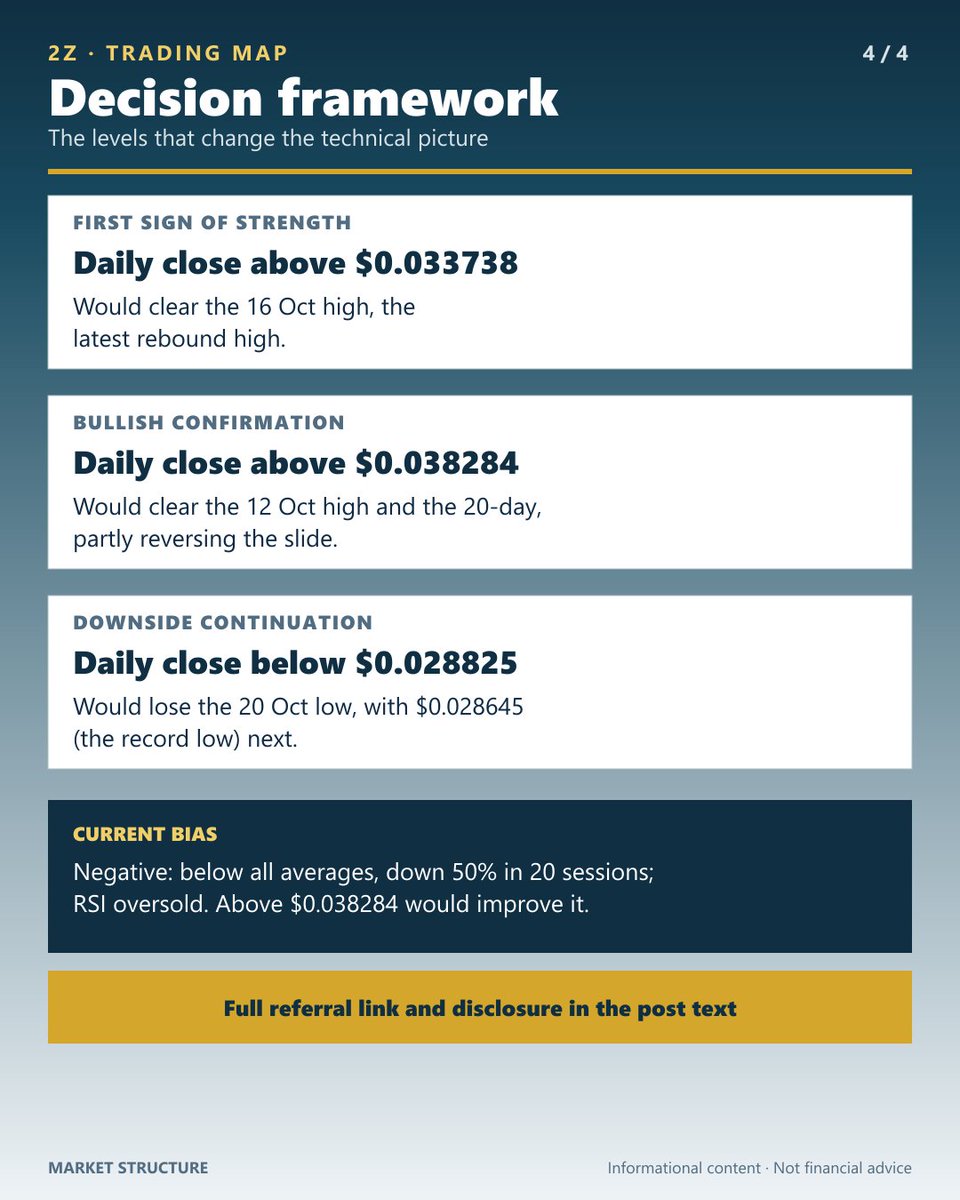
$2Z — NEGATIVE, BELOW ALL THREE AVERAGES AND OVERSOLD AFTER A 50% SLIDE IN 20 SESSIONS
2Z (Hyperliquid perpetual) closed at $0.030114 on Tue 20 Oct 2026, up 2.60% on the session and 97% below its $0.88482 high of 2 Oct 2025. It set a record low of $0.028645 on 18 Oct.
2Z closed at $0.065123 on 29 Sep, fell 19% on 2 Oct on 205M units of volume and closed at $0.030114 on 20 Oct, 54% below 29 Sep, on 1.0x its 20-day average volume. It is down 50% over 20 sessions and 49% over 60. RSI(14) is 27.6, which is oversold, so a sharp rebound is possible. Price sits below its 20-day ($0.037707), 50-day ($0.046983) and 200-day ($0.066997). ATR is 11.5% of price. In the new session price is up about 6.5%, near $0.032071, still below all three averages.
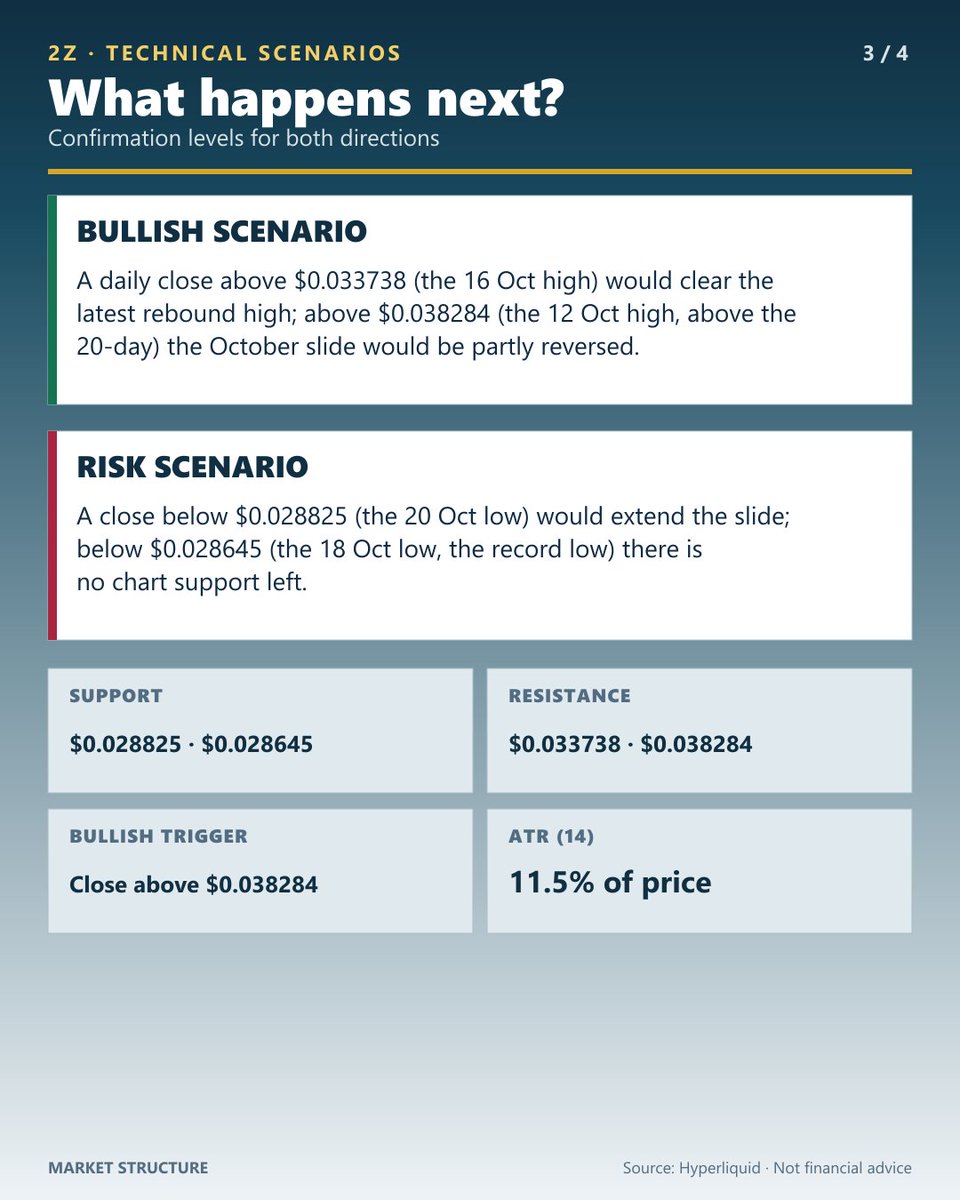
Bullish scenario: a daily close above $0.033738 (the 16 Oct high) would clear the latest rebound high; above $0.038284 (the 12 Oct high, above the 20-day) the October slide would be partly reversed.
Risk scenario: a close below $0.028825 (the 20 Oct low) would extend the slide; below $0.028645 (the 18 Oct low, the record low) there is no chart support left.
Levels to watch:
• Resistance: $0.033738 / $0.038284
• Support: $0.028825 / $0.028645
• Bullish trigger: close above $0.038284
Full technical setup in the attached chart.
Trade perpetuals on Hyperliquid:
https://t.co/BgNRoVALCj
#ad — Referral link. I may receive benefits if you join through it.
Data: Hyperliquid 2Z perpetual, completed daily candles through 20 Oct 2026 UTC. Not financial advice.
#2Z #Hyperliquid
zero-gravity:native — NEGATIVE, BELOW ALL THREE AVERAGES AFTER A 24% SLIDE IN 20 SESSIONS
0G (Hyperliquid perpetual) closed at $0.23575 on Tue 20 Oct 2026, up 3.49% on the session and 97% below its $7.0744 high of 23 Sep 2025.
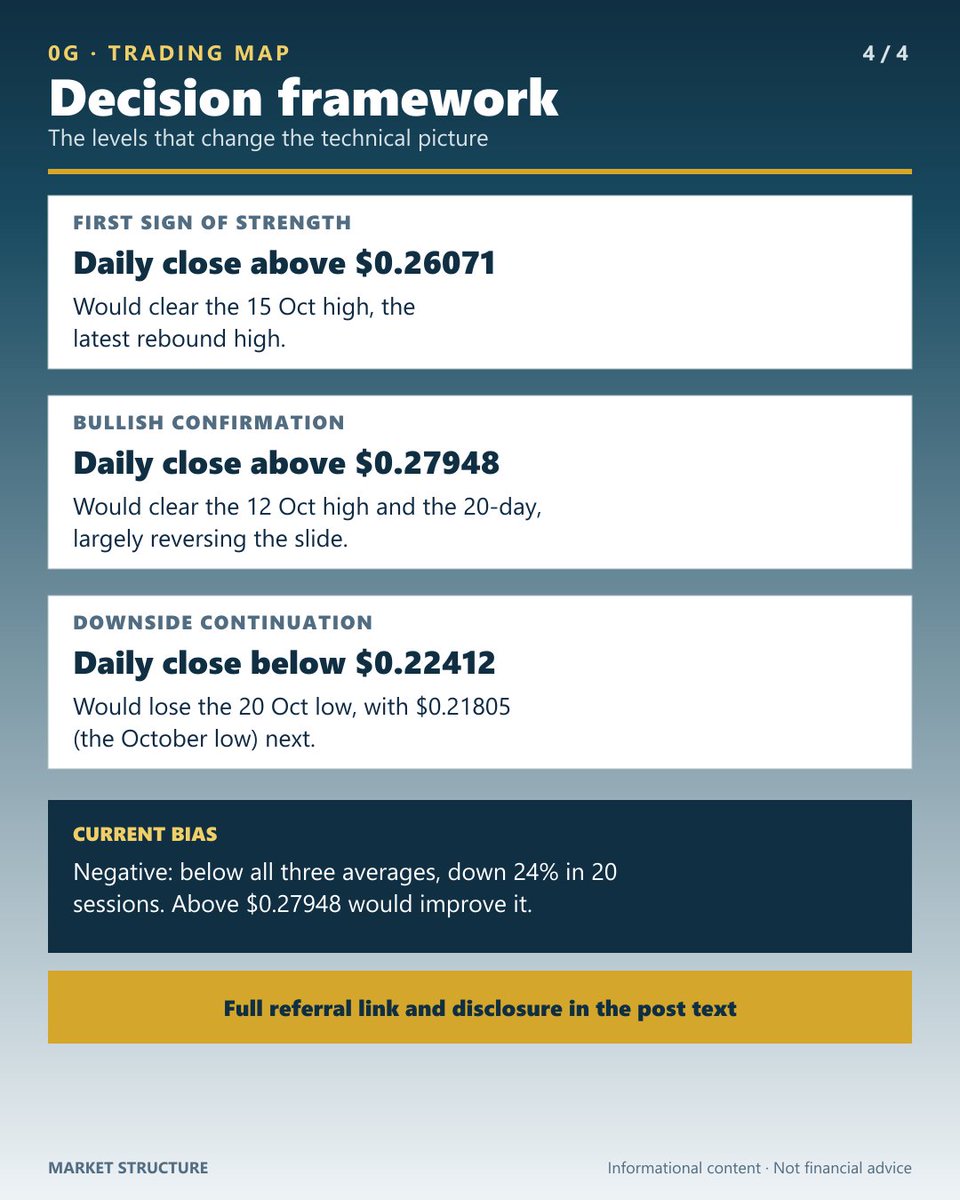
0G closed at $0.32086 on 6 Oct and slid 30% to $0.22591 on 18 Oct (low $0.21805), then rose 3.5% on 20 Oct, 26.5% below 6 Oct, on 0.3x its 20-day average volume. It is down 24% over 20 sessions and up 36% over 60, helped by a 37% one-day jump on 31 Aug. RSI(14) is 43.1, and price sits below its 20-day ($0.27048), 50-day ($0.24170) and 200-day ($0.30978). ATR is 9.2% of price. In the new session price is up about 2.7%, near $0.24220, level with the 50-day.
Bullish scenario: a daily close above $0.26071 (the 15 Oct high) would clear the latest rebound high; above $0.27948 (the 12 Oct high, above the 20-day) the October slide would be largely reversed.
Risk scenario: a close below $0.22412 (the 20 Oct low) would extend the slide; below $0.21805 (the 18 Oct low, the October low) support would break.
Levels to watch:
• Resistance: $0.26071 / $0.27948
• Support: $0.22412 / $0.21805
• Bullish trigger: close above $0.27948
Full technical setup in the attached chart.
Trade perpetuals on Hyperliquid:
https://t.co/BgNRoVAdML
#ad — Referral link. I may receive benefits if you join through it.
Data: Hyperliquid 0G perpetual, completed daily candles through 20 Oct 2026 UTC. Not financial advice.
#0G #Hyperliquid
$NOW — POSITIVE, ABOVE ITS 20- AND 50-DAY AT ITS HIGHEST CLOSE YET
NOW (tokenized perpetual, xyz:NOW on Hyperliquid) closed at $148.72 on Tue 20 Oct 2026, up 2.48% on the session, its highest close on the chart and 3.6% below its $154.30 intraday high of 16 Oct. That day it closed at $141.23, leaving a long upper wick. The chart has only 139 sessions (since 4 Jun), so there is no 200-day average.
NOW closed at $133.99 on 30 Sep and has risen 11% over 20 sessions and 16% over 60, on 1.2x its 20-day average volume on 20 Oct. RSI(14) is 64.6, firm but below 70, and price sits above its 20-day ($140.03) and 50-day ($138.25). ATR is 3.5% of price. In the new session price is up about 3.8%, near $154.37, with an intraday high of $155.31 above the 16 Oct high.
Bullish scenario: a daily close above $149.97 (the 20 Oct high) would extend the advance; above $154.30 (the 16 Oct high, the wick top) NOW would hold a new high on a closing basis.
Risk scenario: a close below $144.98 (the 20 Oct low) would weaken the advance; below $139.92 (the 19 Oct low, at the 20-day) the October rally would be undone.
Levels to watch:
• Resistance: $149.97 / $154.30
• Support: $144.98 / $139.92
• Bearish trigger: close below $139.92
Full technical setup in the attached chart.
Trade tokenized stock perpetuals on Hyperliquid:
https://t.co/BgNRoVAdML
#ad — Referral link. I may receive benefits if you join through it.
Data: Hyperliquid xyz:NOW perpetual, completed daily candles through 20 Oct 2026 UTC. This is a synthetic HIP-3 perpetual, not the underlying stock. Not financial advice.
#NOW #Hyperliquid
$BOT — NEGATIVE, BELOW ITS 20- AND 50-DAY AT A RECORD LOW AFTER A 31% SLIDE
BOT (tokenized perpetual, xyz:BOT on Hyperliquid) closed at $22.587 on Tue 20 Oct 2026, down 1.41% on the session and 48% below its $43.739 high of 1 Jul. It set an intraday low of $21.265 that day, the lowest on its 117-session chart, then closed 6.2% above it. With only 117 sessions there is no 200-day average.
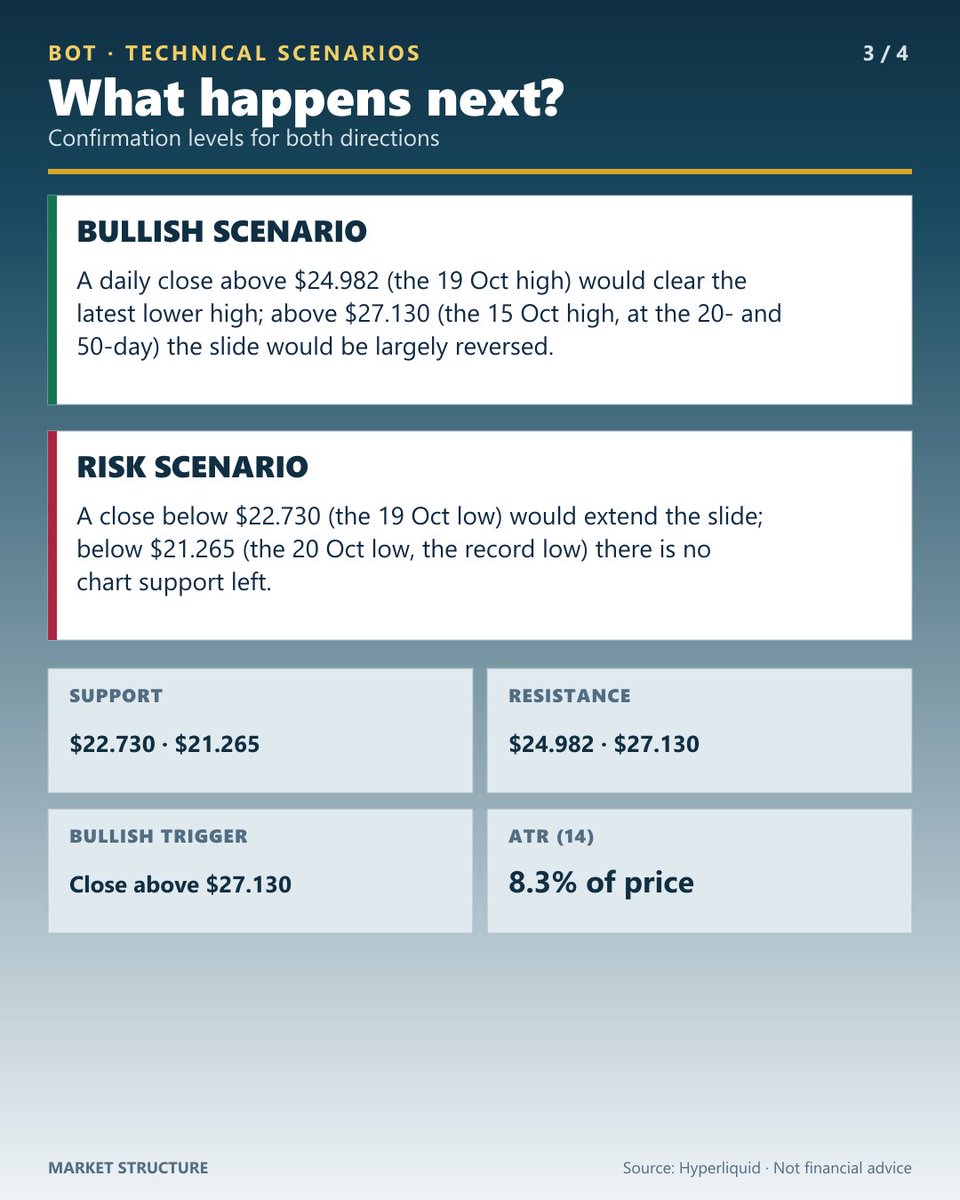
BOT closed at $32.559 on 5 Oct and slid 30.6% to $22.587 on 20 Oct, its lowest close on the chart, on 2.8x its 20-day average volume. It is down 15% over 20 sessions and 20% over 60. RSI(14) is 31.5, weak but not below 30, and price sits below its 20-day ($27.232) and 50-day ($27.441). ATR is 8.3% of price. In the new session price is up about 9.2%, near $24.659, still below both averages.
Bullish scenario: a daily close above $24.982 (the 19 Oct high) would clear the latest lower high; above $27.130 (the 15 Oct high, at the 20- and 50-day) the slide would be largely reversed.
Risk scenario: a close below $22.730 (the 19 Oct low) would extend the slide; below $21.265 (the 20 Oct low, the record low) there is no chart support left.
Levels to watch:
• Resistance: $24.982 / $27.130
• Support: $22.730 / $21.265
• Bullish trigger: close above $27.130
Full technical setup in the attached chart.
Trade tokenized stock perpetuals on Hyperliquid:
https://t.co/BgNRoVAdML
#ad — Referral link. I may receive benefits if you join through it.
Data: Hyperliquid xyz:BOT perpetual, completed daily candles through 20 Oct 2026 UTC. This is a synthetic HIP-3 perpetual, not the underlying stock. Not financial advice.
#BOT #Hyperliquid
$TOTAL2 — NEUTRAL, BELOW ITS 20- AND 50-DAY BUT ABOVE ITS 200-DAY AFTER A 9.5% SLIDE
TOTAL2 (index perpetual, para:TOTAL2 on Hyperliquid) closed at 1086.8 on Tue 20 Oct 2026, up 1.61% on the session and 8.6% below its 1189.4 high of 23 Sep. It is a thin market, with about $0.9M of open interest.
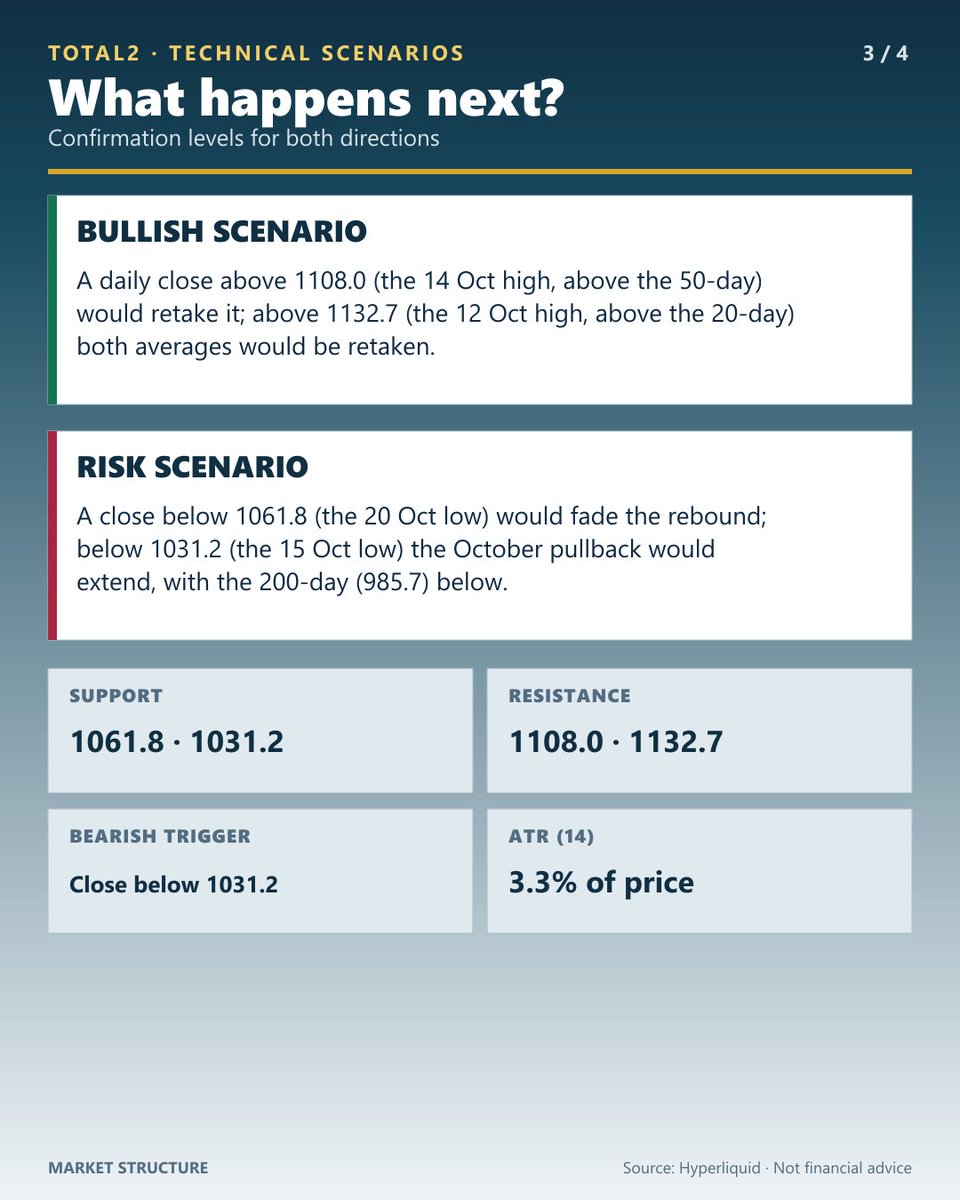
TOTAL2 closed at 1170.5 on 5 Oct, fell 9.5% to 1058.8 on 17 Oct (low of 1021.4 on 18 Oct) and closed at 1086.8 on 20 Oct, 7.2% below 5 Oct, on 0.3x its 20-day average volume. It is down 6.5% over 20 sessions and up 3.7% over 60. RSI(14) is 45.1, and price sits below its 20-day (1112.7) and 50-day (1106.3) but above its 200-day (985.7). ATR is 3.3% of price. In the new session price is up about 1.4%, near 1101.8, just under both averages.
Bullish scenario: a daily close above 1108.0 (the 14 Oct high, above the 50-day) would retake it; above 1132.7 (the 12 Oct high, above the 20-day) both averages would be retaken.
Risk scenario: a close below 1061.8 (the 20 Oct low) would fade the rebound; below 1031.2 (the 15 Oct low) the October pullback would extend, with the 200-day (985.7) below.
Levels to watch:
• Resistance: 1108.0 / 1132.7
• Support: 1061.8 / 1031.2
• Bearish trigger: close below 1031.2
Full technical setup in the attached chart.
Trade perpetuals on Hyperliquid:
https://t.co/BgNRoVAdML
#ad — Referral link. I may receive benefits if you join through it.
Data: Hyperliquid para:TOTAL2 perpetual, completed daily candles through 20 Oct 2026 UTC. This is a synthetic HIP-3 perpetual, not the underlying index. Not financial advice.
#TOTAL2 #Hyperliquid
$10Y — NEUTRAL, BELOW ITS 20-DAY BUT ABOVE ITS 50-DAY AFTER A 4.6% PULLBACK
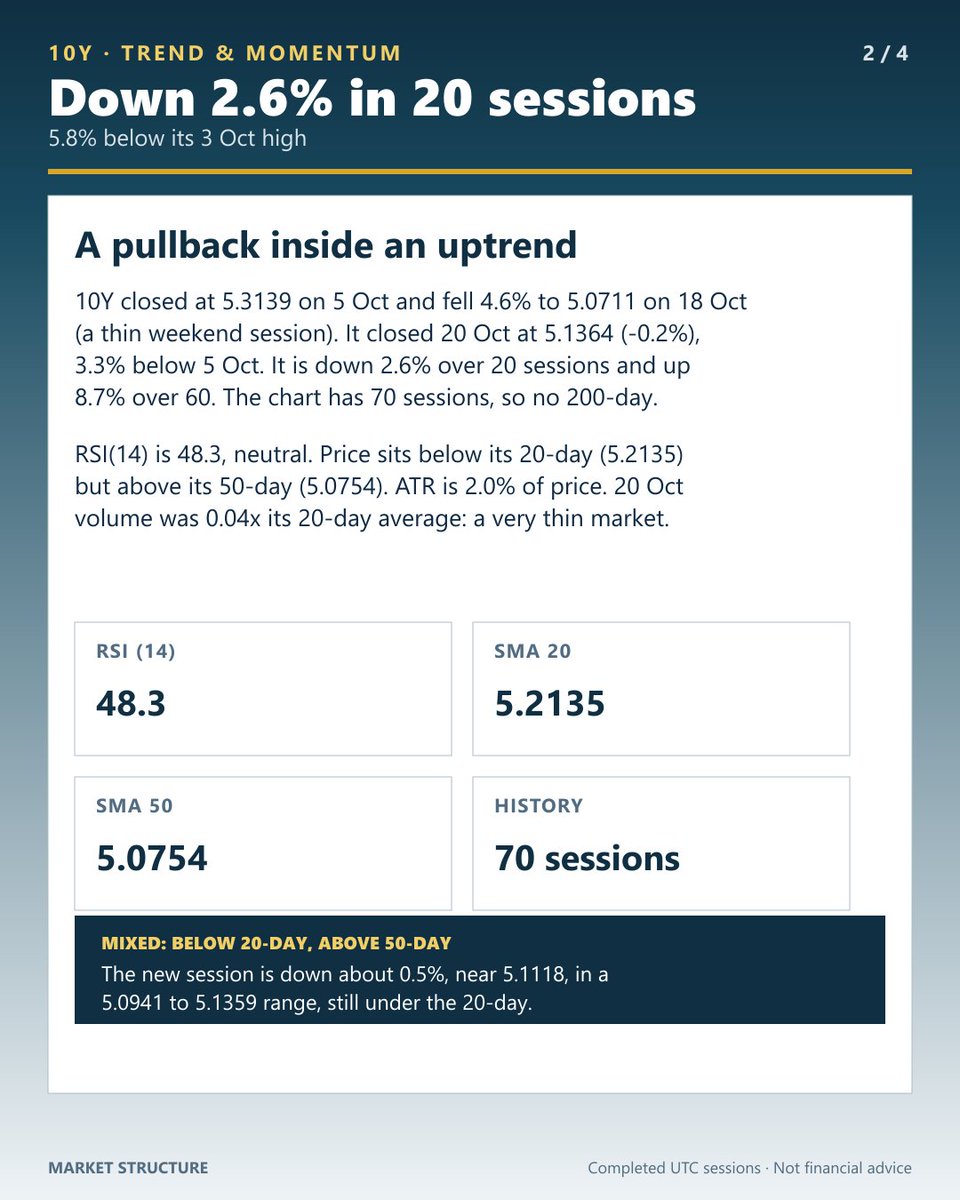
10Y (index perpetual, para:10Y on Hyperliquid) closed at 5.1364 on Tue 20 Oct 2026, down 0.19% on the session and 5.8% below its 5.4537 high of 3 Oct, the highest on this chart. The chart has only 70 sessions (since 12 Aug), so there is no 200-day average. It is a thin market, with about $2.2M of open interest.
10Y closed at 5.3139 on 5 Oct, fell 4.6% to 5.0711 on 18 Oct in a thin weekend session and closed at 5.1364 on 20 Oct, 3.3% below 5 Oct, on 0.04x its 20-day average volume. It is down 2.6% over 20 sessions and up 8.7% over 60. RSI(14) is 48.3, and price sits below its 20-day (5.2135) but above its 50-day (5.0754). ATR is 2.0% of price. In the new session price is down about 0.5%, near 5.1118.
Bullish scenario: a daily close above 5.2400 (the 15 Oct high, above the 20-day) would retake it; above 5.3293 (the 14 Oct high) the October pullback would be largely reversed.
Risk scenario: a close below 5.0846 (the 20 Oct low, at the 50-day) would weaken the rebound; below 5.0253 (the 16 Oct low, the October low) the pullback would extend.
Levels to watch:
• Resistance: 5.2400 / 5.3293
• Support: 5.0846 / 5.0253
• Bearish trigger: close below 5.0253
Full technical setup in the attached chart.
Trade perpetuals on Hyperliquid:
https://t.co/BgNRoVALCj
#ad — Referral link. I may receive benefits if you join through it.
Data: Hyperliquid para:10Y perpetual, completed daily candles through 20 Oct 2026 UTC. This is a synthetic HIP-3 perpetual, not the underlying index. Not financial advice.
#10Y #Hyperliquid
$EWJ — NEUTRAL, BELOW ITS 20- AND 50-DAY BUT ABOVE ITS 200-DAY AFTER A 5% PULLBACK
EWJ (tokenized perpetual, xyz:EWJ on Hyperliquid) closed at $95.75 on Tue 20 Oct 2026, up 0.62% on the session and 4% below its $100.21 high of 8 Sep.
EWJ closed at $99.43 on 6 Oct, its highest close in 60 sessions, fell 5.1% to $94.37 on 17 Oct in a thin weekend session (low $92.29) and closed at $95.75 on 20 Oct, 3.7% below 6 Oct, on 1.6x its 20-day average volume. It is down 2.1% over 20 sessions and up 0.5% over 60. RSI(14) is 44.4, and price sits below its 20-day ($97.07) and 50-day ($97.31) but above its 200-day ($93.55). ATR is 1.6% of price. In the new session price is up about 0.2%, near $95.95.
Bullish scenario: a daily close above $96.32 (the 16 Oct high) would clear the latest rebound high; above $97.74 (the 13 Oct high, above the 20- and 50-day) both averages would be retaken.
Risk scenario: a close below $94.11 (the 20 Oct low) would fade the rebound; below $93.14 (the 19 Oct low, under the 200-day at $93.55) the long-term average would be lost.
Levels to watch:
• Resistance: $96.32 / $97.74
• Support: $94.11 / $93.14
• Bearish trigger: close below $93.14
Full technical setup in the attached chart.
Trade perpetuals on Hyperliquid:
https://t.co/BgNRoVAdML
#ad — Referral link. I may receive benefits if you join through it.
Data: Hyperliquid xyz:EWJ perpetual, completed daily candles through 20 Oct 2026 UTC. This is a synthetic HIP-3 perpetual, not the underlying fund. Not financial advice.
#EWJ #Hyperliquid