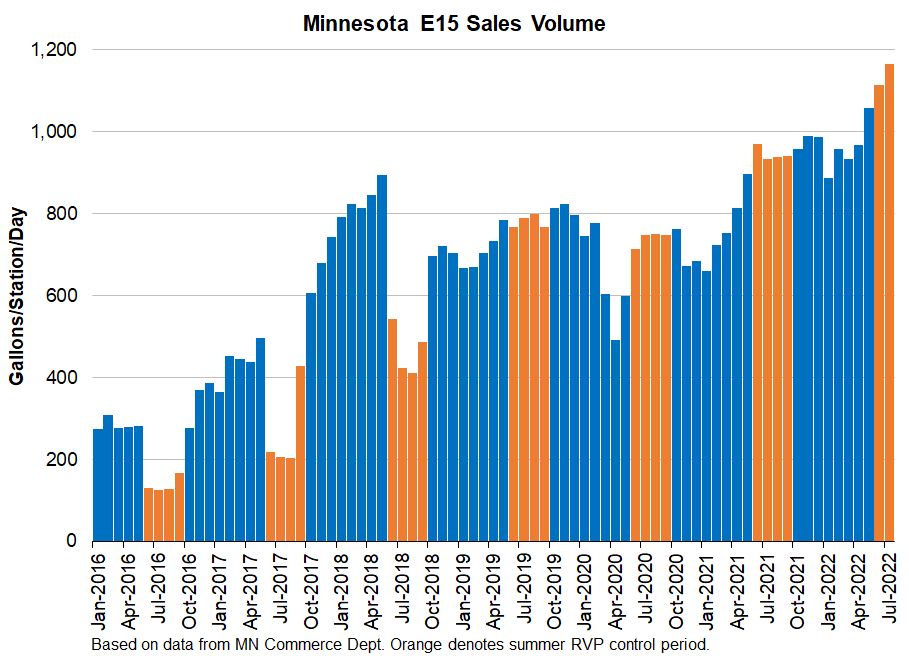
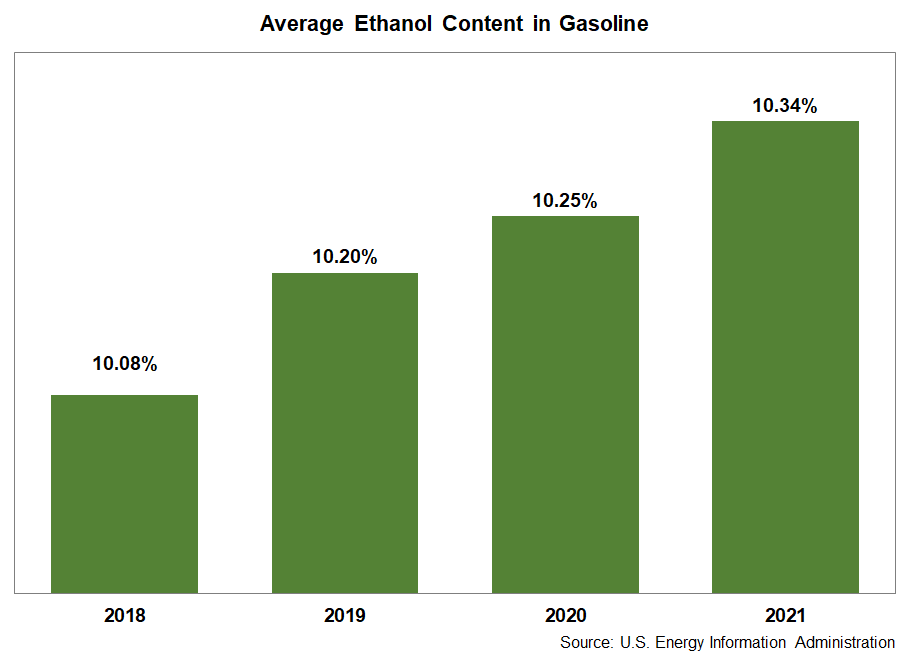
@RinnyTheGopher@ScottIrwinUI Blend rate is higher in Midwest & increase has been pronounced the last couple years, but EIA supply adjustment is included in usage calc & might be more noisy at PADD level. Assume PADD5 rate is lower since no E15 in CA but hopefully that's around the corner (growing E85 there).
Great, straightforward explanation by @EthanolRFA CEO about carbon emissions from #ethanol. People who don't need to get into the weeds of lifecycle GHG analysis would benefit from a 5-minute read.
Zero-carbon corn #ethanol isn’t an idealistic aspiration or a far-fetched concept; however, reaching net-zero will require fairness and integrity in lifecycle analysis and honesty in discussions—and reporting—about the carbon impacts of different fuels.
https://t.co/yG8ZmCjKMv
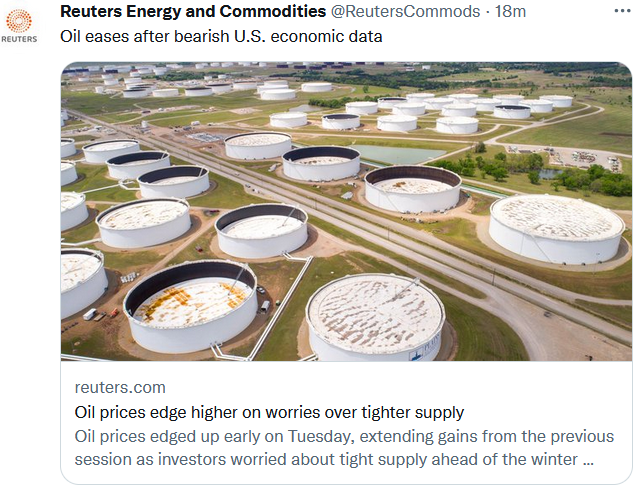
The discrepancy between the tweet and the news headline sums up the tug of war in the market in recent weeks. Only thing missing is a reference to China lockdowns.
#ethanol exports >100 mil gal for 10 straight months for the first time. Rebounded to 107 mil gal in July. Canada >40 mil gal again. EU and some price-responsive markets still among leading destinations.
The U.S. exported 101.5 mil. gal. of #ethanol in June. Shipments for the first half of 2022 were 825.7 mg, the highest level since 2018. June exports of #DDGS strengthened 5% to 1.01 MMT. https://t.co/0BHp68ryb5
Yesterday on @MeetThePress, @chucktodd explained how refiners are contributing to higher gas prices. Refiners have been reaping record margins while drivers have been paying record prices at the pump.
https://t.co/6YFzJlQtON
@Sayitisso1 Exports to EU + UK have been solid over the last 7 months. EU used to be one of our top destinations but imposed antidumping duties in 2013 that weren't fully resolved until 2019. EU & UK policies toward ethanol are mixed (UK E10 is helpful), but fuel prices there are high.
Good news on #ethanol exports. April exports of 185 mil gal are most since Mar. 2018. Canada was top destination at 40 mg (largest since Apr. 2014). Brazil jumps to 2nd at 30 mg (most since Mar. 2020) after suspension of tariff. 19 mg to Singapore appears to be a record.
@RinnyTheGopher I'll quickly point out that the RIN bank in 2019 was inflated by SREs and that EPA did exactly what it said it would on pending SRE petitions (all of which you know), but I'll stop there so as not to kill the buzz. Enjoy the drinks and weekend.
CRUDE vs REFINED OIL PRODUCTS: There's quite a difference when you compare current prices vs highest point achieved during the last oil boom in 2008:
🛢️WTI crude oil:⬇️25%
🚗RBOB gasoline:⬆️3%
🚚ULSD diesel:⬆️24%
✈️NY harbor jet-fuel:⬆️33%
#OOTT#OilInflation
@FuelingUSJobs Fact Check: Since E15 was allowed to be sold year-round starting in 2019, the percentage of ethanol blended into gasoline DID increase significantly. E15 volumes increased 62% last year and were roughly double the 2019 level.
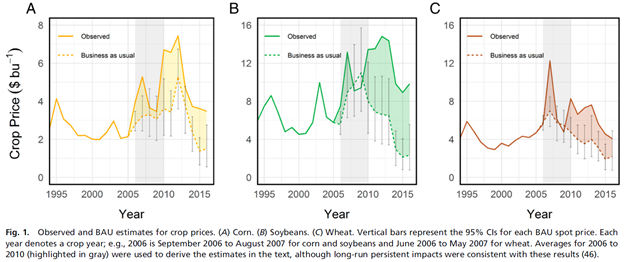
@ASmithUCD @RinnyTheGopher Believe that's the price analysis used in the recent Lark et al. paper. In the no-RFS (BAU) case, corn prices appear to be ~$1.50/bu in 2015, and soybean prices appear to be ~$2/bu. CIs indicate prices could be even lower. Those prices seem untenable, esp. for more than a year.
@ASmithUCD @RinnyTheGopher Um, the corn crop was planted in the spring of 2007.
RFS2 was established in the Energy Independence and Security Act, which was enacted in December 2007.
@GasBuddyGuy Feel free to contact me if you want to have a conversation about a subject that is more complex than lends itself to Twitter. Otherwise have a good evening.
Corn area planted in 2007, when the Renewable Fuel Standard was expanded: 93.5 million acres.
Corn area last year: 93.4 mil ac.
Prospective plantings for 2022: 89.5 mil ac.
Worth noting since there’s been a lot of press about land use change recently.
@GasBuddyGuy The average farm price of corn was $2.00/bu in crop year 2005/06 (ending Aug. 2006). It averaged $2.10/bu from 2000/01 to 2005/06. I worked with the ag sector at that time. It wasn't a great period for farmers.