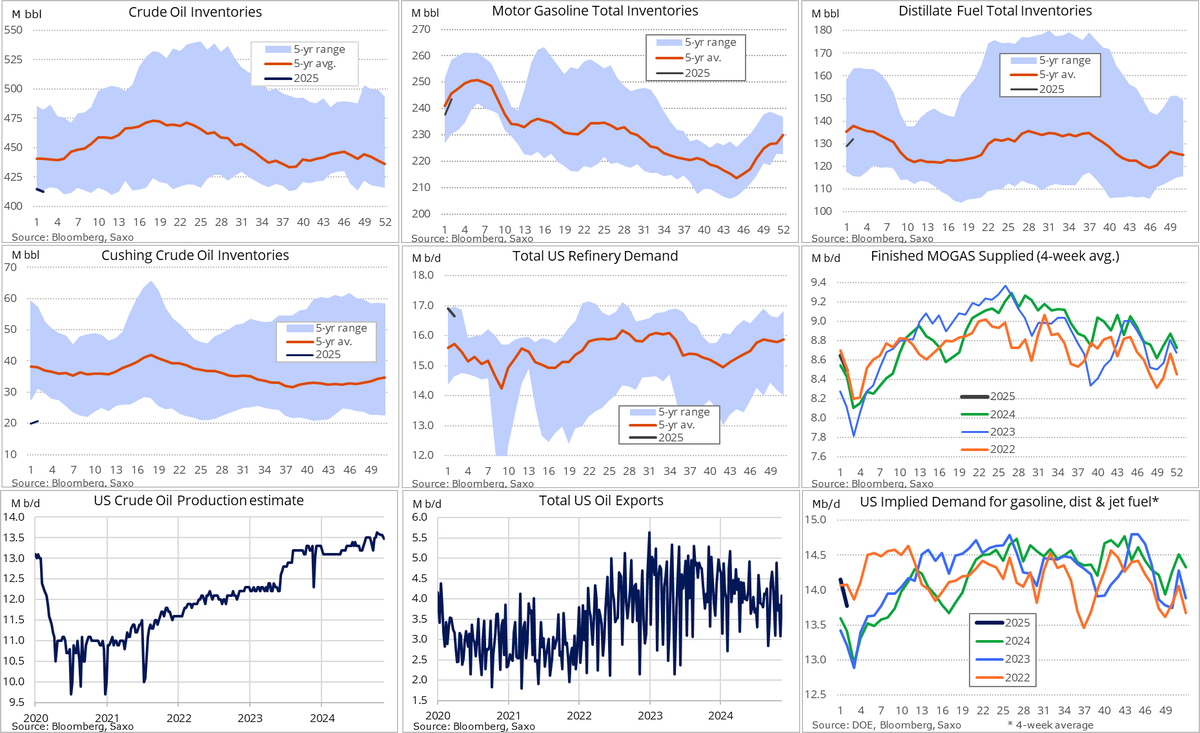
@TomKloza Lower risk play after stellar distillate run. Likely not for a month or two but butane will drive the RBOB curve into contango and holding summer RBOB will be a risk adjusted better bet.
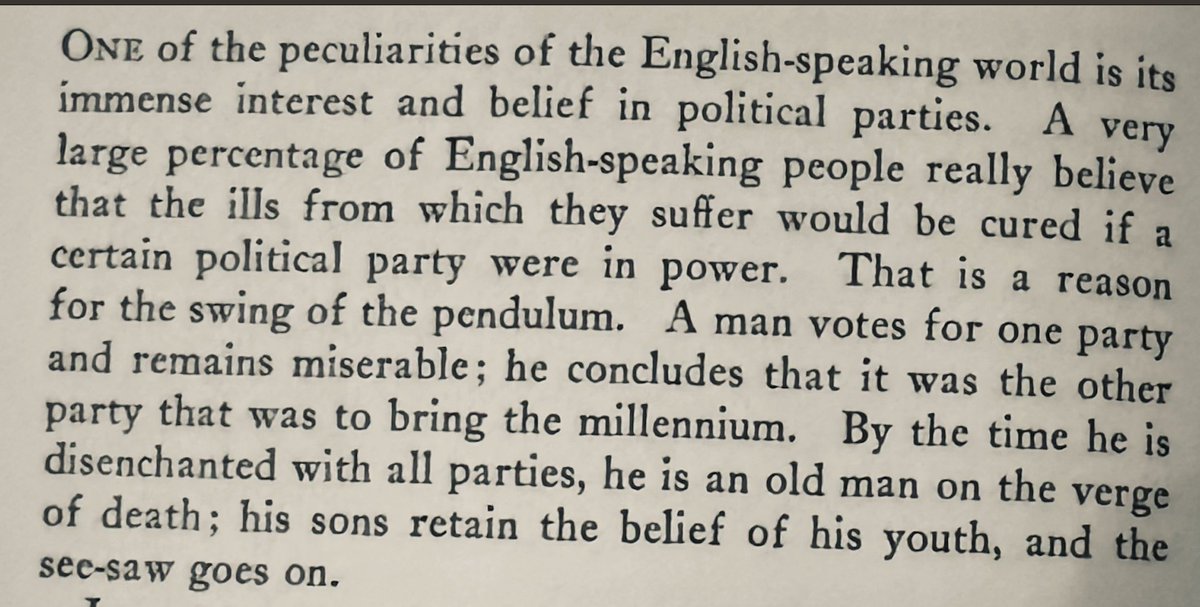
From Bertrand Russell almost a 100 years ago
Society would be much better off if they realized that neither party is coming to save you
If you want to change yourself, get off your couch and make it happen
If you want to change the world, get off your couch and make it happen
US Mogas getting interesting - cash markets in PADD I, II and V spicey. USAC F trading +250-+300 over June for prompts. Imports getting pulled away due to outages. Still time to solve for June RBOB - but will need more import help.
US Mogas - Stocks arguably on the high end, cash markets ho hum, imports steady but potentially easing as rvp rollover takes hold. Positioning not hugely consequential. Contango storage plays should quell any front end supply issues in the Atlantic Basin.
EIA reporting a 2mb drop in #crudeoil stocks to an April 2022 low, with a 1m b/d jump in exports being only partly offset by 0.3m b/d lower refinery input. Production a tad lower amid weather while jump 1m b/d. Meanwhile a big buildup in gasoline and distillates continue
Here's a brief definition of the Laffer Curve with a conceptual graph:
Definition:The Laffer Curve illustrates the relationship between tax rates and tax revenue. It suggests that there's an optimal tax rate that maximizes revenue; beyond this point, higher tax rates can lead to a decrease in revenue as they discourage economic activity or encourage tax avoidance.
Graph:
Tax Revenue
^
|
| /\
| / \
| / \
| / \
| / \
| / \
| / \
| / \
| / \
| / \
| / \
|/______________________\______
0% 100%
Tax Rate
This curve indicates that both 0% and 100% tax rates yield zero revenue, with the peak representing the tax rate at which revenue is maximized. Remember, this is a theoretical model, and the actual shape and peak of the curve can vary based on numerous economic factors.
@BlacklionCTA Lot of NG hate in COT by trade - Commercials seem uninspired - OI near all time highs - vol at minimum likely picks up - Long side bias here looking for low risk entry
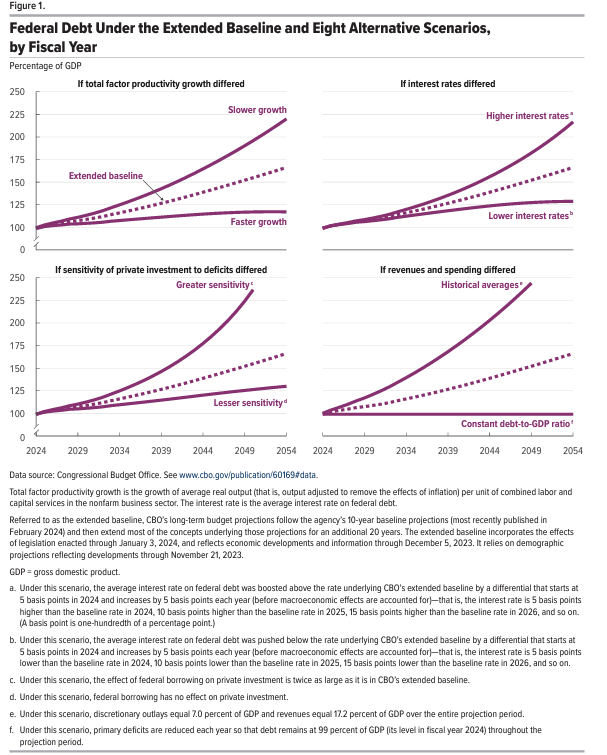
Trigger Warning: Chart of the Day: Scenario Analysis on the Federal Govt Debt to GDP levels Says "Oh Crap"
The CBO does some great work modeling out how horrible the US government's financial picture looks out for the next 30 years as a way to try to tell Congress and the Administration to get their act together and figure things out.
However, since the Fed continuously slays the bond vigilante's ability to exert some pressure on DC policymakers through market pricing by constantly adding USD liquidity at the first sign of Treasury market dysfunction, those in power just sit back and laugh while nothing gets done except blowing out the deficits even further as the appetite for tax hikes and spending cuts are basically nil. Good times.
Below we can see some of the work that CBO did on some alternative scenarios that could play out in the economy and what it might mean for the deficits and debt situation going forward.
Of course, the base case of current debt held by the public to GDP of 99% in 2024 to 166% of GDP in 2054 is a disaster but the alternative cases are also quite interesting.
Some highlights:;
1) If the productivity of labor and capital in the nonfarm business sector grew 0.5 percentage points per year more quickly or more slowly than CBO projects, federal debt held by the public in 2054 would be 124 percent of GDP or 211 percent of GDP, respectively.
2) If the average interest rate on federal debt was higher or lower than the baseline projection by an amount that started at 5 basis points in 2024 and changed by that amount in each year thereafter, federal debt held by the public in 2054 would be 217 percent of GDP or 129 percent of GDP, respectively.
3) If government borrowing reduced private investment by twice as much as it does in CBO’s long-term projections or had no effect on that investment, federal debt held by the public in 2054 would exceed 250 percent of GDP or would be 130 percent of GDP, respectively.
4) If, between 2024 and 2054, discretionary spending and revenues equaled their 30-year historical averages measured as a percentage of GDP, federal debt held by the public in 2054 would exceed 250 percent of GDP.2 Under that scenario, discretionary spending is set to 7.0 percent of GDP and revenues are set to 17.2 percent of GDP in every year—1.9 percentage points more and 1.0 percentage point less, respectively, than they average in CBO’s projections.
5) If, between 2024 and 2054, fiscal policy was set to maintain federal debt held by the public at 99 percent of GDP (its level in fiscal year 2024), primary deficits (which exclude net outlays for interest) would average 0.4 percent of GDP over that period. Under that scenario, primary deficits are reduced each year by decreasing noninterest spending or increasing revenues relative to CBO’s extended baseline by an average of 1.9 percent of GDP. (Primary deficits could also be reduced through a combination of changes to spending and revenues that would have an equivalent effect.)
Of course, my favorite lines are the ones where we have higher interest rates each year which will take debt to GDP up to 217% by 2054 as well as the one when government borrowings crowd out private investments by 2x as much as forecasted which would take debt up to 250%.
Sit with these numbers a bit and then ask why would you ever want to buy today's 20 year auction
@LukeGromen@LynAldenContact@Kathleen_Tyson_
https://t.co/vHfdZdQjZl