Did you know that the headquarters of Ferrari, Lamborghini, and Maserati are located within ~25 km of each other?
This area, known as the Italian Motor Valley, emerged post-WWII as a hub for luxury sports car manufacturers.
Companies like $RACE and Maserati, part of $STLA, established their headquarters in the Emilia-Romagna region. Lamborghini, part of $VOW, later joined the fold in the 1960s, transitioning from tractors to high-performance vehicles.
And perhaps there wouldn't be such a rich ecosystem if it weren't for Ferrari's bad clutches. Ferruccio Lamborghini later recounted how the idea to build his own car came about:
"The problem with the clutch was never cured, so I decided to talk to Enzo Ferrari. I had to wait for him a very long time. 'Ferrari, your cars are rubbish!' I complained. Il Commendatore was furious.
'Lamborghini, you may be able to drive a tractor but you will never be able to handle a Ferrari properly.' This was the point when I finally decided to make a perfect car."
The concentration of brands like Ferrari, Lamborghini, and Maserati in a small area has built an automotive ecosystem fueled by innovation and motorsports. Pagani, founded in the 1990s, brought bespoke hypercars to the mix, intensifying competition and driving global excellence in luxury vehicles.
Are you familiar with Ball Corporation?
$BALL is one of the world's largest manufacturer of aluminum cans, supplying basically every beer and soda brand you can think of.
Ball has compounded its EPS by 8% for 44 years (!), returning ~51,900% to its shareholders including dividends.
To Put Ball's Size In Perspective
In the markets where Ball operates, an estimated ~270 billion units were manufactured in 2023, with Ball holding approximately 40% of the market share.
A Pure-Play on Aluminum Packaging
In February of this year, Ball sold its Aerospace division to BAE Systems for $4.5 billion. The company plans to use $2 billion to reduce debt and return $2 billion to shareholders through share repurchases. The company is now fully focused on aluminum packaging for beverage and household brands.
Tip: If you had set up "sales proceeds" as a keyword alert in the Quartr Mobile App, you would have discovered this special situation.
Another one of those boring and resilient businesses worth studying and having on your Quartr following list, if you ask us.
$NVDA Q3 2025
"The age of AI is in full steam, propelling a global shift to NVIDIA computing" - Jensen Huang
Revenue +94%
*Data Center +112%
*Gaming +15%
*Professional Vis. +17%
*Automotive +72%
EBIT +110%
*marg. 62% (57)
EPS +111%
We've teamed up with @Speedwell_LLC to bring you an extensive $EVO deep dive – the quiet giant of the gambling world.
Over the last decade, Evolution has grown its revenue and EBIT by 57x and 122x respectively, expanding its margin from 30% in 2012 to well over 60% in 2023 – a masterclass in growth, execution, and innovation.
Don't miss this week's cover story – dropping tomorrow – to uncover what makes Evolution’s journey one for the books → https://t.co/K3ka1iKcwS
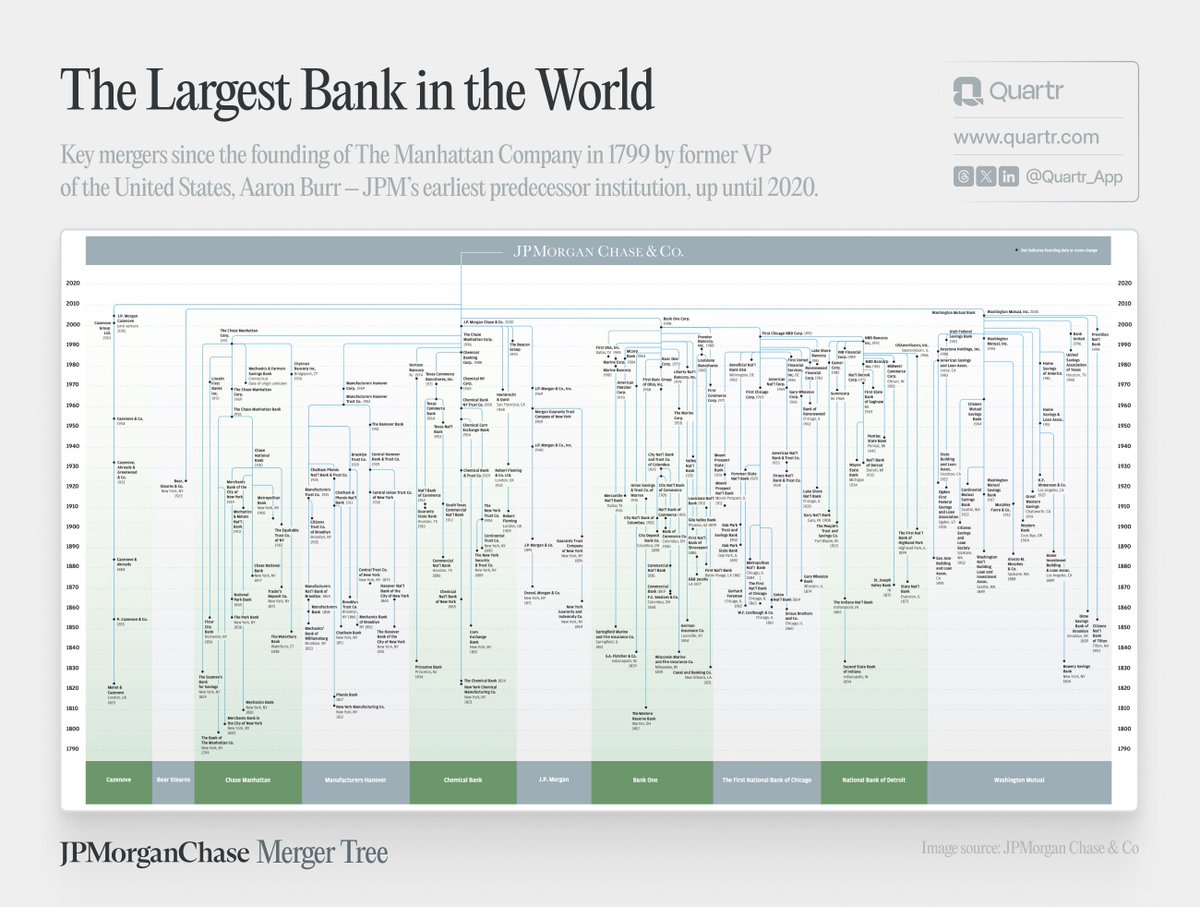
This is a crazy chart.
It depicts 120+ key mergers and acquisitions, starting from The Manhattan Company, formed in 1799, and leading to the bank we know today as JPMorgan Chase.
In total, $JPM is built on 1,200 predecessor institutions over its 225-year history.
$EVO – The Live Casino Juggernaut.
Visually comparing the average monthly player numbers for Evolution, Pragmatic Play, and Playtech over the last four years:
Yesterday, $NVDA fell by ~10%, erasing around $280 billion from its market cap, making it the largest one-day drop in history.
Here's what that $280 billion could get you:
→ Nestlé ($280B market cap)
→ 2x Lockheed Martin ($135B)
→ 3x Shopify ($92B)
→ 4x Palantir ($68B)
→ 5x Volkswagen ($55B)
→ 7 million Tesla Model 3 ($40,000 each)
2. $DECK bought HOKA in 2012 for ~$1.1 million. A decade later, the company has grown HOKA's revenue from less than $3M to over $1.4B (FY23). That's close to a 500x increase.
Is HOKA one of the most impressive consumer product acquisitions of all time?
Below, we present ten of our current favorite visuals, highlighting key business insights and transformations.
1. Comparing the 3-year growth CAGRs and the insane scale of advertising revenue streams from $GOOGL, $META, and $AMZN:
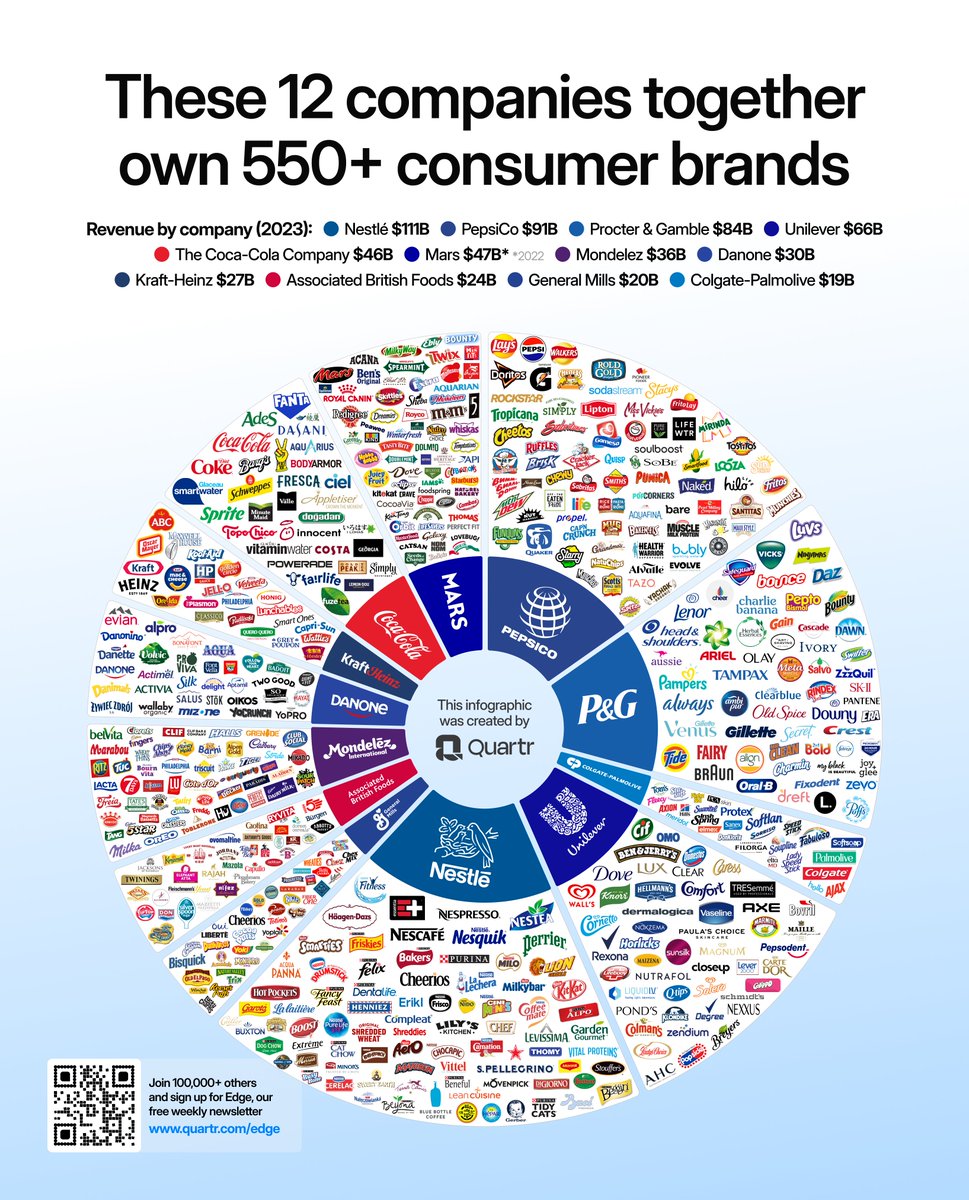
This might be the most demanding visual we've created – including 550+ logos.
This chart illustrates the brands within 12 of the largest consumer brand conglomerates in the world.
$NESN $PEP $PG $ULVR $KO $MDLZ $BN.PA $KHC $ABF.L $GIS $CL
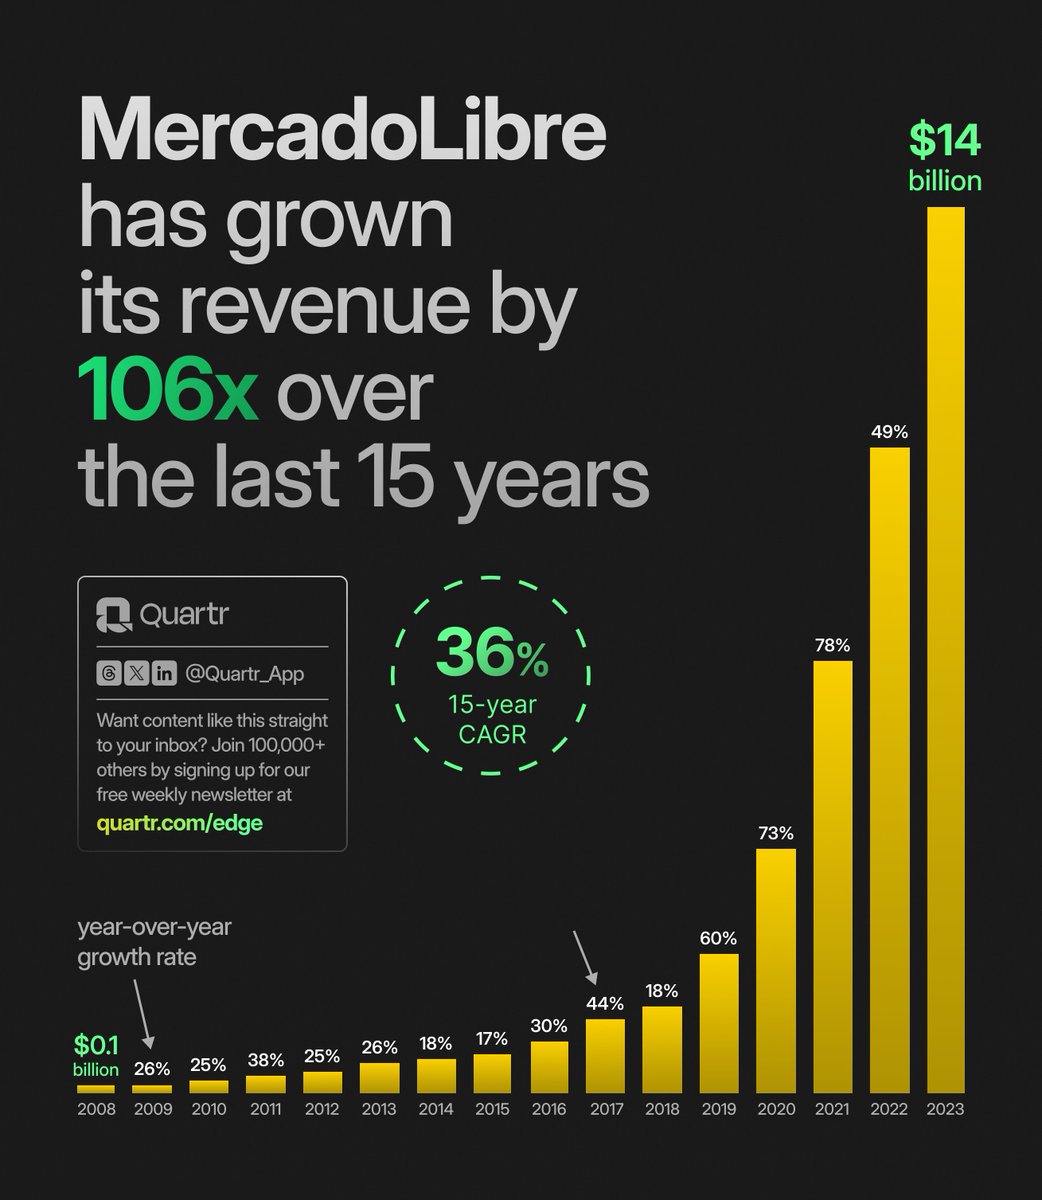
As the largest e-commerce platform and one of the leading fintech platforms in Latin America, $MELI has a financial history few can match.
The company has maintained positive cash flow since its 2007 IPO, with revenue increasing 106x over the past 15 years:
For the second year in a row, @FastCompany ranks Quartr as one of the top 5 most innovative companies in personal finance – this year alongside giants like Apple and Revolut. Thank you all for the support!
https://t.co/6joiEFoL7a
You don't have to chase the "next big thing" to achieve great (or stable) returns.
Discover hidden gems among 65+ machinery companies, ranked by their 10-year EPS CAGRs, all showcased in a single chart: