Tensor Decompositions for Data Science [and Computational Science]: https://t.co/WofrhrRiGo
——
#ML#MachineLearning#DataScientist#DataScience#Mathematics#Algorithms#AI
——
Note: Extensive background materials in linear algebra, optimization, probability, and statistics are included as appendices.
Want to learn how to analyze and visualize spatial data in R? From mapping environmental changes 🌱 to tracking disease outbreaks 🏥 and optimizing business decisions 📍, spatial analytics is transforming industries.
https://t.co/CroNRTZxpf
#RStats#DataScience#GIS#SpatialData
Still creating your reports manually in Word or PowerPoint?
This is one of the biggest productivity bottlenecks in data analysis because every change in your data requires manual updates to results, tables, and visualizations. This process is not only time consuming but also increases the risk of errors.
❌ Results can quickly become outdated when the data changes.
❌ Copy and paste workflows increase the chance of mistakes and inconsistencies.
Quarto solves this problem by allowing you to create fully reproducible and automated reports directly from R.
The visualization below shows the result of a typical Quarto workflow. You combine text, R code, and output in a single file, and Quarto automatically generates the final report. This ensures that your results, tables, and visualizations are always up to date and fully synchronized with your data.
Want more content like this? Subscribe to my newsletter for practical insights on statistics, data science, AI, and programming in R and Python. Click this link for detailed information: https://t.co/ktUcWo9XpO
#datastructure #DataScientist #DataAnalytics
Estudio sobre tu “mejor yo posible”
Imaginar tu mejor versión futura (en lo personal, relacional y profesional) durante 2 semanas genera aumentos claros y duraderos en optimismo.
Extraño ejercicio de psicología positiva respaldados por evidencia
https://t.co/so5L8GgQMa
clusterProfiler permite:
• Analizar genes codificantes y no codificantes.
• Realizar enriquecimiento funcional con múltiples bases de datos.• Comparar tratamientos y series temporales en una sola ejecución..#rstats#Bioinformatics#Genomics#Transcriptomics#DataScience
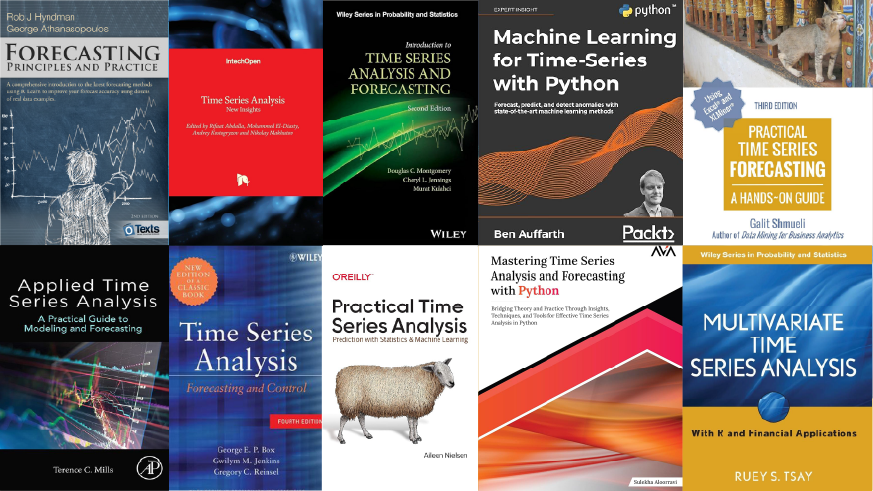
Por eso he recopilado algunos de los contenidos que considero útiles para cualquier persona que trabaje con datos, ya sea en investigación, análisis de negocio, ciencia de datos o IA.
https://t.co/2ZfptyJREr
👇¿Qué te habría gustado comprender mejor al principio de tu carrera?
[Tip de R] · [Paquete 📦] · astronomR: Un puente entre la ciencia de datos y el cosmos en R.
¿Trabajás con datos astronómicos y sentís que R no tiene las herramientas específicas que necesitás? ¡No te preocupes más! El paquete astronomR llega para llenar ese vacío, ofreciendo un marco estadístico robusto para analizar y visualizar datos de astronomía y cosmología.
astronomR te permite:
✔️ Análisis estadístico: Realizá análisis profundos de tus datos cósmicos con funciones diseñadas para este tipo de información.
✔️ Visualización intuitiva: Creá gráficos y exploraciones visuales para entender mejor los fenómenos espaciales.
✔️ Herramientas de cosmología: Aplicá modelos y herramientas específicas para estudios cosmológicos directamente en R.
Lo más valioso de astronomR es que democratiza el acceso a análisis astronómicos complejos, permitiendo que tanto expertos como entusiastas exploren el universo con R.
💡 Tip
Si te dedicás a la astrofísica, la cosmología o simplemente sos un entusiasta de los datos espaciales, probá astronomR. ¡Te va a ahorrar mucho tiempo y simplificar tareas complejas!
🔗 https://t.co/bg4PTcXatf
✍️ samrit2442
#RStats #RStatsES #Rtips #DataScience
Hola🤠 comparto el código #R para descargar directamente la #baseDatos#VDem (sin necesidad de bajarlo a tu 💻 )
También agrego una librería que me gusta muchísimo porque te permite asignar automáticamente cada país a su continente🌎
🔗https://t.co/145WZACZhj
#CódigoDeTodxs
Automating report creation can save a significant amount of time, especially when reports need to be updated regularly (e.g. monthly or yearly).
A very useful tool for this is Quarto in R. It is a modern publishing system that allows you to combine text, code, and results in a single document. Your R code is executed directly inside the document, and outputs such as tables, figures, and summaries are automatically included in the final report. You can also choose the output format, for example HTML, PDF, or DOCX.
If you are creating the same report repeatedly, you simply update the input data and run the Quarto document again. That’s it.
If you’re interested in topics like this, sign up for my newsletter to get practical tips on statistics, data science, AI, and programming with R and Python.
Learn more by visiting this link: https://t.co/ktUcWo9XpO
#StatisticalAnalysis #statisticians #DataAnalytics #RStats
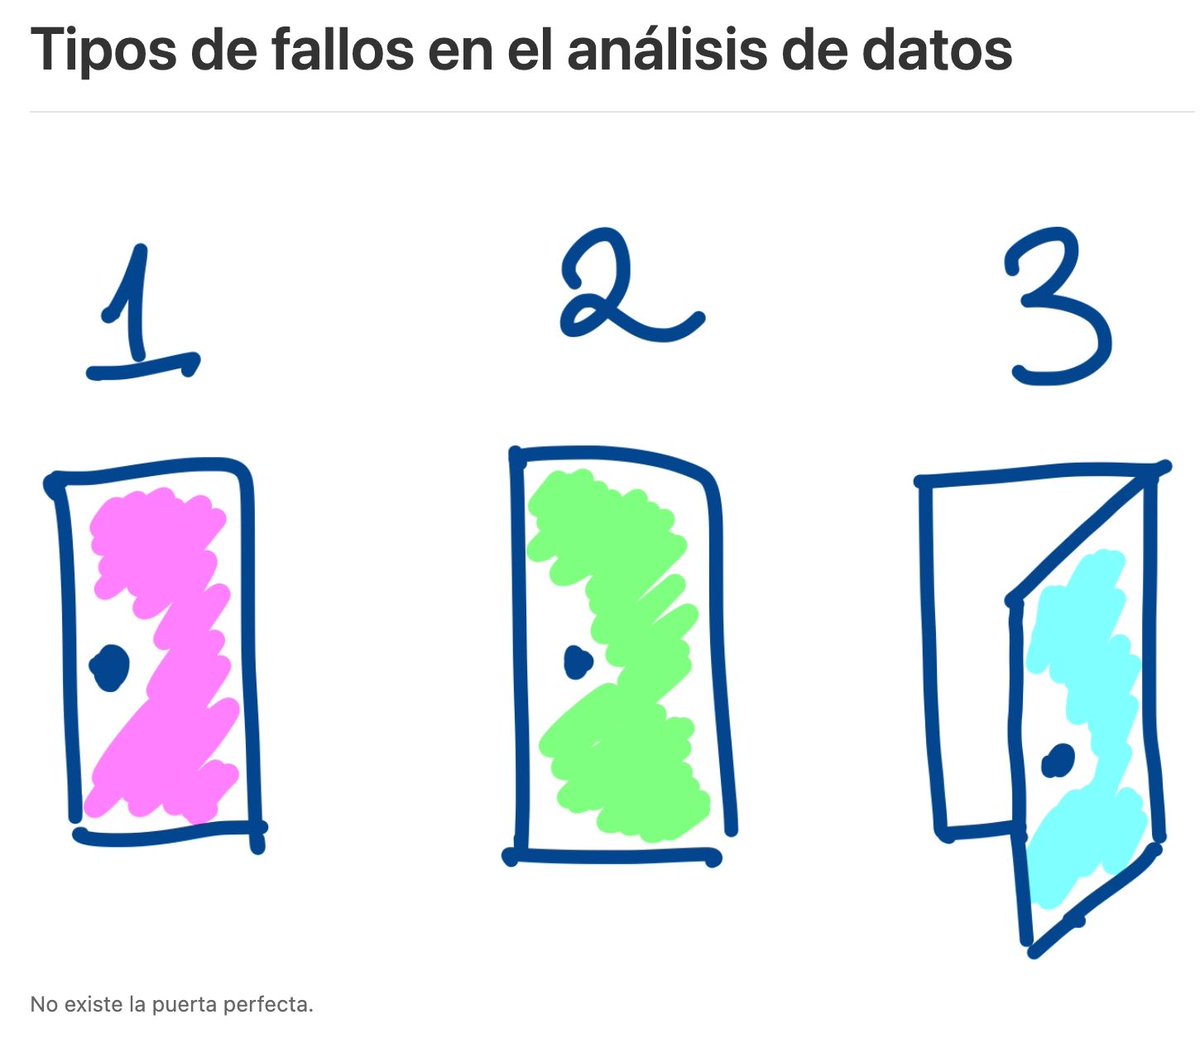
📚Un libro para regalar estas Navidades: El Arte de la Estadística by David Spiegelhalter.🙌
💡Desarrolla tu Intuición Estadística.
💫Ejemplos útiles para comprender conceptos estadísticos clave.
🔄Dónde y cómo las cosas pueden salir mal.
@Capitan_Swing
https://t.co/S5zYDMtKeZ
Good R code should be readable, reusable, and reproducible. Here are 10 best practices that can help improve your R programming workflows:
1️⃣ Use R Projects to organize your work and manage file paths consistently.
2️⃣ Avoid hard-coded paths. Use file.path() for portable code.
3️⃣ Separate your code into logical sections such as data preparation, analysis, and visualization.
4️⃣ Load only the packages you actually need.
5️⃣ Use consistent commenting to improve readability.
6️⃣ Choose descriptive object names instead of overwriting original datasets.
7️⃣ Use set.seed() whenever randomness is involved to ensure reproducibility.
8️⃣ Prefer pipelines over deeply nested functions.
9️⃣ Use vectorized functions instead of unnecessary loops.
🔟 Write custom functions for repeated tasks to avoid duplicated code.
In a recent Statistics Globe Hub module, I covered practical best practices in R programming, including reproducibility, script organization, pipelines, vectorized programming, and writing reusable functions.
The Statistics Globe Hub is an ongoing learning program on statistics, data science, AI, and programming with R and Python. New hands-on modules are released every Monday.
More info: https://t.co/NA2b7UAXJ4
#rstats #datascience #programming #statistics #rprogramming #statisticsglobehub
[Tip de R] · [Paquete 📦] · ggcube: ¡Dale una nueva dimensión a tus gráficos de ggplot2 con visualizaciones 3D!
¿Cansado de que tus datos tengan potencial para el 3D, pero tus gráficos se queden en 2D? El paquete ggcube te permite construir figuras 3D usando ggplot2, manteniendo esa sintaxis que tanto conocés y extendiendo sus capacidades para explorar tus datos en tres dimensiones.
✔️ geom_surface() y geom_point() en 3D: Creá superficies, dispersiones, volúmenes y más, usando x, y y z para mapear tus datos.
✔️ coord_3d(): Una joyita que te da control total sobre la rotación, perspectiva y hasta la iluminación de tus gráficos 3D.
✔️ Flexibilidad total: Combiná capas 3D con 2D en las caras del cubo,
🌐 https://t.co/whbZqCJ34s
#RStats #RStatsES #Rtips #DataScience
🤖 ¿Sabías que puedes integrar GitHub Copilot en tu flujo de trabajo con R y RStudio?
GitHub Copilot es un asistente de IA que te sugiere código, funciones, comentarios y documentación en tiempo real mientras trabajas en RStudio IDE.
#DataScience#GitHubCopilot#RStudio#IA
Los elefantes e hipopótamos comparten hábitats y a veces interactúan. Los elefantes son muy protectores por naturaleza, como en este video, está evitando que el bebé hipo se acerque a donde hay cocodrilos.


![estacion_erre's tweet photo. [Tip de R] · [Paquete 📦] · ggcube: ¡Dale una nueva dimensión a tus gráficos de ggplot2 con visualizaciones 3D!
¿Cansado de que tus datos tengan potencial para el 3D, pero tus gráficos se queden en 2D? El paquete ggcube te permite construir figuras 3D usando ggplot2, manteniendo esa sintaxis que tanto conocés y extendiendo sus capacidades para explorar tus datos en tres dimensiones.
✔️ geom_surface() y geom_point() en 3D: Creá superficies, dispersiones, volúmenes y más, usando x, y y z para mapear tus datos.
✔️ coord_3d(): Una joyita que te da control total sobre la rotación, perspectiva y hasta la iluminación de tus gráficos 3D.
✔️ Flexibilidad total: Combiná capas 3D con 2D en las caras del cubo,
🌐 https://t.co/whbZqCJ34s
#RStats #RStatsES #Rtips #DataScience](https://pbs.twimg.com/media/HJzotMqbUAAyxiB.jpg)
![estacion_erre's tweet photo. [Tip de R] · [Paquete 📦] · ggcube: ¡Dale una nueva dimensión a tus gráficos de ggplot2 con visualizaciones 3D!
¿Cansado de que tus datos tengan potencial para el 3D, pero tus gráficos se queden en 2D? El paquete ggcube te permite construir figuras 3D usando ggplot2, manteniendo esa sintaxis que tanto conocés y extendiendo sus capacidades para explorar tus datos en tres dimensiones.
✔️ geom_surface() y geom_point() en 3D: Creá superficies, dispersiones, volúmenes y más, usando x, y y z para mapear tus datos.
✔️ coord_3d(): Una joyita que te da control total sobre la rotación, perspectiva y hasta la iluminación de tus gráficos 3D.
✔️ Flexibilidad total: Combiná capas 3D con 2D en las caras del cubo,
🌐 https://t.co/whbZqCJ34s
#RStats #RStatsES #Rtips #DataScience](https://pbs.twimg.com/media/HJzotMhbEAABCN3.jpg)


![KirkDBorne's tweet photo. Tensor Decompositions for Data Science [and Computational Science]: https://t.co/WofrhrRiGo
——
#ML #MachineLearning #DataScientist #DataScience #Mathematics #Algorithms #AI
——
Note: Extensive background materials in linear algebra, optimization, probability, and statistics are included as appendices.](https://pbs.twimg.com/media/HL2_UcFWQAAWFh0.jpg)