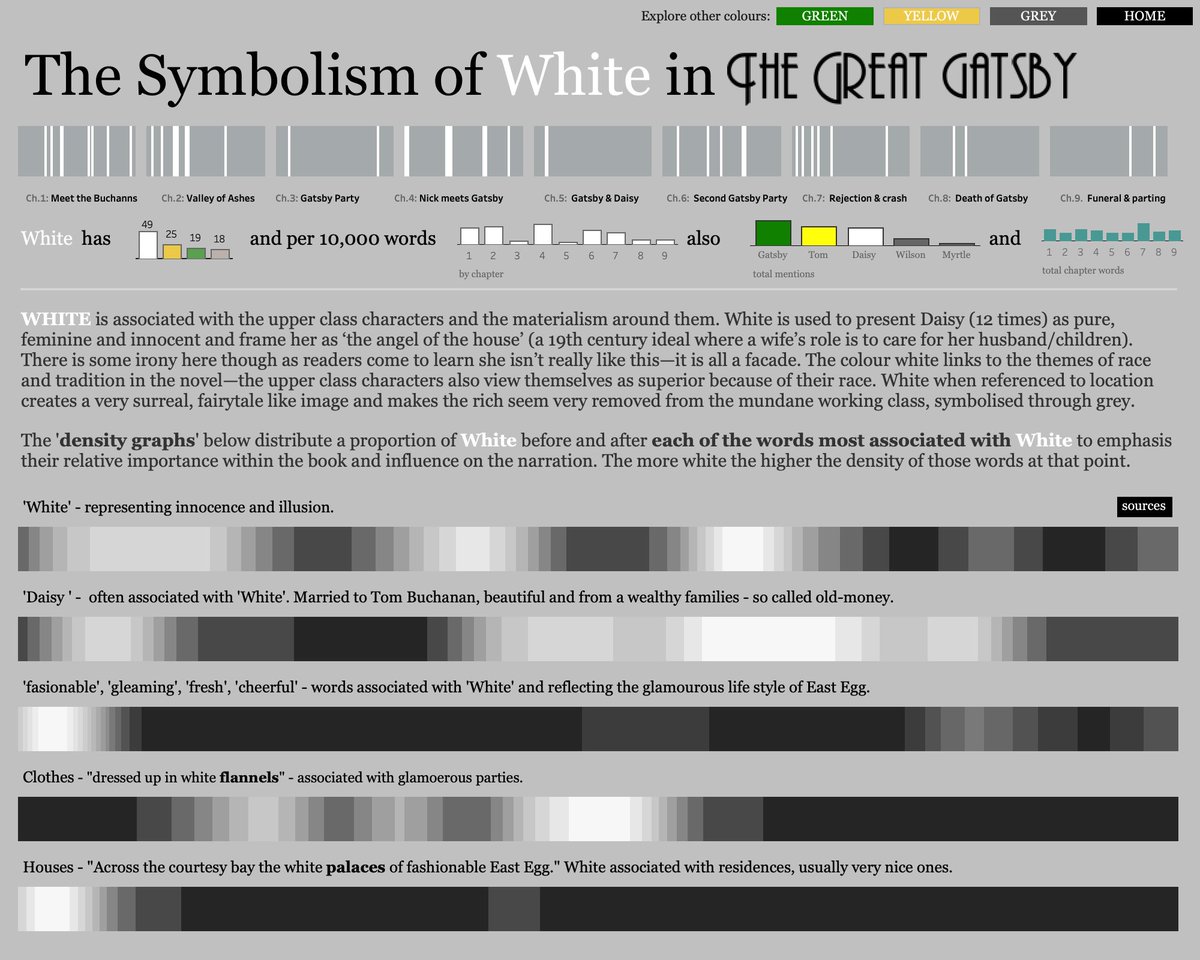
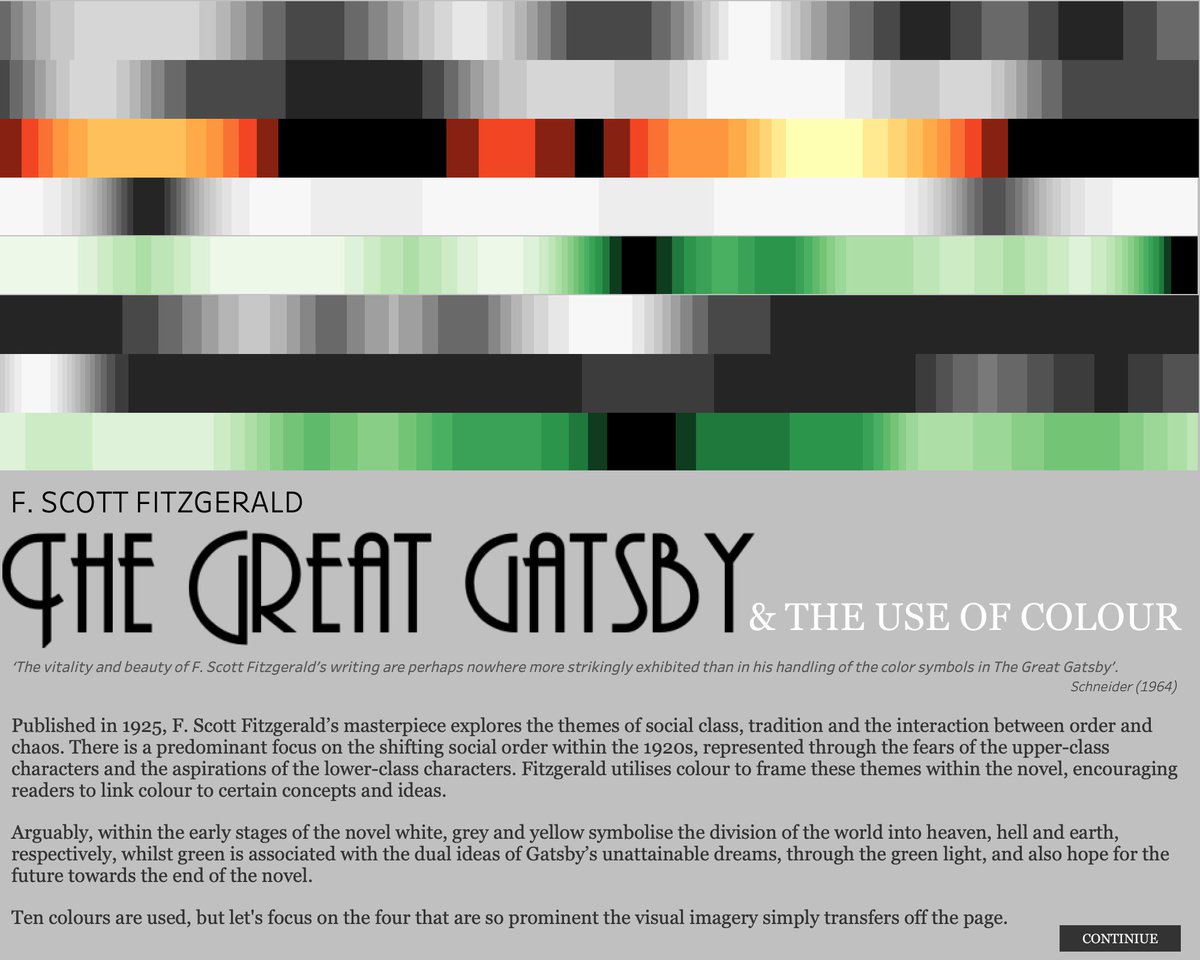
‘The Great Gatsby and the use of Colour’ #ironviz number 17 stretching back to 2014. My daughter’s favourite book, and with her studying English at university, the best part was discussing the book with her. The viz itself is my usual sort of stuff.
10 years of #IronViz and I've got a love/hate relationship with it. It's great to finish, great to use Tableau, but the journey can be brutal, and the output disappointing. Sure I'm still designing like it's 2014 but an appropriate viz for today at least.
🚨 Job of the week 🚨
Our innovative Business Intelligence service are seeking two new members to join their team 👏
✅ Research & Insight Manager
✅ Research & Insight Officer
Apply by 15 September 👇
https://t.co/eEGwAAzARC
https://t.co/gdjJGb23G5
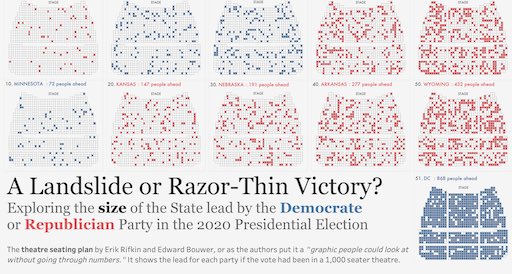
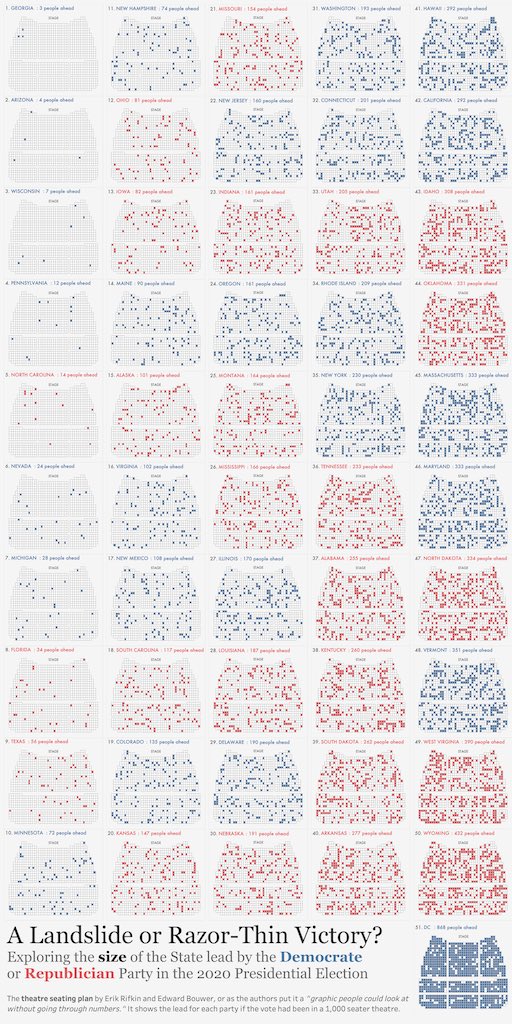
For #IronQuest alternative charts….I’ve sat on this too long trying to make another risk theatre work well, but 50+ probably too many.
https://t.co/H1IZOHTmvz
It's been a few years since I posted a @tableau tutorial (I've been busy working on a PhD), but with the 2024 election looming, I wanted to show how to display both tiles maps AND small multiples with animation. Check out the tutorial here: https://t.co/j5c7XzABP0
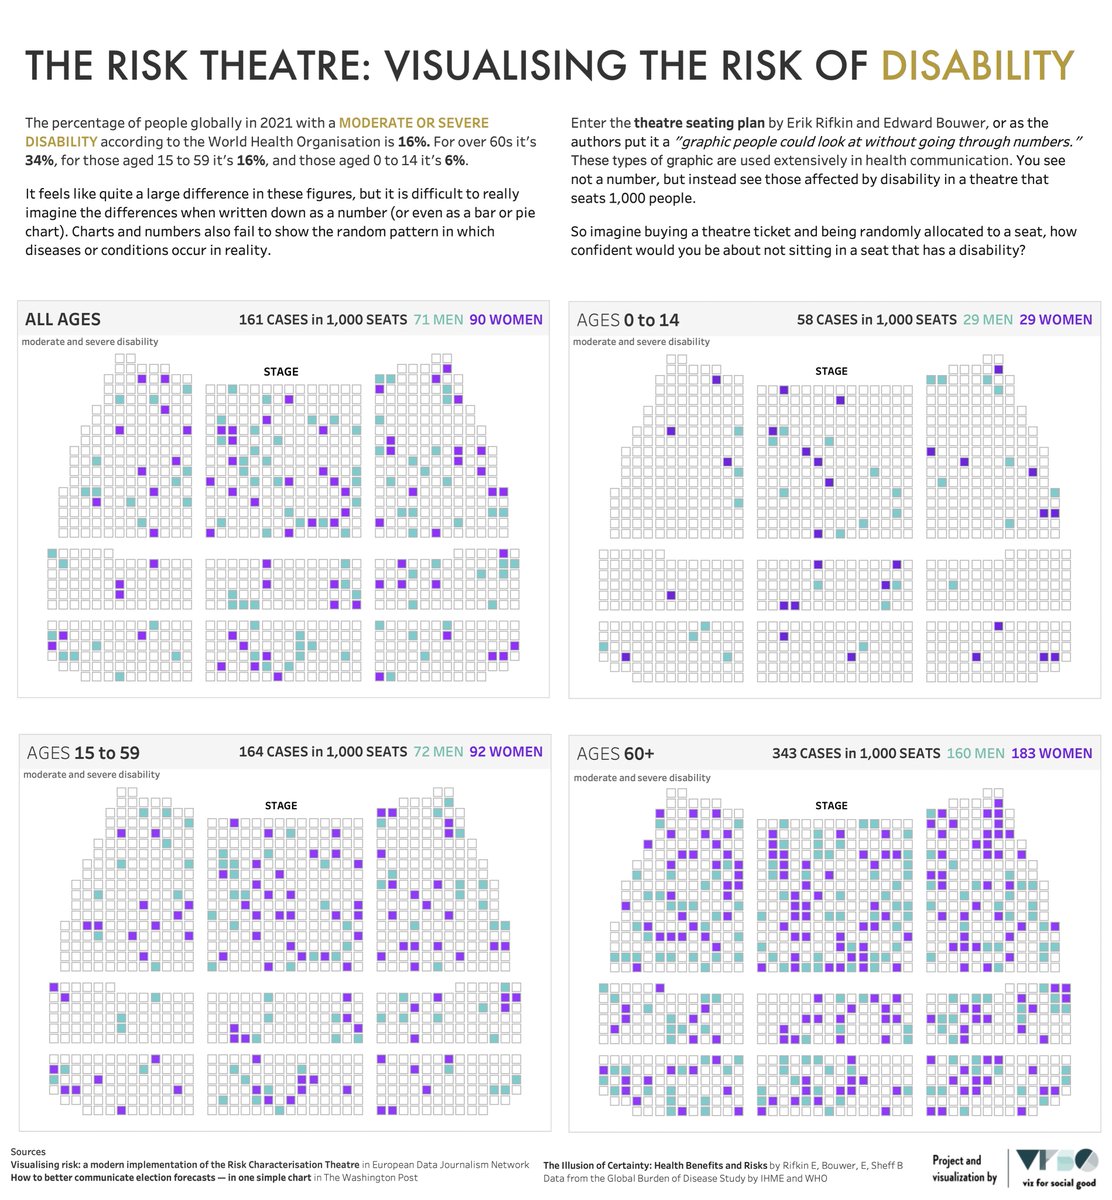
For the #VizforSocialGood I ran with the call to action from the WHO to “Get creative and don’t be afraid to think outside the box.”
https://t.co/P9dVeXfJ3B
@emdepad Thanks. Amanda Cox talked about a world of bar charts being cold. I didn’t fully understand what she meant until I saw examples of this technique.
@ZenDollData Thanks Lindsay….Why I love community challenges. Forces you to find and learn different techniques and ideas. And this way of vizzing resonates with me in a way a bar chart can’t.