Excited to release my first #rstats package into the wild! Introducing sportyR: a package to plot sports playing surfaces for #sportsanalytics visuals.
New features already in the works!
After eight months of development, I'm thrilled to launch cbbdata.
This new R package offers access to college basketball data like never before. Built with Flask & Python for speed and reliability, it's fast, flexible, and loaded with features.
⬇️⬇️
https://t.co/KtVNjVhjsl
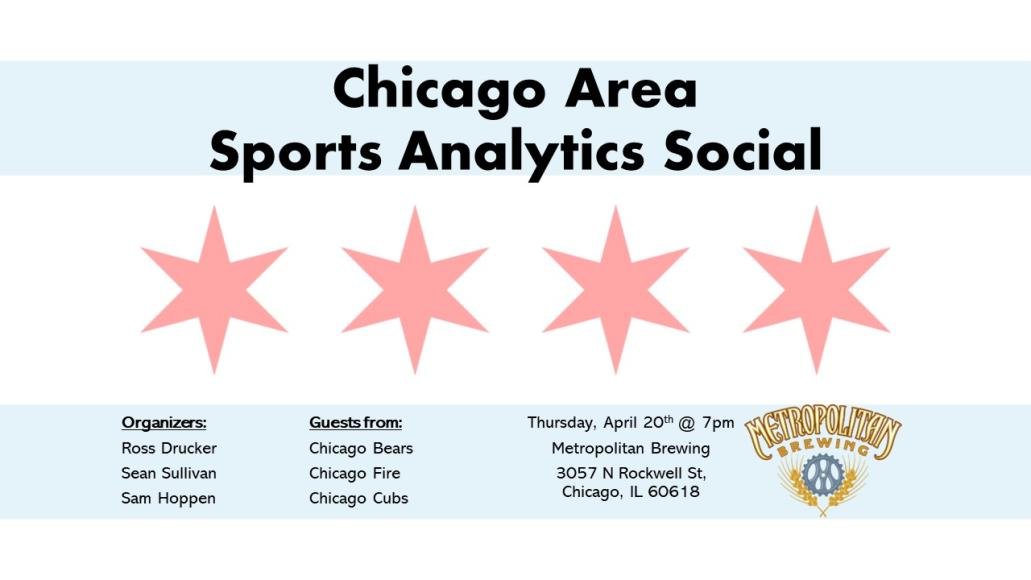
Sending out a reminder that the Chicago Area Sports Analytics Group is having a social event tomorrow night at Metropolitan Brewing.
Come on out to and please share!
h/t to @SamHoppen and @rossdrucker9!
@rtelmore@benj_robinson@statsinthewild0 Not as far as I'm aware, but would welcome/appreciate any feedback if it's something you look into doing. Glad you're enjoying the package!
Sending another reminder that the Chicago Area Sports Analytics Social is this Thursday, at Metropolitan Brewing at 7pm!
Come hang out!
@SamHoppen@rossdrucker9
Excited to share that the sports analytics social tour is coming to Chicago! @papamoon92, @rossdrucker9, and I will be hosting people at Metropolitan Brewery on April 20th at 7pm. We'll have guests from the Bears, Cubs, and more! Come join us!
@chickenandstats Just a quick glance and haven't played around with it on my end yet, but it looks like you'd need to x_trans to be -25 and y_trans to be -50? Then would need to rotate the court plot +/- 90°... if you can point me to the data set you're plotting I can confirm. DM me too if easier
@IcaroBSC The surfaces are intended to be fully customizable in terms of dimension and color. Check out the cani_* functions as well; they're meant to guide you through editable parameters (leagues, dimensions, and colors) of each surface
@IcaroBSC Awesome! If it's easier in the future, you can also change the line thickness and color by using sportyR::geom_soccer(pitch_updates = list("line_thickness" = {desired thickness of the lines in the units of the pitch}), color_updates = list("{feature_name}" = "{color_code}"))
With all these shot locations, you'll definitely want to check out @rossdrucker9's {@sportyR_pkg} and {@sportypy} packages to make some shot charts. For the basketball courts in particular, the possibilities in customization are endless!
Excited to release my first Python package! Introducing @sportypy: a package to plot sports playing surfaces for #sportsanalytics visuals, and a @sportyR_pkg equivalent in Python.
New features already in the works!