Pinned index post linking to a simple table of contents page to make it easier to find my normal daily posts.
As interest in this content is reducing, some threads may not be posted to twitter every day but will still be available via index page.
https://t.co/py0xxj2dIx
@taylopj I think this is all we need to see though. It's not gone away but every time the line starts to head up a few people try and drum up some panic and suggest interventions - then it peaks by itself and the media lose interest again.
@taylopj Hi yes all good thanks. The main objective of my feed was to try and combat the hysteria and misinformation in the media so when they finally moved on last year then I decided it was time to stop posting. I still update my website when I remember but very few visitors these days.
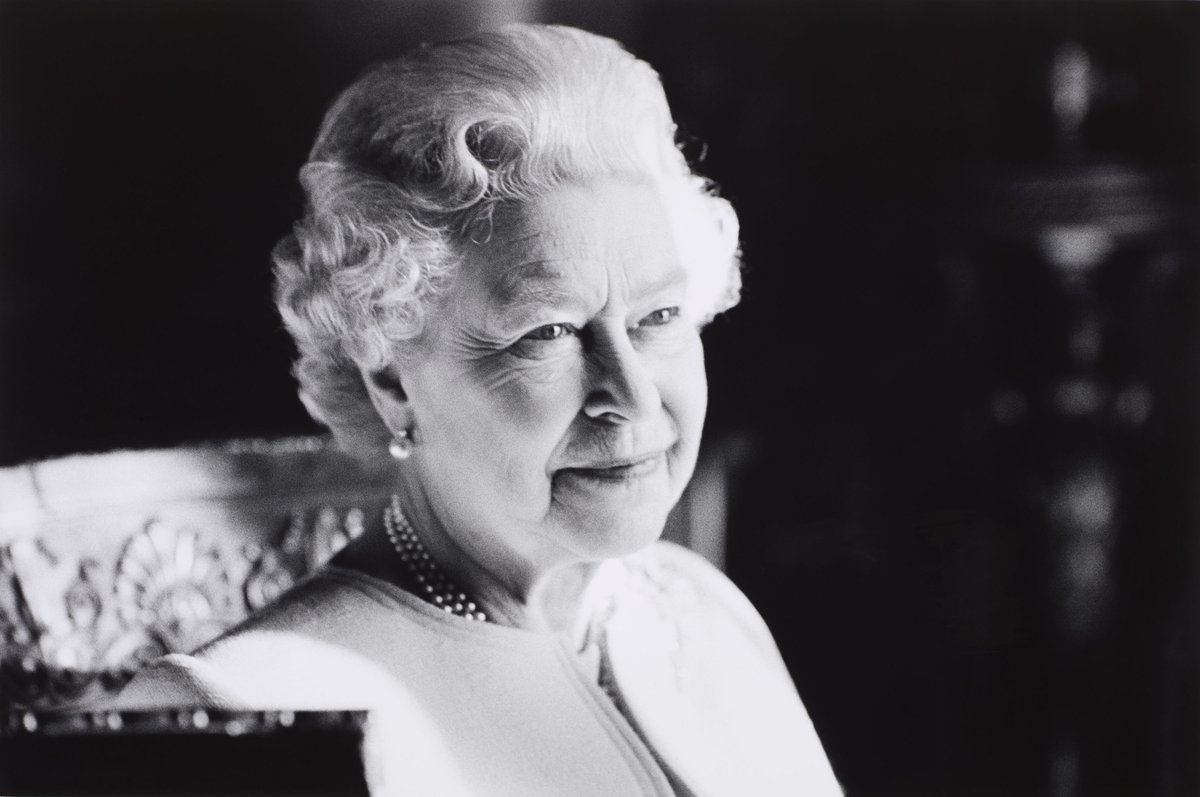
The Queen died peacefully at Balmoral this afternoon.
The King and The Queen Consort will remain at Balmoral this evening and will return to London tomorrow.
@Scouservicky That was Death Valley. 282 feet below sea level and hottest place on Earth. We stayed the night - thankfully the aircon was excellent and the pool was like a bath at 10 o'clock at night.
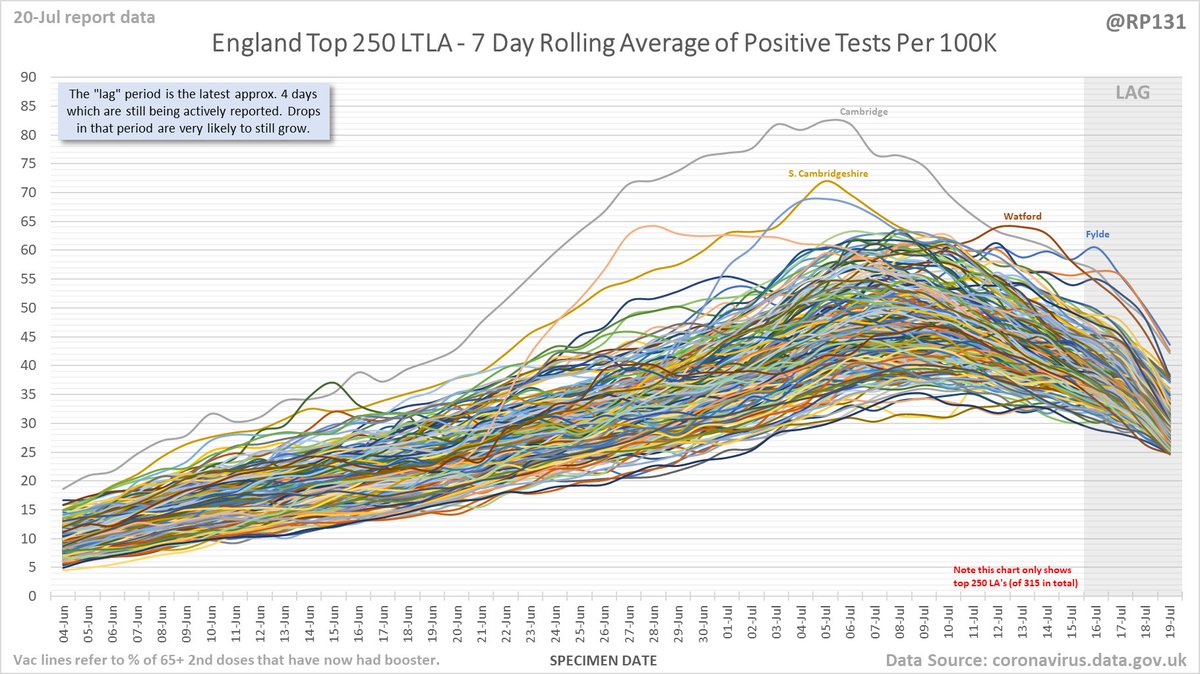
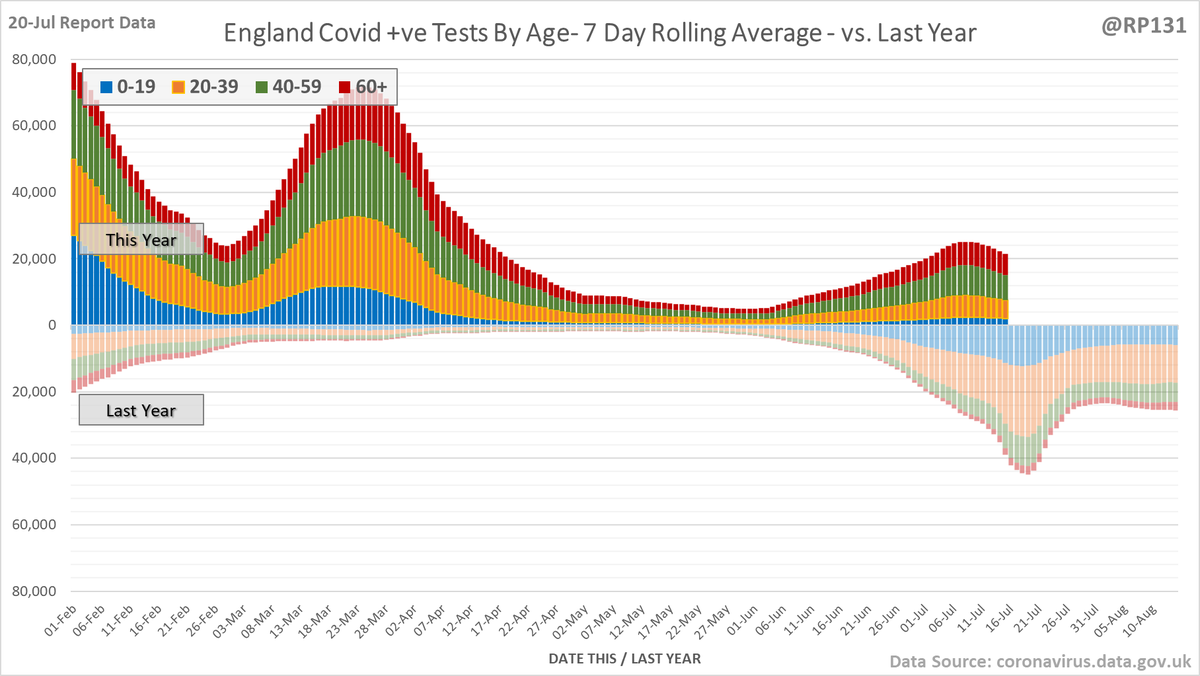
Seems to be peaking ok without any further interventions. Website updated with content that still appears to work following the switch to weekly-only data. Away on holiday so only a quick update.
https://t.co/py0xxjjOA5
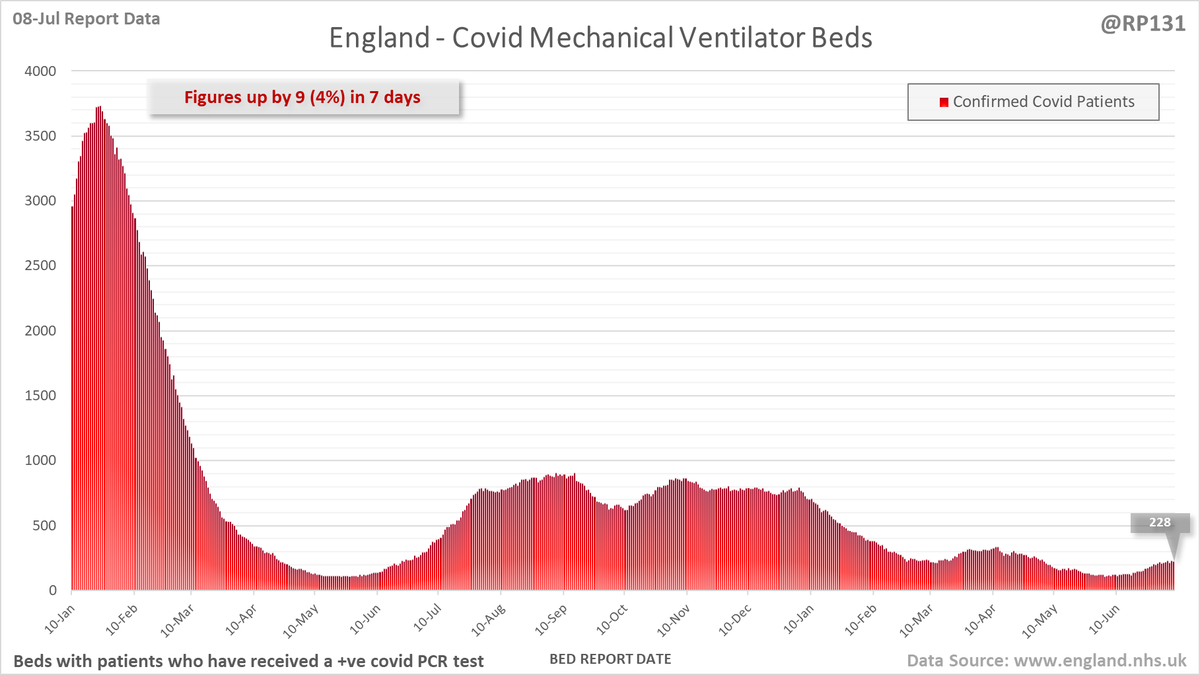
@oxyGINnT The growth rate of covid positive ventilator beds has also been slowing in recent days (down from 30% a week ago to just 4% today). This is also a promising sign that the peak is near. I would just ignore the doom-mongers and accept this will just repeat repeat ad infinitum.
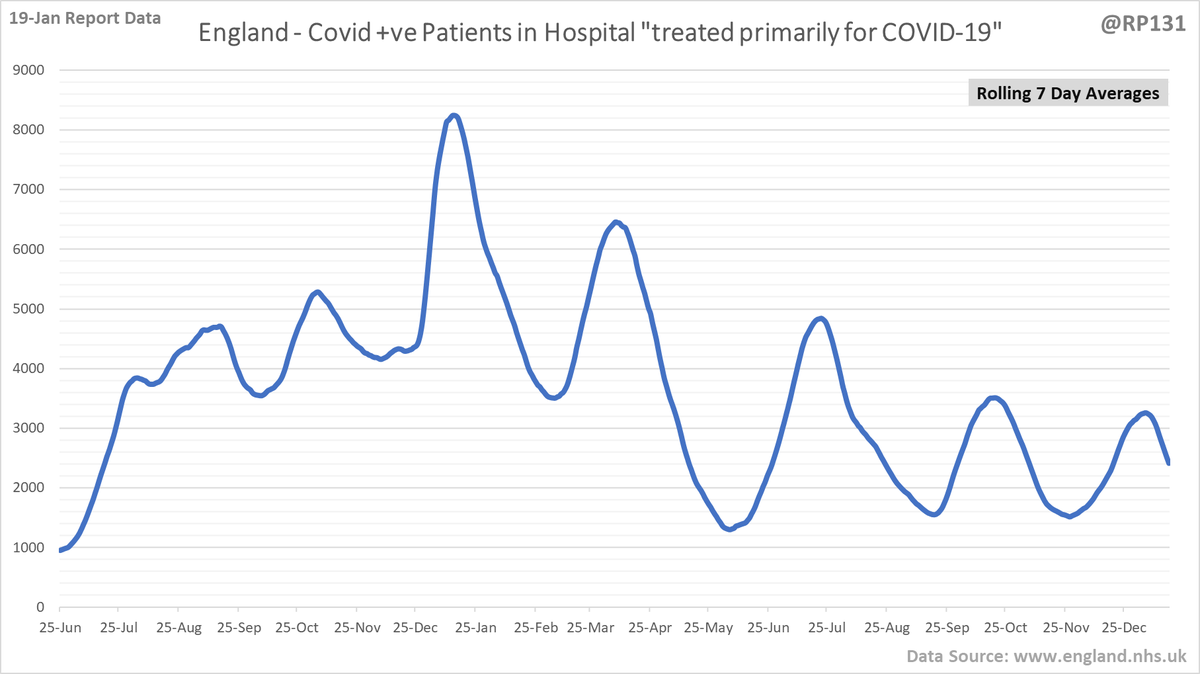
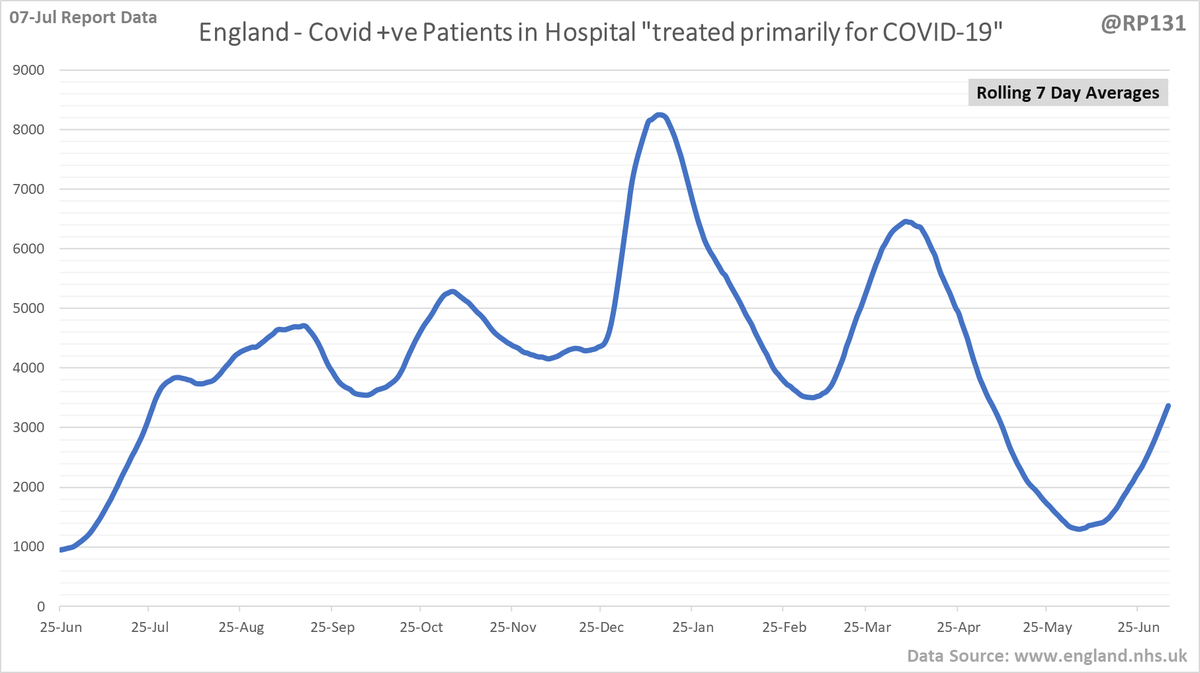
@oxyGINnT With the massive reduction in testing, I would just pay attention to real covid patients in hospital. This shows we're seeing another wave very similar to the previous one, except starting from a much lower level. No reason to think it won't peak soon with no extra restrictions.
@drjanaway@EssexPR I think this is the only chart that really matters now. Patients growing but still well under the lows of the Jan/Apr peaks. No reason to think it won't follow same pattern and peak shortly at around 4-5000. I believe all previous restrictions were gone by Apr peak time.
@AvidInquirer@PriyamvadaGopal Yes there's a new wave of covid hospital admissions. Slightly slower growth than the March wave and starting from a much lower baseline. I'm not sure I'd describe it as undeclared as all the data is readily available - just that the MSM has lost its obsession with it.
@guardian We've been to Majorca every year for the past 15 years and we won't touch Goldcar as they're absolutely notorious for this. Definitely not an isolated incident and is clearly their standard policy to push everyone to take full insurance. Record/OK generally better.
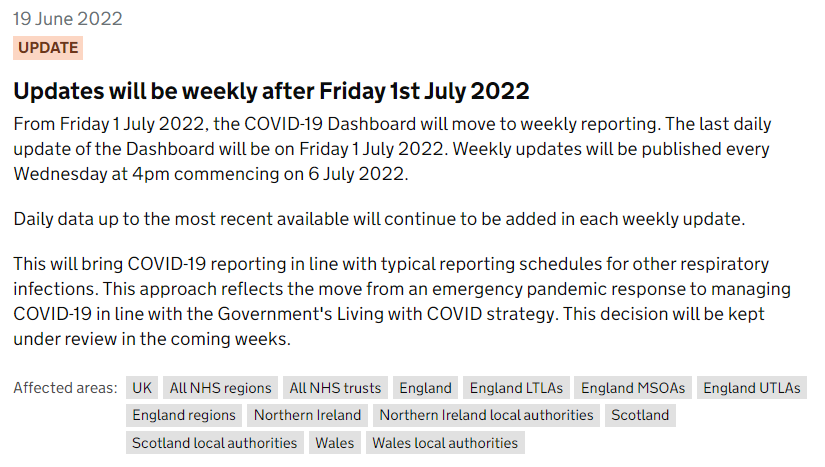
Good move from the UKHSA dashboard team and gives me an ideal point to stop running the daily update just before the summer hols. My website is down to just a few hundred people a day and I'm guessing they've seen a similar drop off in traffic.
My own work in this feed (usually indicated by the @rp131 watermark) is free for anyone to use however they wish. A link back to this account, or quote-tweet of the original will always be appreciated. And of course, there's still this:
https://t.co/irBIiUZtJ7
Pinned index post linking to a simple table of contents page to make it easier to find my normal daily posts.
As interest in this content is reducing, some threads may not be posted to twitter every day but will still be available via index page.
https://t.co/py0xxj2dIx
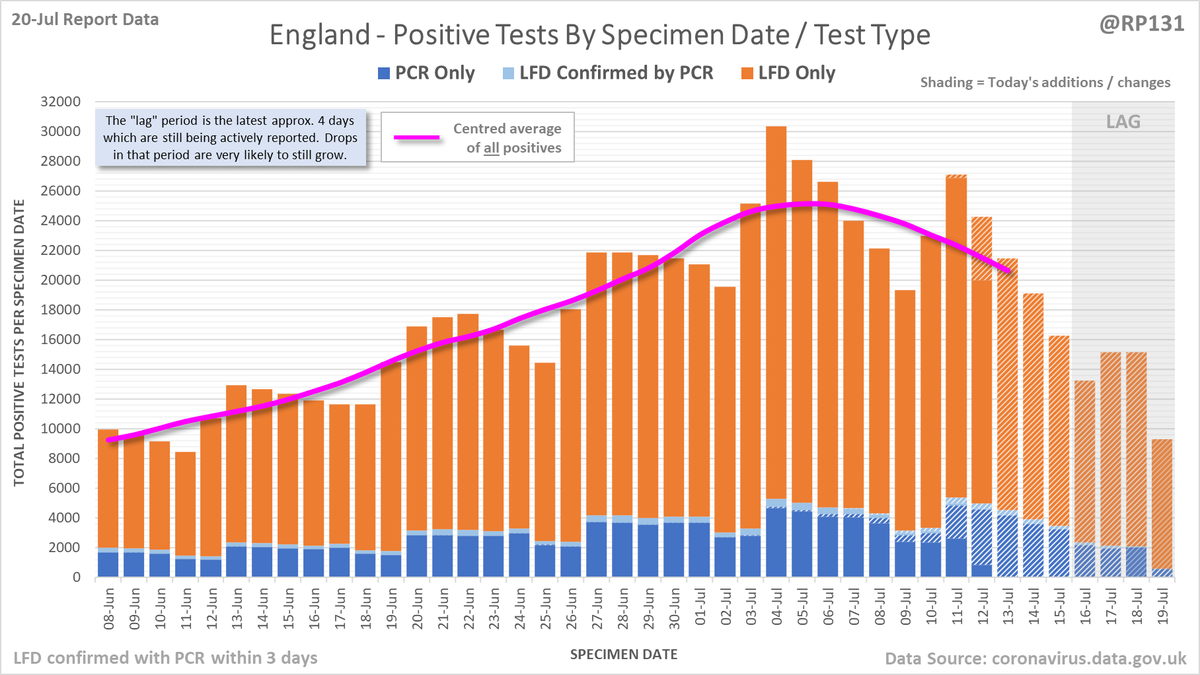
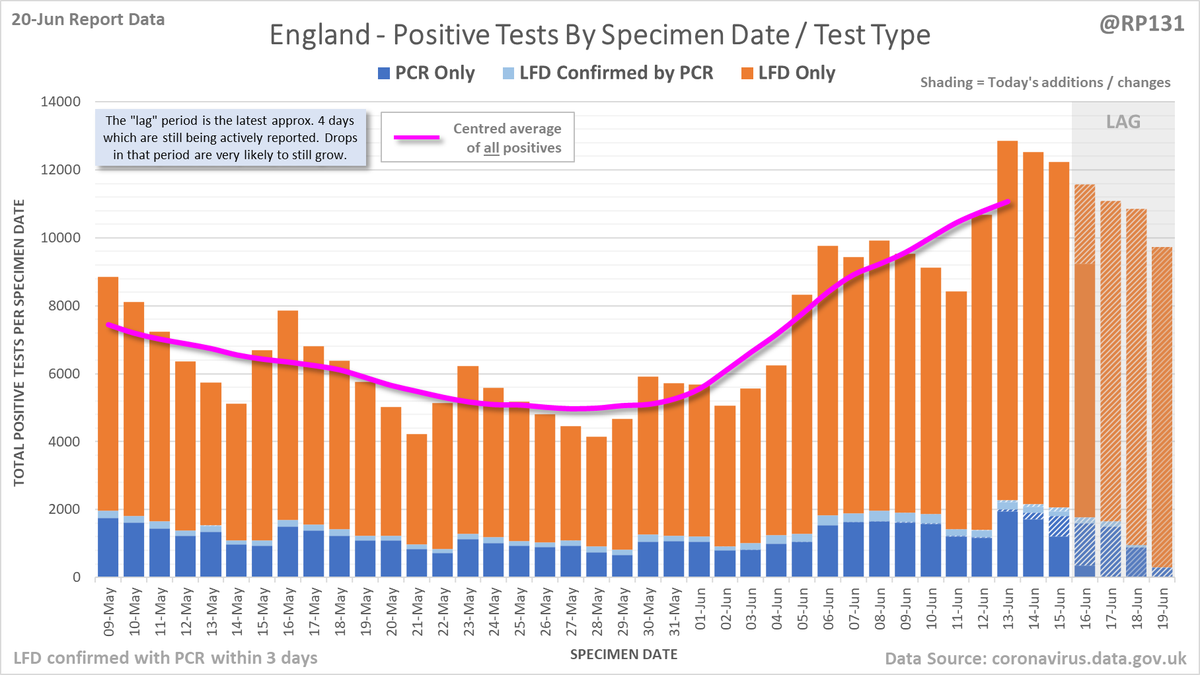
36,452 new #covid19uk positive tests reported today (20-Jun). Possibly early signs of levelling off but hard to read now as dynamics changed by most tests just being in health/care scenarios. Only posting this to twitter occasionally now so use link in pinned tweet on other days.
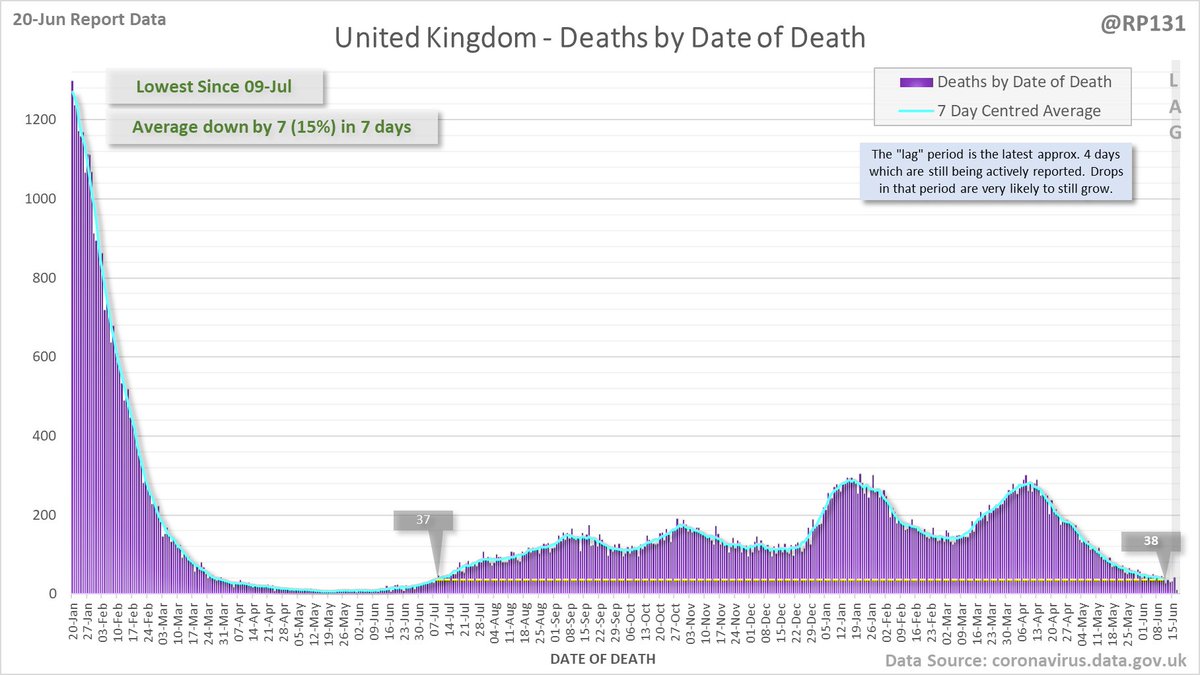
64 new #covid19uk deaths reported today (20-Jun). This brings the rolling average by date of death (allowing 4 days for lag) to 38, equivalent to around 09-Jul (i.e. 338 days ago), a reduction of 7 (15%) in the last week.
Animated chart to show how the #covid19uk deaths by date of death have been contributed to by reports over the last 7 days. Note this just includes England numbers as other nations don't always publish their date-of-death data every day.