We're rebuilding Rsquared Academy.
Interactive R courses that run in your browser, with instant feedback. The first three open soon and are free.
Free eBooks and R packages:
https://t.co/viJHzZvL5l
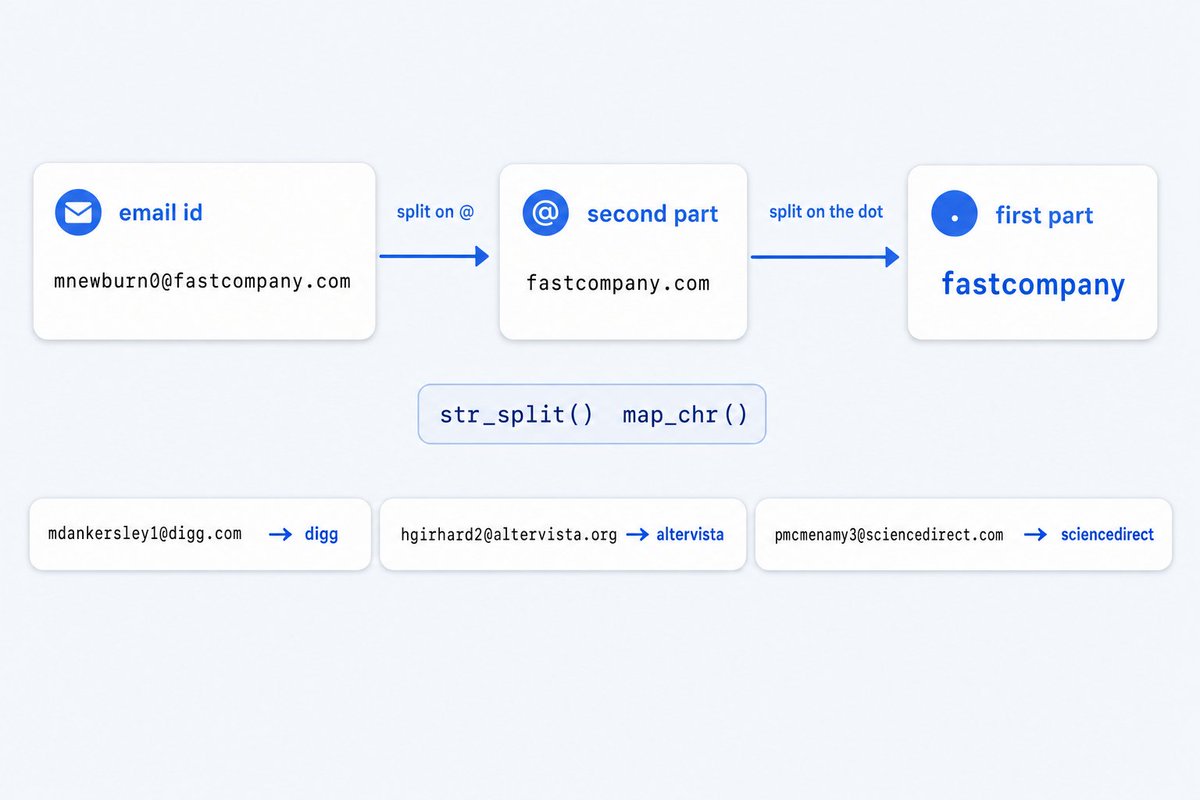
Domain names from email ids with stringr: split on @, take the second part, split on the dot, keep the first.
emails |> str_split(pattern = "@") |> map_chr(2) |> str_split(pattern = "\\.") |> map_chr(1)
https://t.co/zMIqoHIJ82
#rstats#stringr
Set the name, breaks and limits of an axis in ggplot2:
scale_x_continuous(name = "Displacement (cu. in.)", breaks = seq(100, 500, by = 100))
scale_y_continuous(name = "Miles per gallon", limits = c(0, 40))
https://t.co/xhIkojhGIP
#rstats#ggplot2
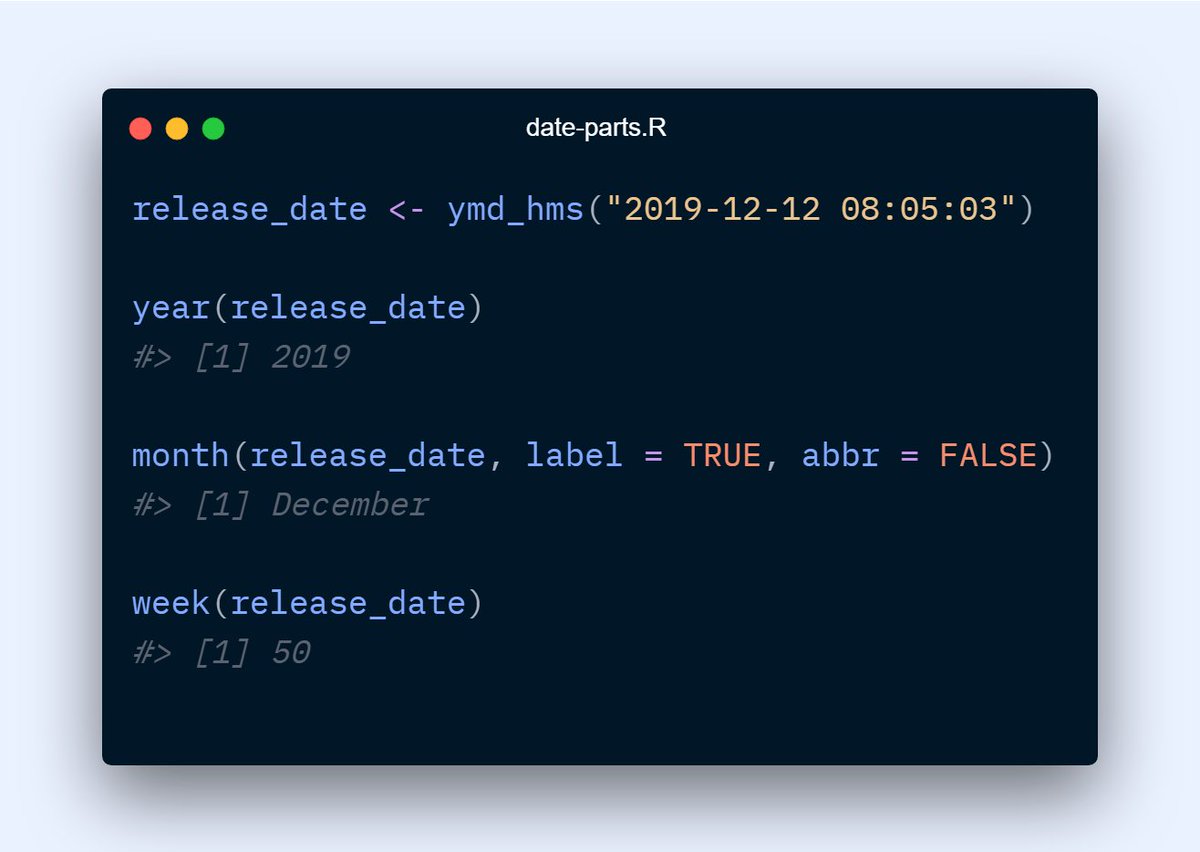
Pull the parts out of a date-time with lubridate. For ymd_hms("2019-12-12 08:05:03"), year() returns 2019, month(label = TRUE, abbr = FALSE) returns December and week() returns 50.
https://t.co/TeVesE76SW
#rstats#lubridate
Summary statistics for a numeric variable in one call with descriptr:
ds_summary_stats(mtcarz, mpg)
Mean, median, mode, spread, skewness, kurtosis, quantiles and extreme values.
https://t.co/PQ7pZQJifG
#rstats#descriptr
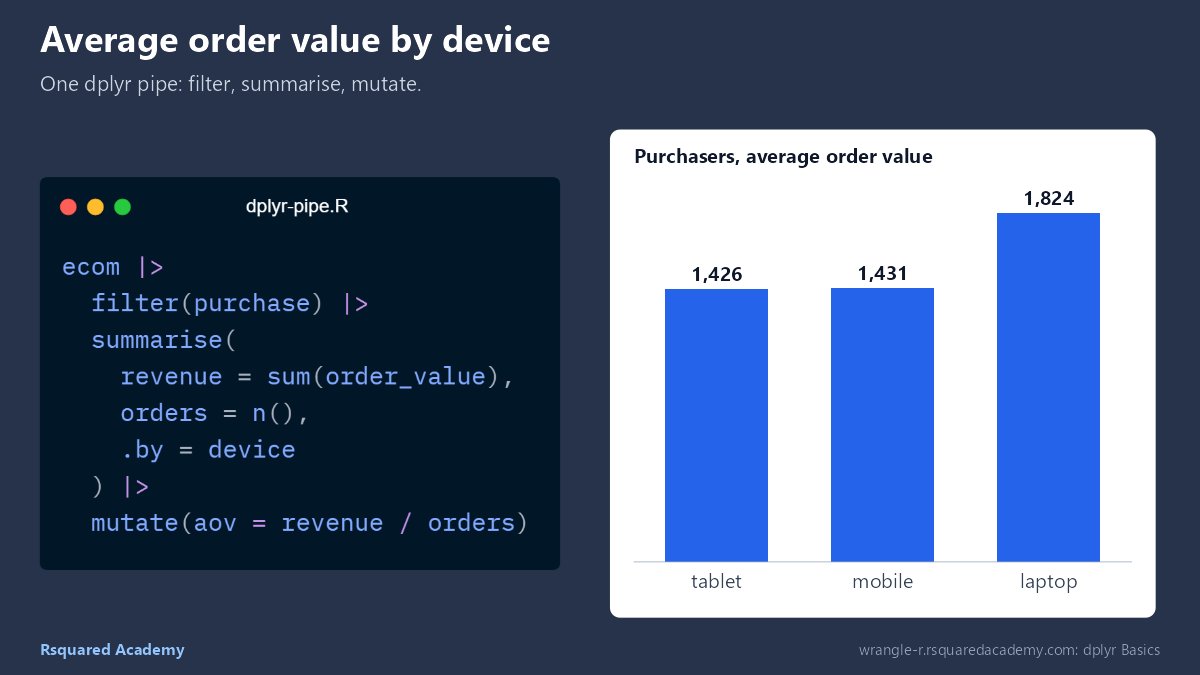
Average order value by device, in one dplyr pipe:
ecom |> filter(purchase) |> summarise(revenue = sum(order_value), orders = n(), .by = device) |> mutate(aov = revenue / orders)
https://t.co/KaGg8jbolZ
#rstats#dplyr
Happy Diwali from Rsquared Academy.
Five diyas, drawn and lit in R with ggplot2; ffmpeg joins the frames into a GIF. The code is open:
https://t.co/iaXBWujc7o
#rstats
A first look at the new Rsquared Academy courses: each lesson runs R in your browser. Write code on the page and see the result next to it, with nothing to install. The first three courses are free.
Updates by email:
https://t.co/W9JVgFVEAx
#rstats
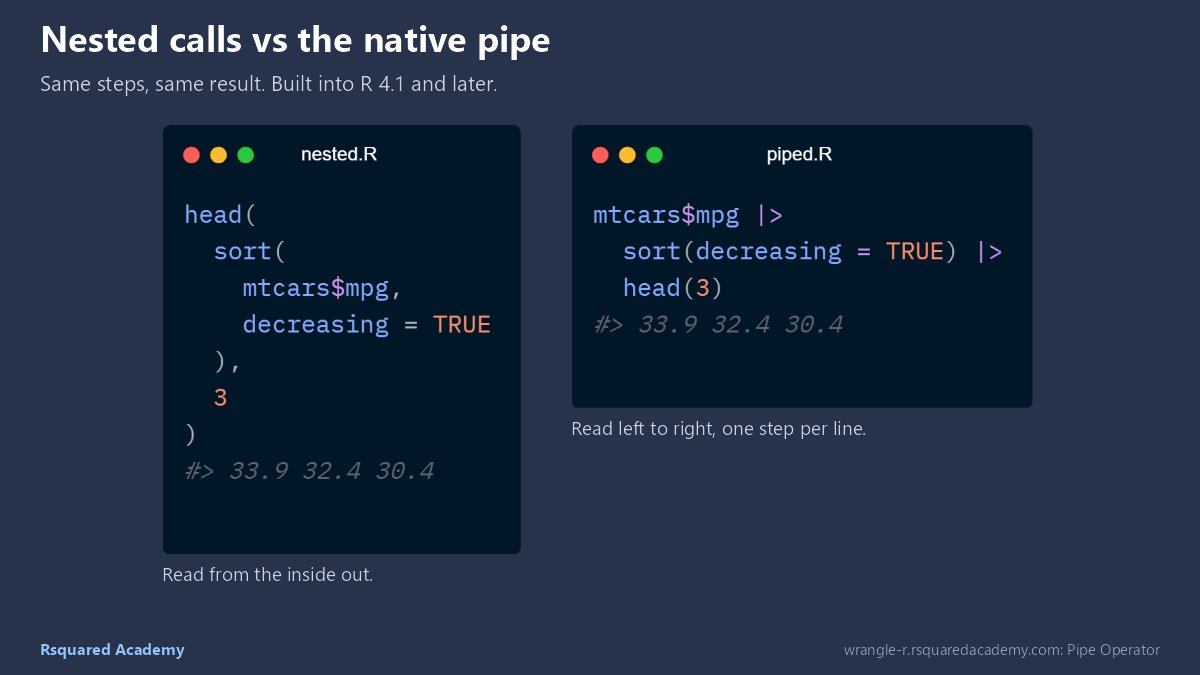
The native pipe |> writes nested R calls as steps, read left to right. It is built into R 4.1 and later:
mtcars$mpg |> sort(decreasing = TRUE) |> head(3)
The chapter includes a |> vs %>% cheat table.
https://t.co/ypI95JEXNv
#rstats
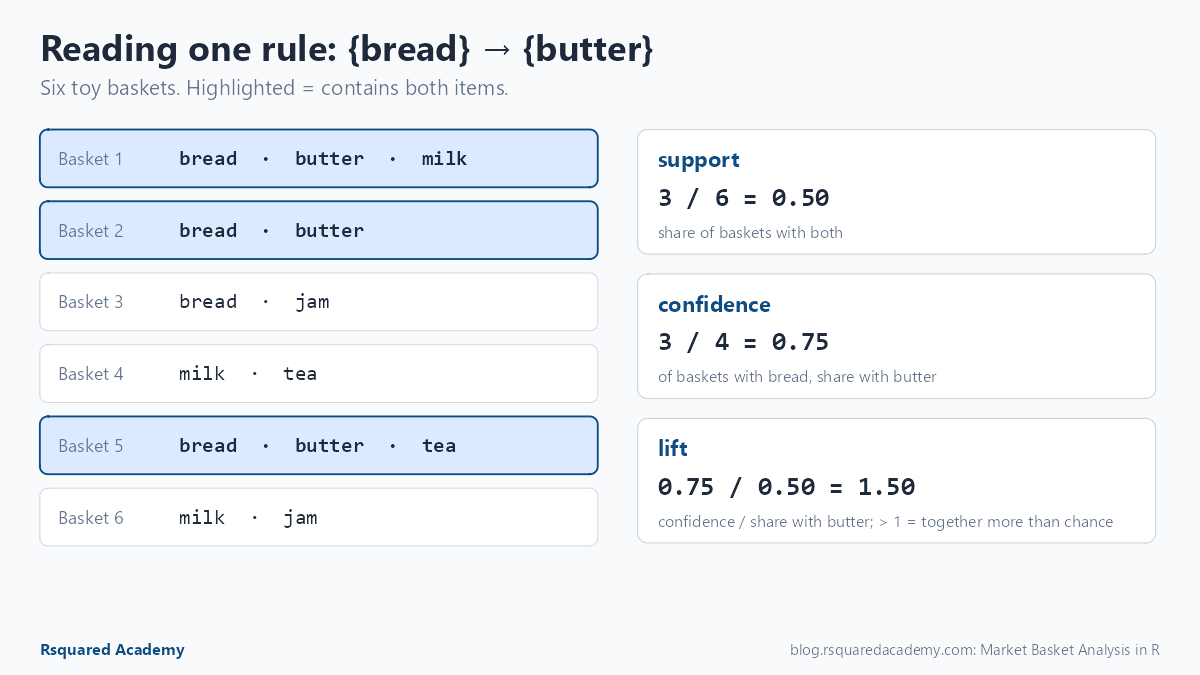
Market basket analysis finds items that are often bought together. Each rule is read through its support and lift. A walk-through with arules on the UCI online retail data:
https://t.co/lCutOy5dWP
#rstats
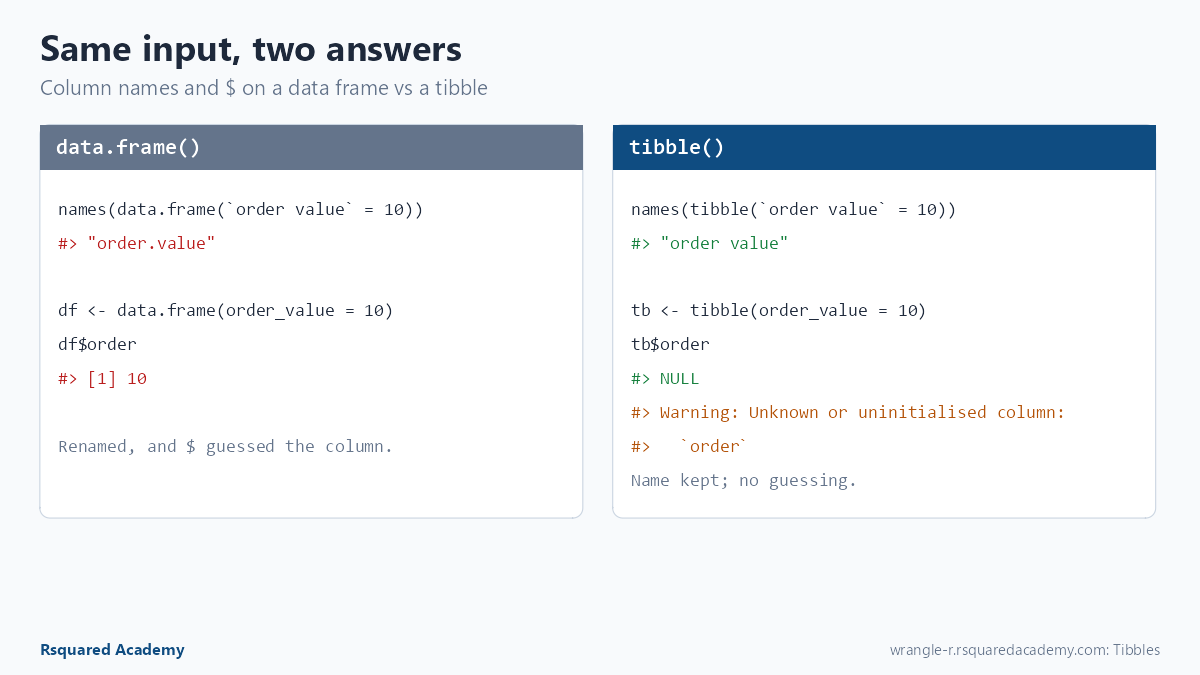
data.frame() quietly renames columns and partial-matches $:
A tibble keeps the name as typed, and t$order returns NULL with a warning.
https://t.co/5xh40QjxBi
#rstats
plot(mpg$displ, mpg$hwy) fails with "object not found"?
Base R has no mpg data (it has mtcars); mpg ships with ggplot2.
library(ggplot2)
ggplot(mpg, aes(displ, hwy)) + geom_point()
https://t.co/No3V5RbV65
#rstats#ggplot2
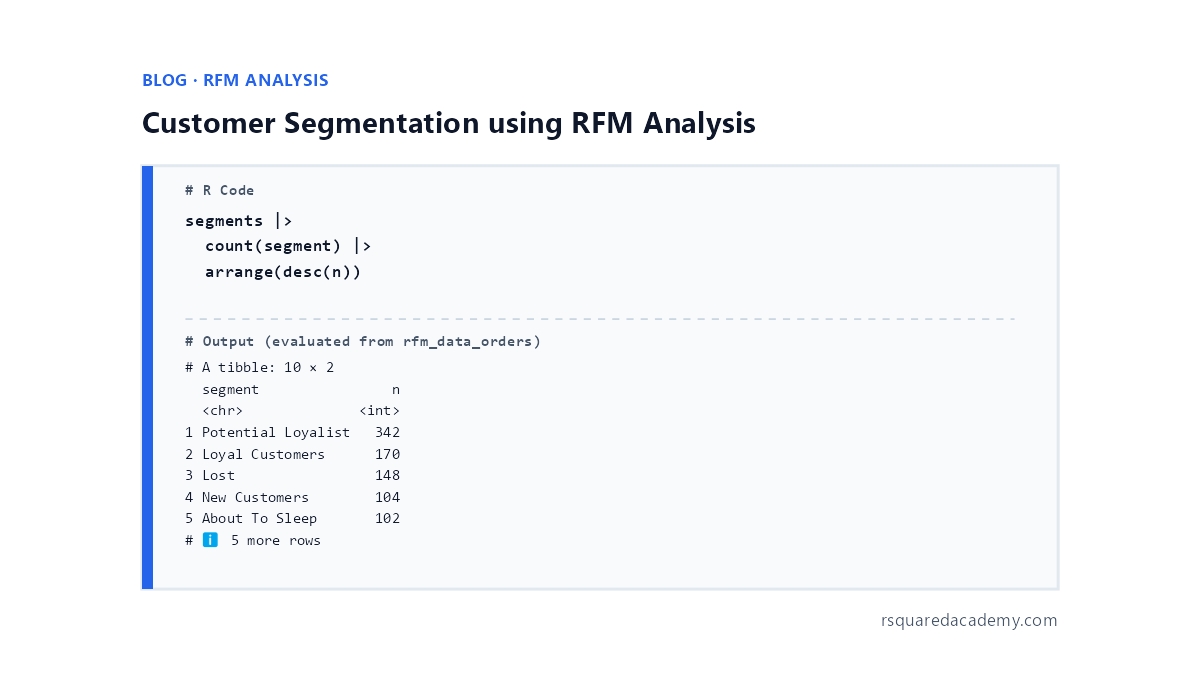
Which of your customers are champions, and which are about to drift away?
RFM analysis scores customers on Recency, Frequency and Monetary value. Our walkthrough segments them in R with the rfm package:
https://t.co/9gSuUmCUgE
#rstats
ಕನ್ನಡ ರಾಜ್ಯೋತ್ಸವದ ಶುಭಾಶಯಗಳು! Happy Kannada Rajyotsava.
The map and the flag are drawn in R: the Karnataka outline from Natural Earth, split at its middle latitude and filled yellow over red with sf and ggplot2.
Code: https://t.co/FdQxjBvLs6
#rstats#KannadaRajyotsava
Every ggplot2 chart starts the same way: map variables with aes() and add a geom_*() layer.
ggplot(mtcars, aes(disp, mpg)) + geom_point()
The Quick Tour covers scatter, bar, box and line plots.
https://t.co/loAfZP1P0k
#rstats#ggplot2
📢new #rstats📦alert 📢
yahoofinancer fetches historical and near real time data related to stocks, index and currencies from Yahoo Finance API.
Blog: https://t.co/Vi4fCmSM5H
Docs: https://t.co/ty2p9vdTou
https://t.co/XngJOD5u7A
xplorerr - Tools for interactive data exploration built using 'shiny'. Includes apps for descriptive statistics, visualizing probability distributions, inferential statistics, linear regression, logistic regression and RFM analysis. #rstats https://t.co/Wy3uBwkOvu