"My rent might go up next year"
"I am worried about oil prices"
You have views about where the world is going, and worries about what's coming. By utilizing prediction markets, Thalamus turns them into real positions, in plain language. No tickers, spreads, or expiries.
We're doing a limited release today for 1,000 users. Each user gets $10 to spend, so you can try Thalamus immediately.
https://t.co/XDtDevELYx
Vibe code your own insider-detection dashboard, whale tracker, copy-trading system, or market forensics engine on top of Polymarket. Or build something nobody's thought of yet.
We just shipped the most powerful Polymarket analytics API in existence.
Per-wallet PnL, unrealized positions, win rates, hold durations, category breakdowns, and filterable leaderboards.
Every combination of filters is a different product. Here's what you can build with one API call: 👇
We rebuilt Kiyotaka for v4.0. Still 100% free to use for all chart enjoyers.
This is the biggest product release we’ve shipped yet:
a complete redesign, major UI/UX upgrades, new search, new chart types, better tooling, faster performance, new color themes, and a much improved execution interface. With more coming next week.
But v4 is bigger than a feature drop. Kiyotaka now feels faster, clearer, and much more intentional to use.
This marks a major turning point in how Kiyotaka works and where it’s going next.
If you are still using TradingView for Hyperliquid, your users are trading half-blind.
With Percept, builders can give users full x-ray vision into Hyperliquid order flow, including real-time liquidation clusters across every perpetual asset.
Liquidation clusters for every perpetual contract, updated in real time. Up and running in 30 seconds.
Proud to power the charting and market data infrastructure behind @tread_fi.
Too many teams building trading products spend months reinventing charting libraries, indicators, and data pipelines. That’s time that should be spent building what actually differentiates your platform.
Percept exists so teams can skip that entire layer.
Enterprise-grade charts, indicators, and market data integrated in minutes so you can focus entirely on your core product.
If you're building a trading product and want to get set up in minutes, reach out.
Percept (@percept_labs) x https://t.co/O9psm31Fwk (@tread_fi)
We are excited to announce our partnership with Percept! As we move towards improving the overall terminal experience on https://t.co/jJft86JSsB, we will be migrating all charts to Percept.
Users can expect unparalleled advanced indicators and a smooth, native integration that comes from a close partnership with the Percept team.
Highlights of some features 🧵
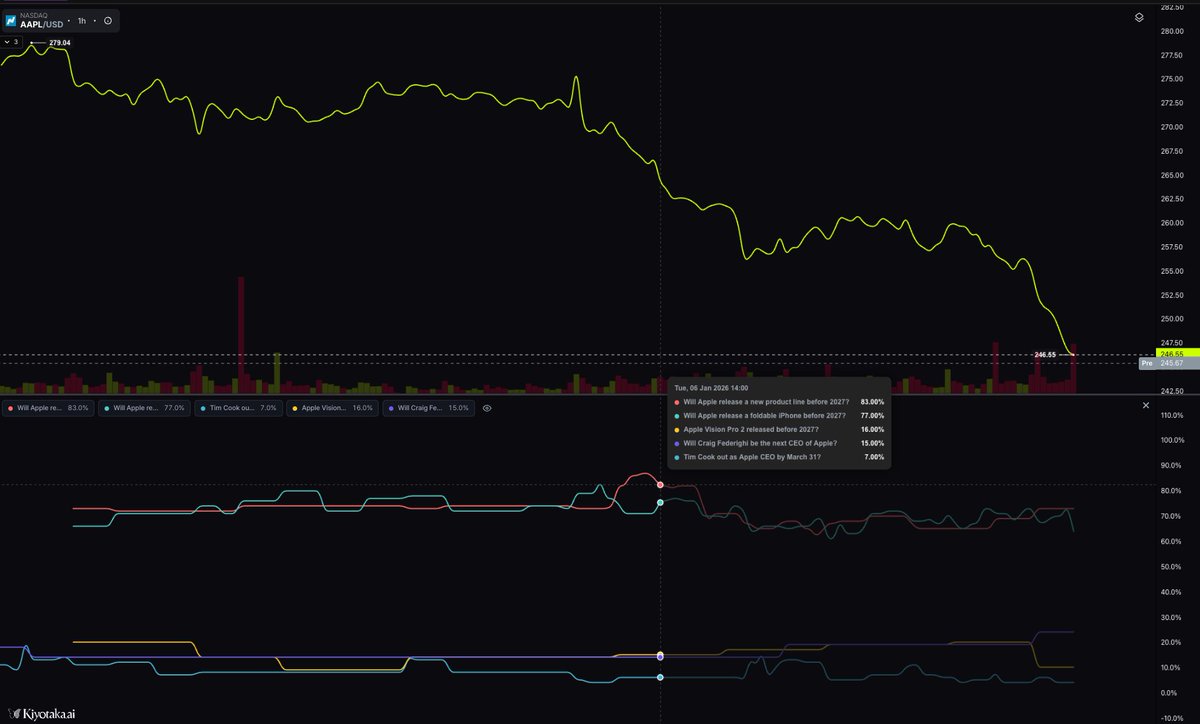
Price charts show what moved. They rarely show why.
Today we’re launching Impact Events, a new way to view prices through the events that actually drive them, each tracked with live probability odds.
• Apple → foldable iPhone launches, Vision Pro follow-ups, CEO succession risk
• Bitcoin → nation-state adoption, corporate treasury adoption, protocol-level changes
This is powerful because markets don’t move on candles. They move on changing expectations. We map the most important event probabilities directly onto assets, giving price action real context.
We’re releasing Polymarket Discovery today.
With Discovery, you can see total volume and everything flowing through Polymarket in real time.
Location-linked trades light up on the world grid so you can see where attention and capital are moving as it happens.
You can also filter markets by category, expiration date, volume, price, or launch date to cut through noise and surface real activity faster.
Introducing Timeline, a new way to see the why behind price movements, not just the how.
Timeline overlays the most relevant market-moving headlines directly on your charts, so price action always comes with context.
Below, you’re looking at Trump’s Fed Chair pick odds, with each reprice mapped to the specific headlines that drove it.
This helps you clearly see when narratives shift and how the market responds.
We’re excited to launch a completely new way to see prediction markets.
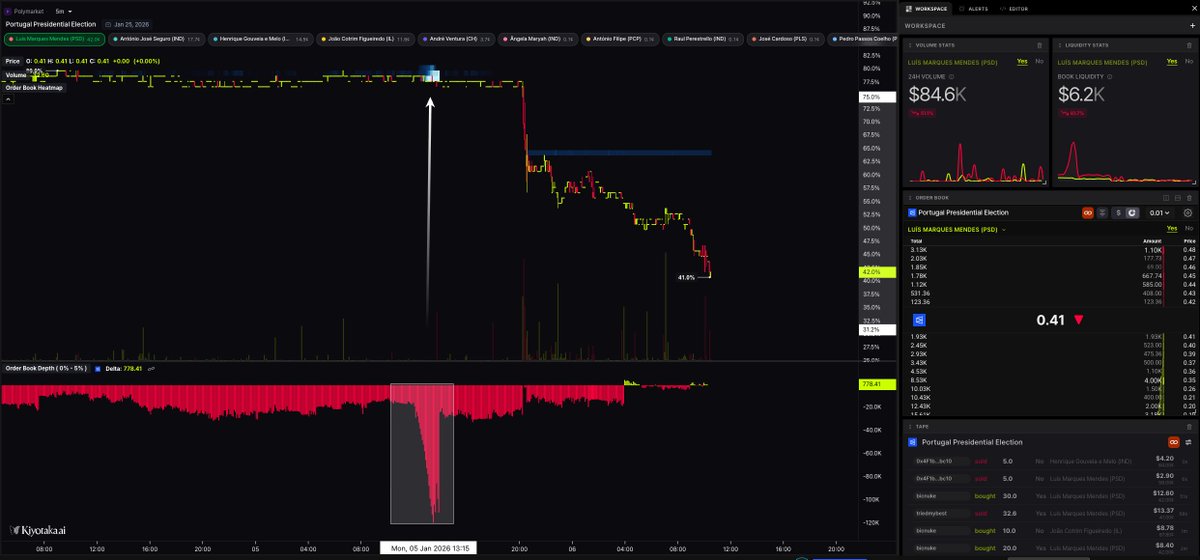
Today we’re rolling out a complete trading stack for prediction markets, from visualization to execution. This unlocks a fundamentally different way to see how money positions before odds move.
Here’s what that looks like in real time: a large sell wall appears in the Portugal Presidential Election market hours before the odds moved down sharply.
Update for our order flow traders 🩸
– Added Delta mode for VPVR
– New Hollow Candle + Area visualizations
– Gradient footprints for better delta depth perception
– Custom POC / VAH / VAL colors
– Naked POC extensions now supported on SVP & VPVR
New TPO Updates
30-minute timeframes are now live on Kiyotaka, giving you cleaner intraday structure.
TPO merging is also here — combine sessions into one composite profile for deeper market context.
September was a brutal month for crypto bulls, with billions in liquidations.
Despite $BTC having a much larger market cap, $ETH degens took more pain.
The flippening nobody wanted.
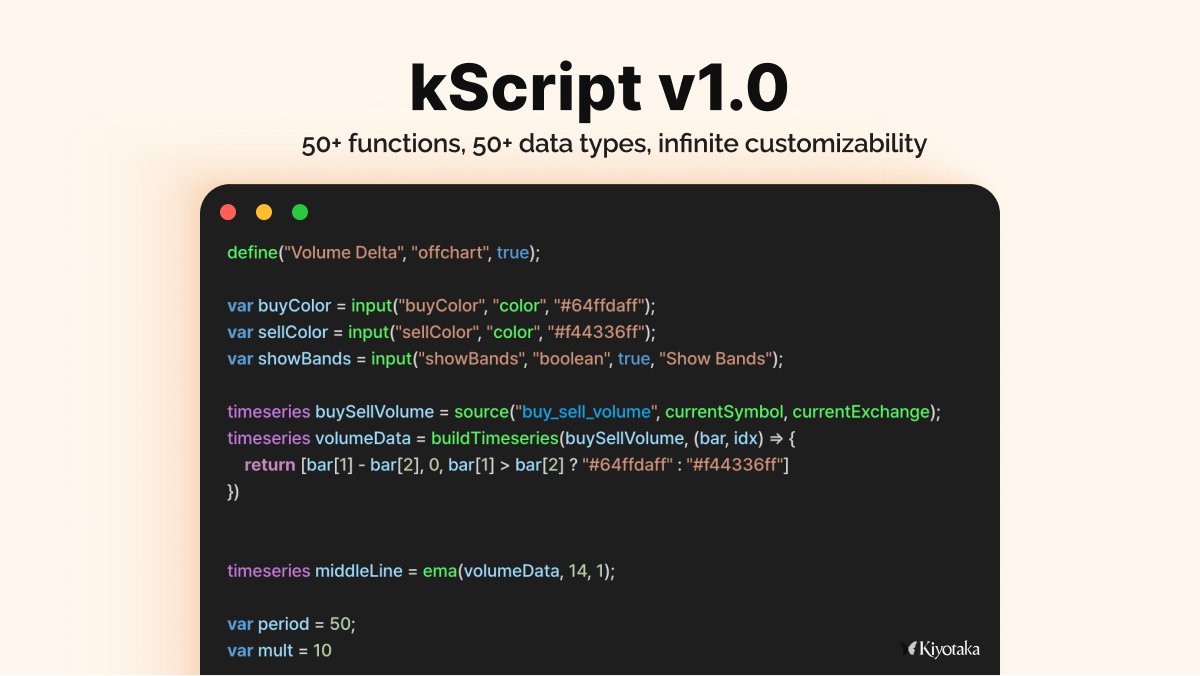
Introducing kScript - our new scripting language built for traders
Faster, richer, and designed for the next generation, kScript lets you tap into our full market data and build custom indicators from day one.
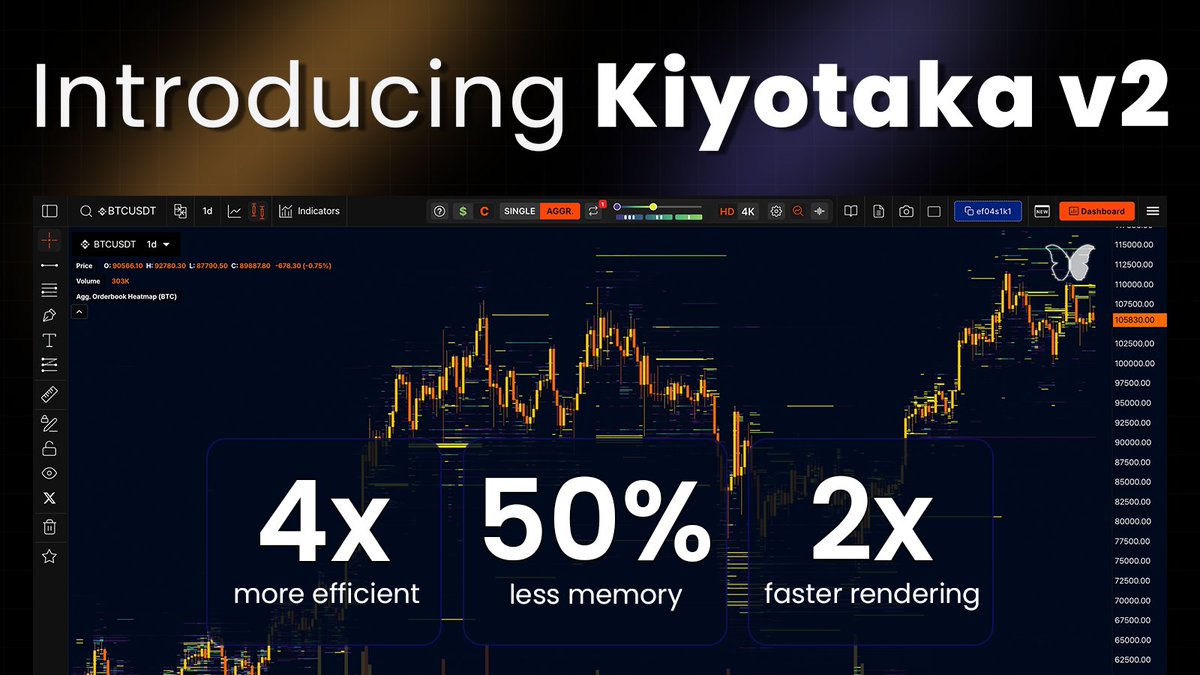
Introducing Kiyotaka v2 — Now THE most lightweight order book charting application
4x more efficient, 60% smaller memory footprint, 2x faster rendering
It's time for a #Starfield giveaway! 👀
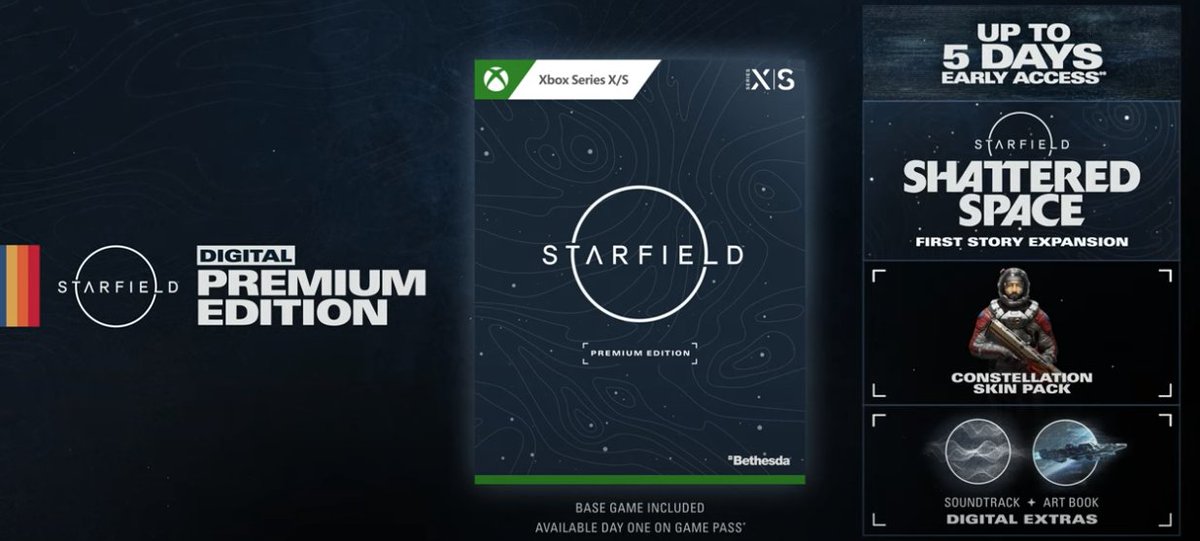
We're giving away 2 copies of #Starfield Digital Premium Edition (with 5 days early access) on either Xbox or PC!
All it takes to enter is to either RT this tweet or like it!
Winners will be picked on June 24!
🚀🚀