The Barrel Shortage Is Only The Beginning
Markets are treating Hormuz like a temporary oil spike. That is the mistake. The real danger is not only the missing barrels. It is the lag between the first disruption and when the full effects are finally felt across global economies.
Goldman estimates Gulf crude production is down 14.5 mb/d, or 57% below prewar levels. Only 11.0 mb/d is still producing out of a 25.4 mb/d baseline. That means roughly 435 million barrels are missing every month before mitigation. If the shortfall math is right, the cumulative gap reaches about 1.631 billion barrels even if the conflict stopped on April 24.
Reopening Is Not Normalization
Reopening the Strait does not instantly refill inventories, reposition tankers, normalize insurance, repair infrastructure, rebuild workover capacity, or bring shut in wells back to prior flow rates.
External forecasts assume only 70% of lost Gulf production is recovered after 3 months and 88% after 6 months. On a 14.5 mb/d loss, that still leaves 4.35 mb/d missing after 3 months and 1.74 mb/d missing after 6 months.
The Transmission Takes Time
Hormuz normally moves about 20 mb/d of crude and refined products, roughly 25% of world seaborne oil trade. Bypass capacity is only 3.5 to 5.5 mb/d, covering just 24% to 38% of the current curtailment.
The remaining 9 to 11 mb/d clears through higher prices, inventory draws, refinery cuts, demand destruction, rationing, bankruptcies, or state intervention.
First crude moves. Then diesel and freight. Then food, fertilizer, chemicals, packaging, plastics, utilities, insurance, and construction materials. Then household cash flow weakens. Then small businesses fail. Then CRE gets repriced. Then banks tighten. Then unemployment rises.
It Hits An Economy Already Cracking
The U.S. may not import much Gulf crude directly, but it still imports the global oil price through diesel, freight, fertilizer, plastics, insurance, utilities, and food distribution.
Households were already stretched. Delinquencies are near 4.8%. Credit card 90 day delinquencies are near 2.57%. Auto serious delinquencies are around 1.54% to 1.61%. Student loan delinquencies are near 25%.
A $1 gasoline increase costs a commuter household using 1,000 to 1,500 gallons a year an extra $1,000 to $1,500. That money no longer goes to restaurants, retail, travel, home improvement, or debt payments.
Small business was already cracking too. Subchapter V filings are up 67%. Commercial Chapter 11 filings are up 37%. Higher fuel, freight, utilities, packaging, insurance, and inventory costs turn margin pressure into insolvency.
CRE is the second fuse. Office vacancy is around 17.6% to 17.8%, with some major tech hubs above 30%. Roughly $875B of commercial mortgage debt matures in 2026. Borrowers who financed at 3.5% now face 6.5% to 7.5%.
How Inflation Turns Deflationary
The first phase looks inflationary because fuel, food, freight, insurance, and utilities rise. The second phase is deflationary because cash flow collapses.
Households spend more on necessities and less everywhere else. Businesses pay more for inputs while customers pull back. Margins compress. Defaults rise. Banks tighten. Credit card issuers cut limits. CRE lenders refuse to roll bad debt. Private credit pulls back. Asset sales begin.
That is how a price shock becomes a credit contraction. Expensive food, fuel, and insurance can exist alongside falling asset prices. That is not healthy inflation. That is insolvency pressure.
My Take
This shock does not create the recession mechanism. The mechanism already exists. It compresses the timeline.
A 3 to 6 month disruption hits consumers and small businesses. A 6 to 12 month disruption hits CRE, banks, and credit. A 12 to 24 month disruption forces structural changes in trade routes, energy security, dollar liquidity, defense planning, and politics.
People will see the oil spike first. The real danger arrives later after the buffers are gone.
🚨The US white-collar RECESSION is getting worse:
Job openings in the professional and business services sector fell to ~4.0 per 100 employees, the lowest since the 2020 CRISIS.
This is down from a peak of ~10 in 2022, a drop of nearly -60%.
The rate is now below pre-pandemic levels seen in 2019, when the labor market was considered resilient,
Professional and business services include consulting, legal, technology, and finance sectors that typically lead broader labor market trends.
When white-collar hiring slows this sharply, the rest of the job market usually follows.
Expect more weakness in the US job market.
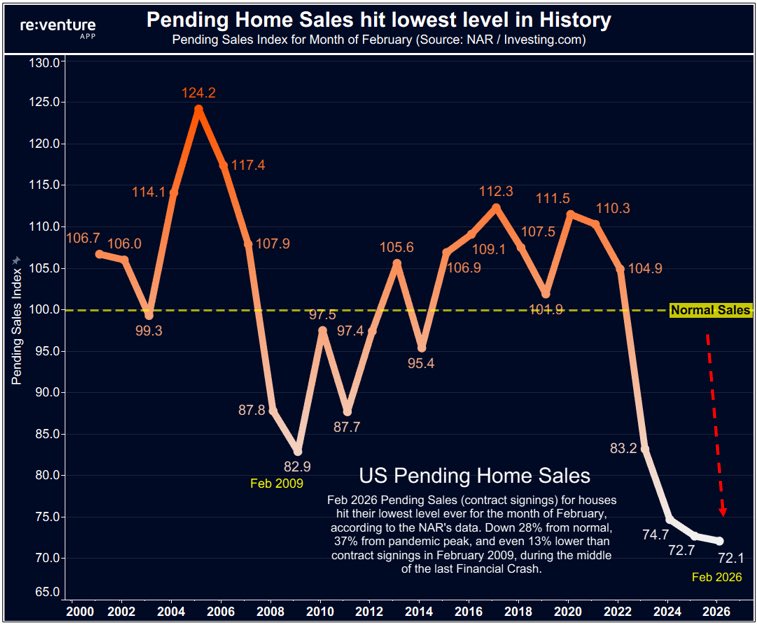
The Housing Freeze Before the Price Reset
Pending home sales rose 1.8% from January to February, but the index only reached 72.1, the weakest February reading in the series. Existing home sales also rose 1.7% from January to a 4.09 million annualized pace, but were still down from a year earlier. So the chart is pointing down for a reason. It compares February against prior Februaries, and February 2026 was the worst one on record. This was not a spring breakout. It was a dead market trying to bounce off a historic low base.
A Transaction Recession
The clearest way to describe the last 12 months is a transaction recession. Existing home sales totaled about 4.06 million in 2024, the weakest full year since 1995, and early 2026 is still hovering near that same floor. The problem is worse than that comparison suggests because the country is far larger now than it was in the mid 1990s. There are more households, more workers, and more underlying housing demand, yet turnover is still stuck at levels that belong to a much smaller economy.
Why Sales Have Been So Weak
Housing is trapped between high financing costs and the lock in effect. Buyers are squeezed by mortgage rates near 6%, while existing owners do not want to give up the 2% to 3% mortgages they locked in earlier in the cycle. Even small rate moves matter at current price levels because they quickly destroy affordability for marginal buyers. At the same time, supply is still too tight to force a true clearing event. Inventory remains limited, months of supply is still below a balanced market, and prices have not fallen enough to reopen normal turnover. That is the dysfunction. Sales have been historically weak, but prices have not fully reset because too many owners can still afford to wait.
Why New Supply Has Not Solved It
New construction has helped at the margin, but not enough to break the freeze. Builders are still dealing with high financing costs, expensive land, labor constraints, and buyers who keep stepping back whenever mortgage rates move higher. That is why the market keeps repeating the same pattern. Rates dip, activity improves a little, people call a bottom, then rates rise and demand stalls again. These are not signs of a durable recovery. They are signs of a market that can produce small percentage rebounds without fixing the underlying structure.
What Resets Prices
My view is that mortgage rates froze the market, but unemployment will reset it. Housing usually does not break nationally just because buyers want lower prices. It breaks when sellers lose the ability to wait. That is the missing ingredient so far. Labor is softening, mortgage stress is building at the margin, and delinquencies are rising in weaker segments, but not yet enough to force broad liquidation. If unemployment rises further, the psychology changes fast. The lock in effect stops acting like a floor and starts acting like a trap. Listings rise for the wrong reason, price cuts stop being optional, and a frozen market becomes a clearing market.
The Bigger Meaning
That is why housing matters so much for the broader U.S. economy. It sits at the center of consumer confidence, bank credit, construction, renovation, and household wealth. Right now it is acting less like a growth engine and more like a brake. Sales have already been historically weak for more than a year. Mortgage rates kept buyers out and sellers locked in. The labor market is the variable that likely determines whether housing stays frozen or finally reprices lower.
In the long history of Japan's FX interventions, they've never worked. Not once. So no surprise that - after the NY Fed's "rate check" in January - the Yen has fallen back to its lows vs USD. The Yen can't rise as long as JGB yields are artificially low...
https://t.co/hmsHXJ5tPl
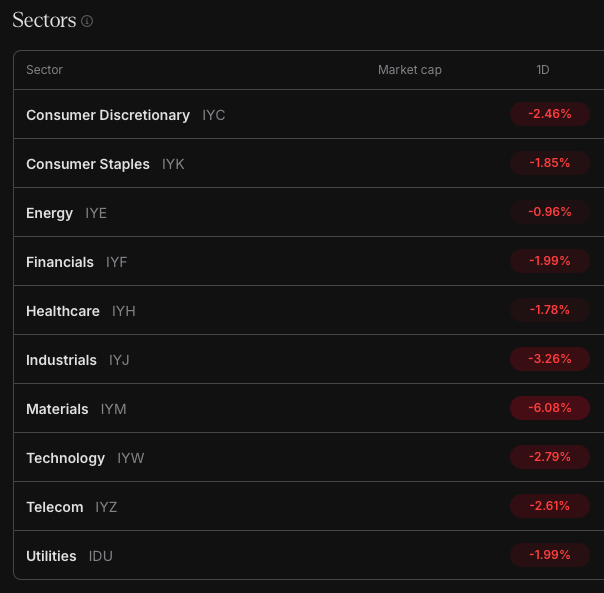
What a difference a day makes...
Every single sector is down
Industrials and materials getting hammered due to the disruptions from the war and consequent supply chain disruptions
Materials down 6% & Industrials down 3.2%
Energy with some relative strength w/ WTI up 8%
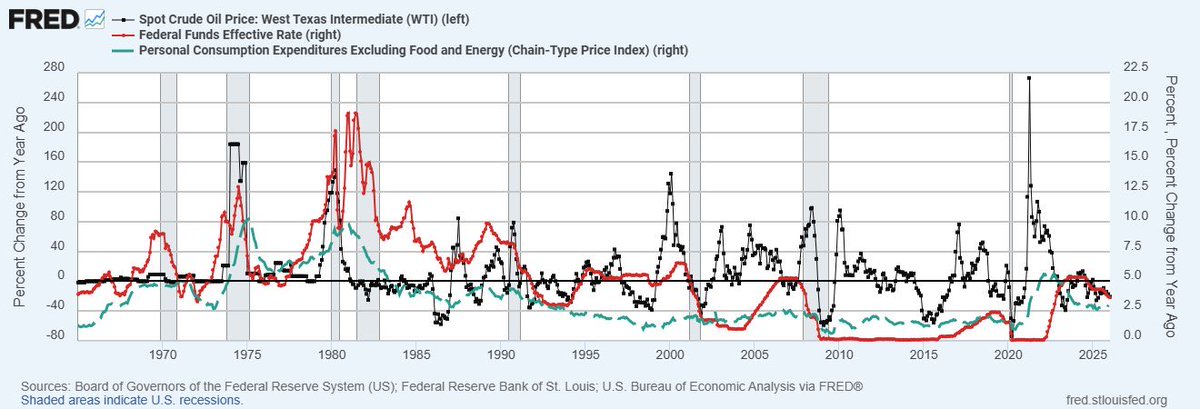
When Oil Stays High And The Labor Market Blinks
The pattern is not simply oil spikes and the Fed hikes. An oil shock acts like a tax on growth, but it usually gets treated as an inflation problem first. If policy stays tight while that tax hits the economy, recession risk rises fast.
You can see it over and over…
• Oil spikes first.
• Core inflation responds with a lag, because energy works its way into freight, materials, services, and expectations.
• The funds rate either rises into the shock or stays too high for too long.
• Then the economy breaks somewhere else… and oil collapses after the damage is already done.
The Dangerous Part
The danger is not oil rising by itself. The danger is oil rising while policy is already restrictive and stays that way. That is how a shock gets compounded.
Core inflation is not insulated from energy. Even if the Fed tries to look past oil, businesses cannot. Higher energy feeds into transport, materials like plastics and chemicals, insurance, and inventory financing. That is why oil shocks often come with a painful second act.
How This Maps To Today
Right now the Iran backdrop is exactly the kind of catalyst that creates a policy trap. Even if physical supply isn’t permanently destroyed, the risk premium alone can tighten conditions through higher energy costs, higher shipping and insurance costs, and higher uncertainty.
That matters because the economy doesn’t need a collapse to get weaker. It just needs margins to compress and confidence to wobble while financing stays expensive.
What I Think The Fed Does
The Fed will treat this as a policy trap rather than a clean inflation rebound. They are unlikely to hike into an oil shock because the economy is already sensitive to rates. With delinquencies rising, commercial real estate fragile, and refinancing pressure building, tightening further would risk turning a cost shock into a credit event. At the same time, they will not be quick to ease if energy stays elevated. They will keep the message focused on inflation credibility and patience to avoid unanchoring expectations.
So the playbook is hawkish talk with cautious action. They hold the policy rate steady, watch the second order effects, and try not to compound the shock. If stress shows up in funding markets or credit, they respond first with liquidity and stability tools and balance sheet adjustments rather than a large immediate shift in rates. If the weakness spreads into jobs and credit broadly, then the stance changes because the data forces it.
The Historical Lesson
The historical mistake isn’t that the Fed reacts. It’s that it often reacts late, and then reverses later. Oil shocks are messy because they are both inflationary and recessionary. If the Fed leans too hard into the inflation side while the growth side is already cracking, the recession becomes policy made even if the oil spike was temporary.
The signal is straightforward. If the oil risk premium stays elevated while growth indicators weaken and the labor market stops absorbing shocks, the historical pattern in this chart becomes the most dangerous one.
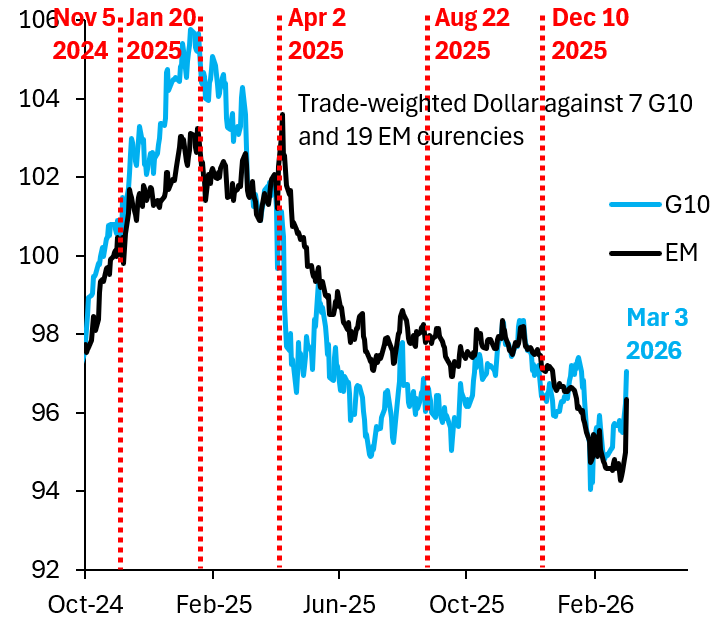
The Dollar is going vertical against the G10 and EM. This kind of spike has the potential to be highly disruptive. EM central banks will be intervening to stop their currencies from falling and will be selling Treasuries. That's bad for the basis trade...
https://t.co/gwV638KfDr
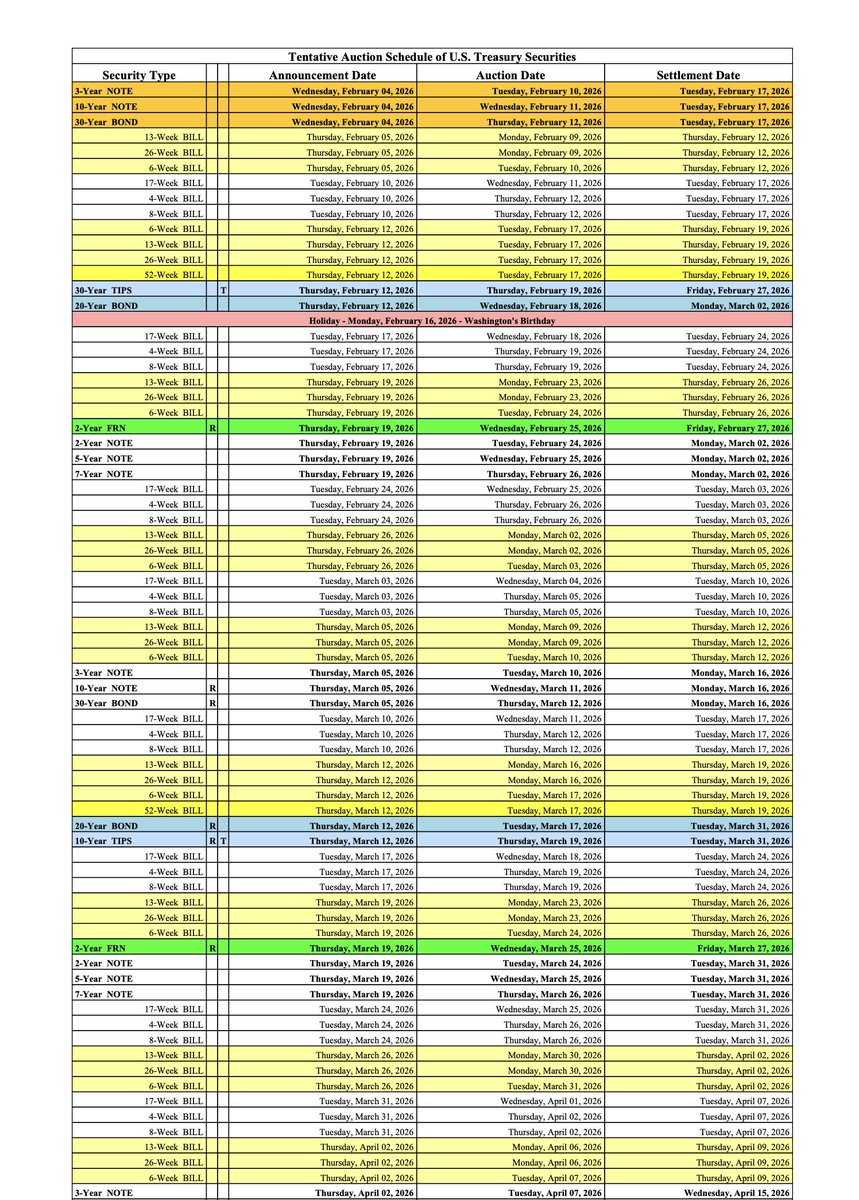
(revision) US Treasury TBill Auction Schedule totals ~$12.2 trillion short term liquidity to be issued.
122 distinct T-Bill auctions in this schedule.
The Tentative Auction Schedule PDF (the current version as of February 2026, covering auctions primarily from early February 2026 through early August 2026, roughly a 6-7 month horizon) includes the following distinct Treasury Bill (T-Bill) auctions, based on the listed auction dates per tenor:
4-Week Bill: 20 auctions
6-Week Bill: 16 auctions
8-Week Bill: 20 auctions
13-Week Bill: 20 auctions
17-Week Bill: 20 auctions
26-Week Bill: 20 auctions
52-Week Bill: 6 auctions
(Short-term T-Bills are generally auctioned weekly, while 52-week are roughly monthly/every 4 weeks. Counts are tentative and may shift slightly for holidays, but no major omissions are noted.)Auction sizes vary by tenor and aren't uniform ~$100 billion each—recent actual/typical sizes (from 2025–2026 data) are more like:4-week, 6-week, 8-week: Often $90–$110 billion (e.g., recent 4-week at up to $110B record, others commonly $95B)
13-week: Around $80–$90 billion (e.g., recent ~$89B)
17-week: Historically lower when introduced (~$30–$40B), but now aligned closer to benchmarks, often $60–$90B range in practice
26-week: Similar to 13-week, ~$80–$90B or higher
52-week: Typically lower, often $40–$60B or so (less frequent, so sized accordingly)
Using approximation of ~$100 billion per auction across the board (a reasonable rough average for many short-term tenors in the current environment, though it overstates some longer ones slightly):Total gross amount auctioned in T-Bills over this schedule ≈ 122 auctions × $100 billion = $12.2 trillion
https://t.co/4lgOueEFxG
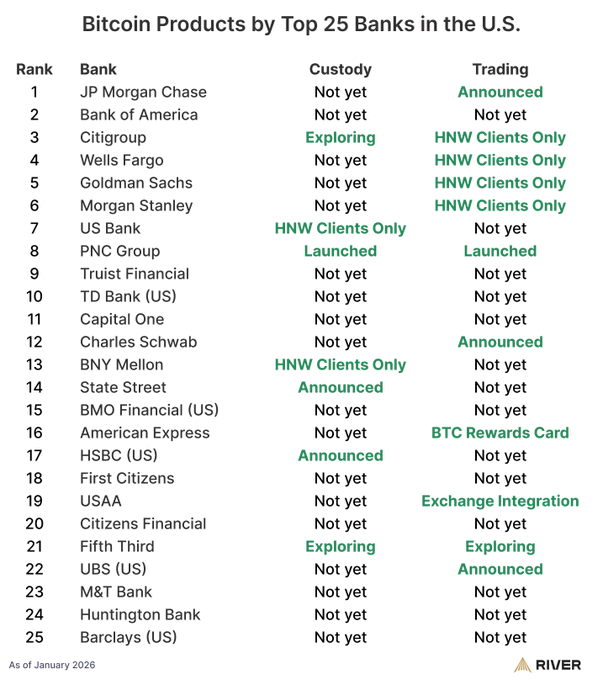
60% of the top 25 U.S. banks are now building Bitcoin products.
JP Morgan, Charles Schwab, and UBS have announced trading. State Street and HSBC have announced custody.
The regulatory green light has been given.
Silver went from $2T to $6.5T in months.
Gold rose $15T in a year.
Parabolic repricing can still occur for multi-trillion-dollar assets.
Bitcoin's supply is tighter than both.
[Presented by @JoinHorizon]
Signs Are Everywhere…The Quiet Slide From Disinflation to Deflation Risk
This charts shows cooling price pressure alongside rising labor market slack, a mix that often precedes deflation risk if demand weakens further and credit tightens.
First Understand What You’re Looking At
The blue line is labeled “True Unemployment Rate,” but it’s not the official U-3 unemployment rate you see in headlines. It’s a broader underutilization concept that sits in the 20s by design. So you don’t interpret the level like 23% unemployment. You interpret it like a pressure gauge..is slack building or shrinking?
And in this chart, slack is building from 2022 into 2025.
The orange line is Truflation’s CPI estimate. It’s showing inflation falling sharply from the 2022 spike down toward 1% YoY. That’s not deflation yet in the strict sense. It’s disinflation..inflation slowing and drifting closer to the doorstep of deflation.
The Difference Between Good Disinflation And Bad Disinflation
People cheer falling inflation prints because they feel like relief with lower costs, lower rates, easier life. But why inflation is falling matters more than the number itself…
• If inflation falls because supply chains heal and productivity improves, that’s usually good news.
• If inflation falls because demand is fading with consumers trading down, credit tightening, companies cutting prices to protect volume then that can be the early warning sign of a weaker cycle.
This chart is hinting at the second version where cooler prices arriving alongside rising slack.
How A Deflationary Cycle Actually Starts
A true deflation spiral isn’t usually a headline event. It’s a feedback loop…
• demand cools
• profits and cash flows weaken
• hiring slows and layoffs rise at the margin
• credit tightens
• demand cools again
That’s the kind of dynamic Charles Kindleberger described in financial crises that once confidence breaks and cash flows weaken, the system can shift from growth to contraction through reinforcing loops. You don’t need everyone to panic at once. You just need enough households and businesses to get defensive at the same time.
Why Policy Can Make It Worse And The Smoot Hawley lesson
Smoot-Hawley tariffs didn’t cause the Great Depression, but it made a fragile system more fragile by triggering retaliation and shrinking global trade at the worst possible time. The key lesson isn’t that tariffs always equal inflation. It’s that when confidence is already cracking, policies that reduce trade volumes and investment appetite can worsen contraction dynamics.
Tariffs can raise prices in specific categories, yes. But they can still be deflationary overall if they hit margins, volumes, capex, and employment hard enough.
The Labor Market Piece And Where Reality Shows Up First
If slack really is rising, it usually doesn’t show up first in the headline unemployment rate. It shows up in the texture…
• fewer hours
• more part time work
• slower hiring
• longer job searches
• more people stuck on the sidelines
That’s why this chart is meaningful even if you disagree with the exact level of the true unemployment estimate. Direction matters and the chart is saying the labor market is losing momentum while inflation pressure fades.
My Takeaway
This chart captures a classic late cycle setup with disinflation moving toward deflation risk, while labor slack quietly builds. That’s exactly the environment where people celebrate cooling inflation at first until they realize the reason it’s cooling is that demand is weakening and the labor market is starting to bend.
The next phase of this cycle will be defined less by inflation coming back and more by how quickly weakening demand and tightening credit turn disinflation into something more painful. The cheering stops when people realize the lower numbers aren’t a gift..they’re a symptom.
The panic in software isn’t about valuations.
It’s about duration.
AI is collapsing the replacement cost of capability.
When competitive cycles compress from years to months, moats stop buying time.
Democratization in.
Concentration out.
Read My Latest Substack:https://t.co/aHi8gBe5CO
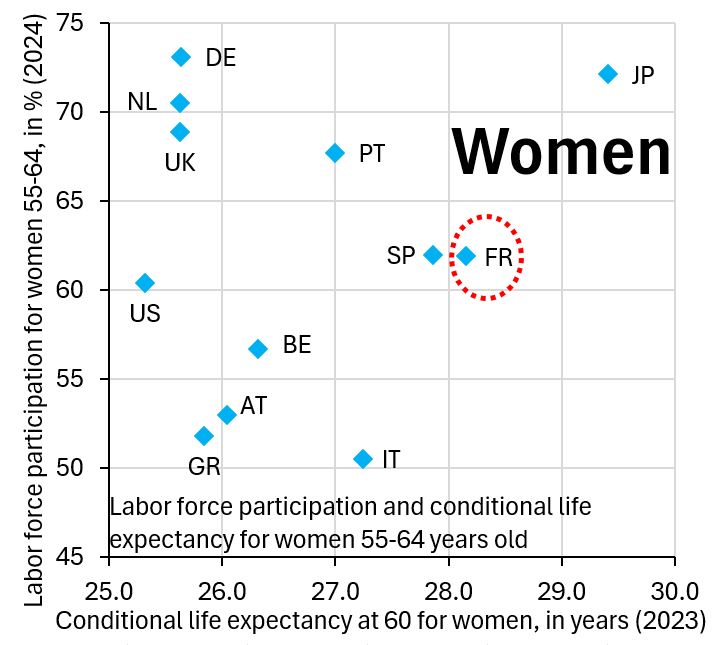
France doesn't have a fiscal crisis. It just has a "not working" crisis. If you're a French woman and you've made it to 60 years old, your conditional life expectancy is another 28 years. But only 62% of these women still work, far fewer than in Germany...
https://t.co/QvB8kHZrtH