Teach: @CtrRelPol | Research: @myfaithcounts | Books: The Nones, Great Dechurching, Vanishing Church | Former Pastor: @AmericanBaptist | Graphs about Religion
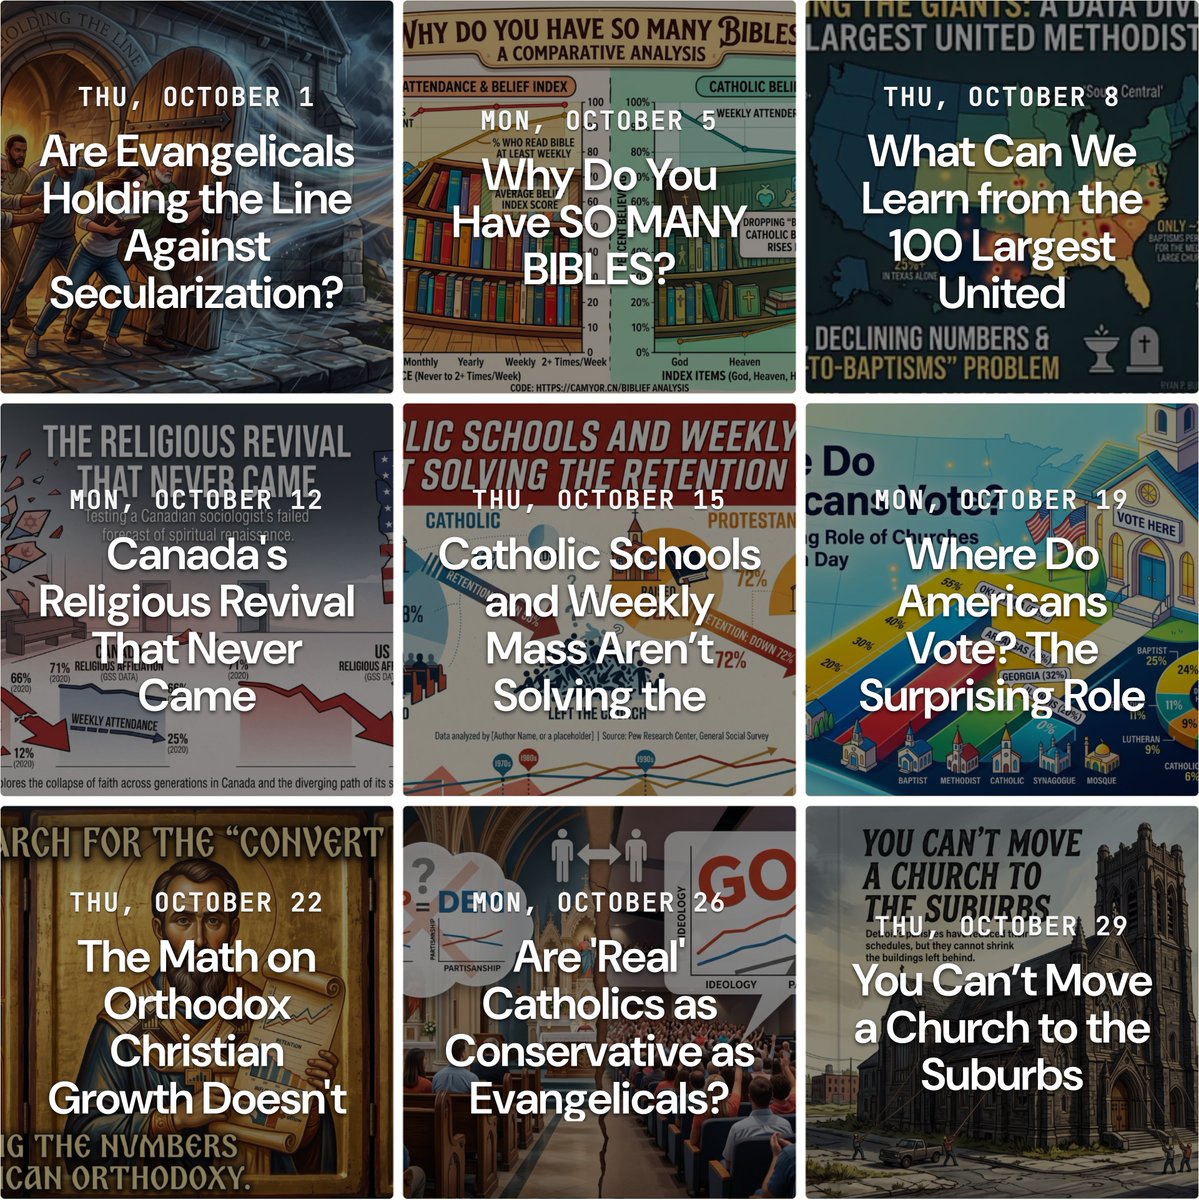
Coming up in October on the newsletter.
October 1: Most religious groups have become less religious over time. Is that true among evangelicals?
October 5: Examining the role of the Bible in American Catholicism
October 8: I do a deep dive on the 100 largest United Methodist Churches in the United States
October 12: Some data on religion in Canada. Did they experience the predicted revival?
October 15: A closer examination of factors that lead to retention in American Catholicism.
October 19: How many Americans cast their ballots in a house of worship? A lot more than I would have guessed.
October 22: A careful examination of the claim of a surge in Orthodox Christianity.
October 26: If I only compare the most devout Catholics with the most devout evangelicals, do they have similar politics?
October 29: A really in depth inspection of the decline in the Archdiocese of Detroit
One of the truisms I see in data all the time:
"Dropping out begets dropping out"
Among young single adults, guess who are the least interested in a relationship?
Those who stopped at high school.
Those seldom or never attend religious services.
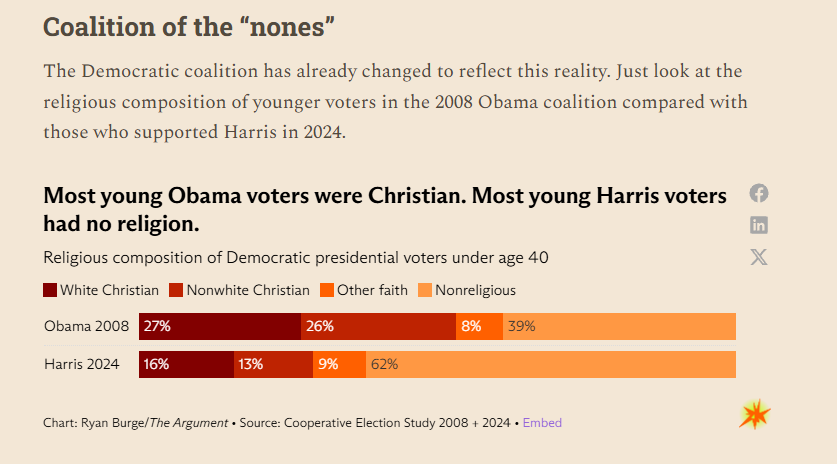
I've got a new piece in @TheArgumentMag today, where I just make this point plain:
The future of the Democratic coalition is non-religious folks.
Among Harris voters under 40:
62% of them were unaffiliated.
Just 29% were Christians.
Only 16% were white Christians.
57% of Australians say that they never attend religious services and another 14% go less than once a year.
Those numbers for Americans:
33% never and 11% seldom.
Just 15% of Australians go to religious services once a month. It's 32% of Americans.
Among mainline clergy, there's a huge gender divide when it comes to politics.
68% of female pastors identify as liberal Democrats.
It's 39% of their male counterparts.
5% of women are Republicans
6% are conservatives
For men, 19% are Republicans
26% are conservatives
A free post on my newsletter today about the religiosity of Australia vs the United States.
Spoiler Alert: Church isn't really popular with the Aussies.
https://t.co/rvyVdw3v7W
In Australia here's the religious composition of young adults:
6% Protestant (!)
13% Catholic
64% Non-religious
17% Something else
The same age group in the US?
29% Protestant
20% Catholic
40% Non-religious
11% Something else
Among people living in Bangladesh, 98% of people agree that, "The only acceptable religion is my religion."
In New Zealand, 90% of people disagreed with that statement.
Pew projects that the share of people in the world who are non-religious will actually decline substantially in the future.
24% in 2020.
17% in 2070.
The primary reason?
Regions with high fertility like Asia and Africa are not secularizing at all.
Among white evangelicals who attend church weekly:
48% identified as politically conservative in 1972.
72% said they were conservative in 2024.
+24
Among white Catholics who attend Mass weekly
36% were conservative in 1972
It was 44% in 2024.
+8
Among white Christians in 1974, the most popular combination of ideology and partisanship?
It was a moderate Democrat - 24% chose this combination.
In 2024, the most popular combination was conservative Republican - 42%.
There's a strong relationship between grades earned in school and likelihood of attending religious services.
In 1976, 54% of A students were weekly attenders.
It was 33% of C students.
In 2024: 25% vs 13%.
Of course the direction of the relationship is up for debate.
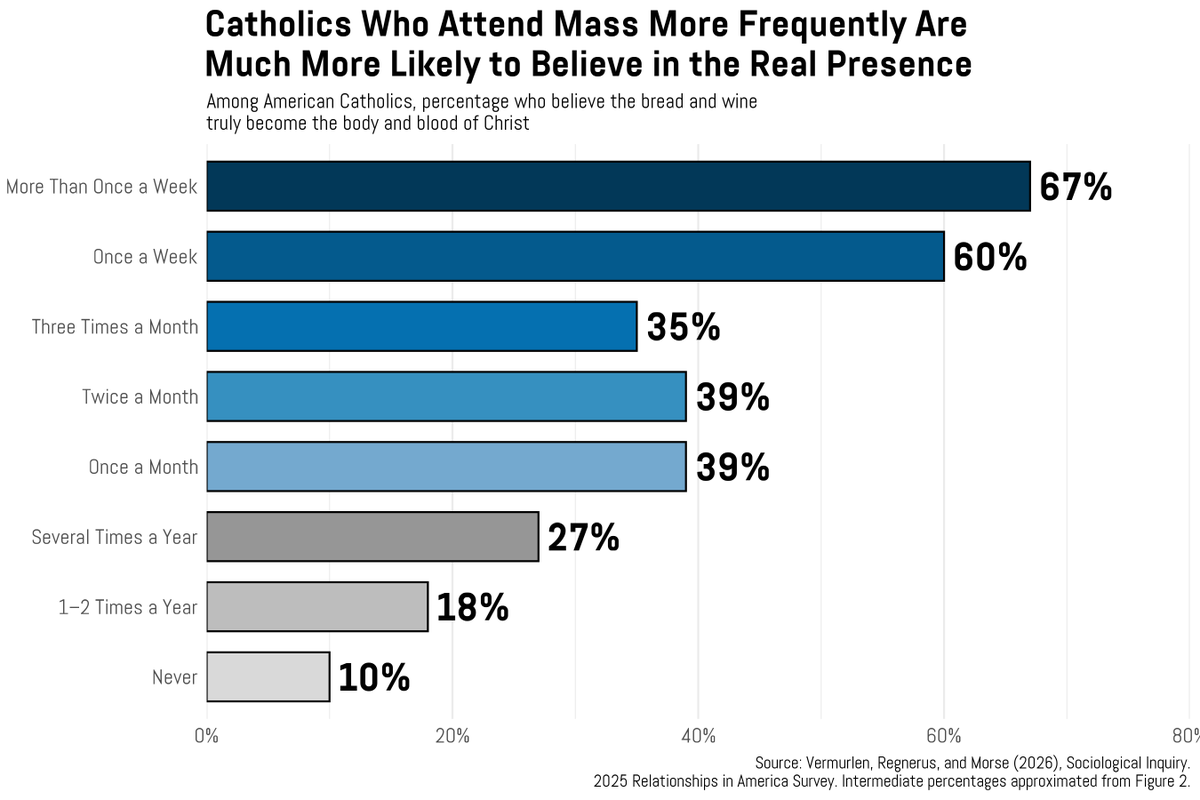
In a recent survey of American Catholics, 29% believed that the bread and the wine truly became Christ's body and blood.
That's unchanged from a Pew study in 2019, which found 31%.
Only among those who attend Mass weekly did a majority believe in "the real presence."
Between 2006 and 2025, the Southern Baptist Convention went from 16.3M to 12.3M members.
That's four million members lost in 20 years.
Guess how Protestant denominations currently have >4M members?
Besides the Southern Baptists, the answer is zero.
How many religious groups have a view on abortion to the left of the median Democrat?
Two: atheists and agnostics.
How about religious groups that are to the right of the median Republican?
Three: evangelicals, LDS, and Jehovah's Witnesses.
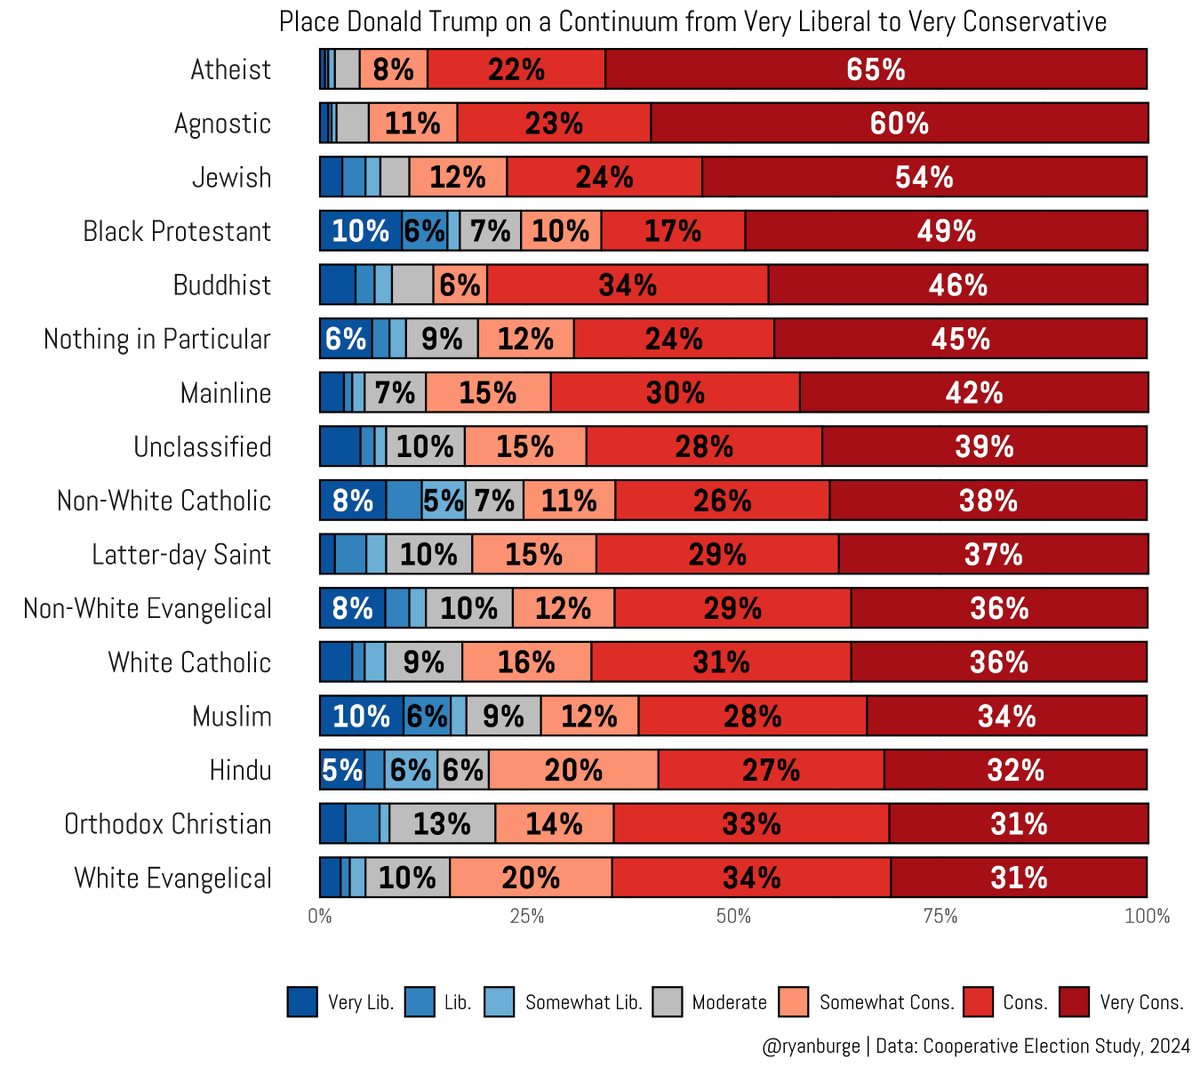
On a scale running from very liberal to very conservative, where would you place Donald Trump?
Among atheists, 65% said Trump was "very conservative"
Among white evangelicals, 31% rated him as "very conservative"
Among women attending college in the United States:
62% identify as liberal Democrats
17% say they are conservative Republicans.
Among men attending college in the United States:
40% identify as liberal Democrats
30% say they are conservative Republicans.
The average American has zero idea how truly small many religious groups are.
People were asked what share of Americans are Jewish?
They guessed 25%.
Not even 25% of Americans are Catholic!
Jews are 1.5%-2% of America.
Muslims aren't 20% of the country.
They are ~1%.