#Nikkei225#jp225
4HR CHART
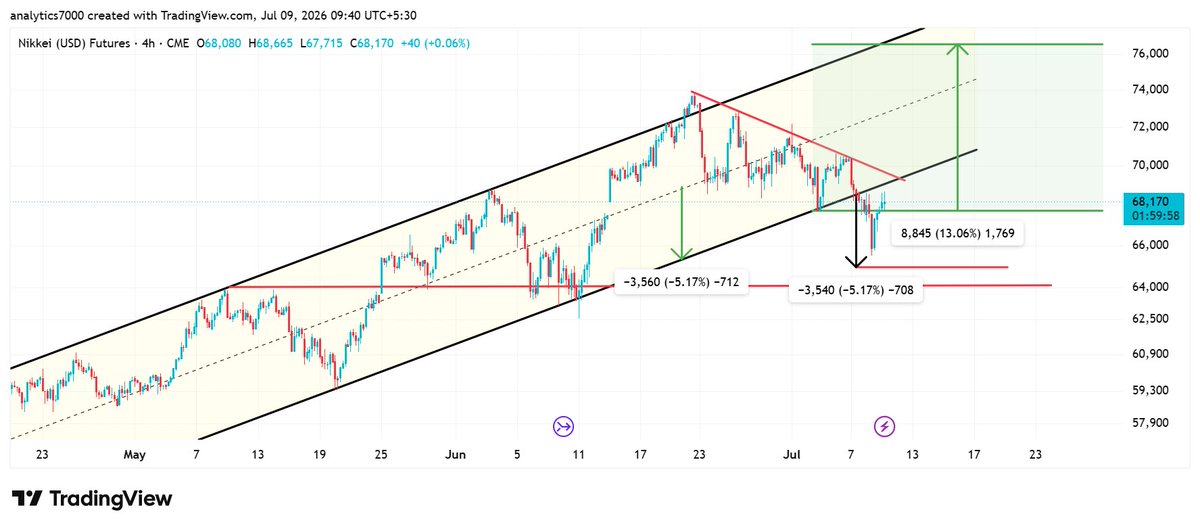
Yesterday, price break below the inetrmediate support due to news, which acted as a catalyst . It went down sharply but quickly started recovering.
We have now reached a critical zone again.
On the upside, the upper trendline of the channel (around 69,000 till Friday) and the downtrendline-which has been keeping the price in check till now (around 69,500) — will act as immediate resistance.
On the downside, two key supports are in play:,the half-measure point of the channel ct as intermediate support and the major support level — the previous high where price took considerable time to break.
As long as these supports hold, my upside target of 75,000–76,000 remains intact. Only a break of this major support zone would force me to reassess.
For minor price movements, focus on lower timeframes. Do not rely on the 4H chart.
if you have any question regarding this nikkeifeel free to ask.
#japanstockexchange #japanstocks
#XAUUSD#GOLD
4HR CHART
Price has dropped to the midline of the channel and is holding the downside support.
We are now trading between the downtrendline and the horizontal line. Updated 1H chart posted in the Telegram channel. Join via the link in the pinned msg.
#SILVER#XAGUSD
4HR CHART
Price has broken below the rising trendline and moved under the midline of the channel.
The midline will now act as intermediate resistance. Updated 1H chart is available in the Telegram channel. Join via the link in the pinned msg
#CRUDEOIL#WTI
4HR CHART
Price has broken above the upper trendline of the channel and has successfully retested it.
The key question now is whether this breakout holds and if price achieves the half-measure or full-measure target.
For that, kindly check the Daily and Weekly charts. What I’m trying to say is exactly what I explained in yesterday’s post: the 15-min breakout moved ahead and hit its target, followed by the 1H breakout doing the same. If you haven’t read it yet, I’ll post it in the comment section below. Please read it.
updated 1 hr chart on telegram channel , join by given link in pinned msg.
#NASDAQ100#USTECH100
4HR CHART
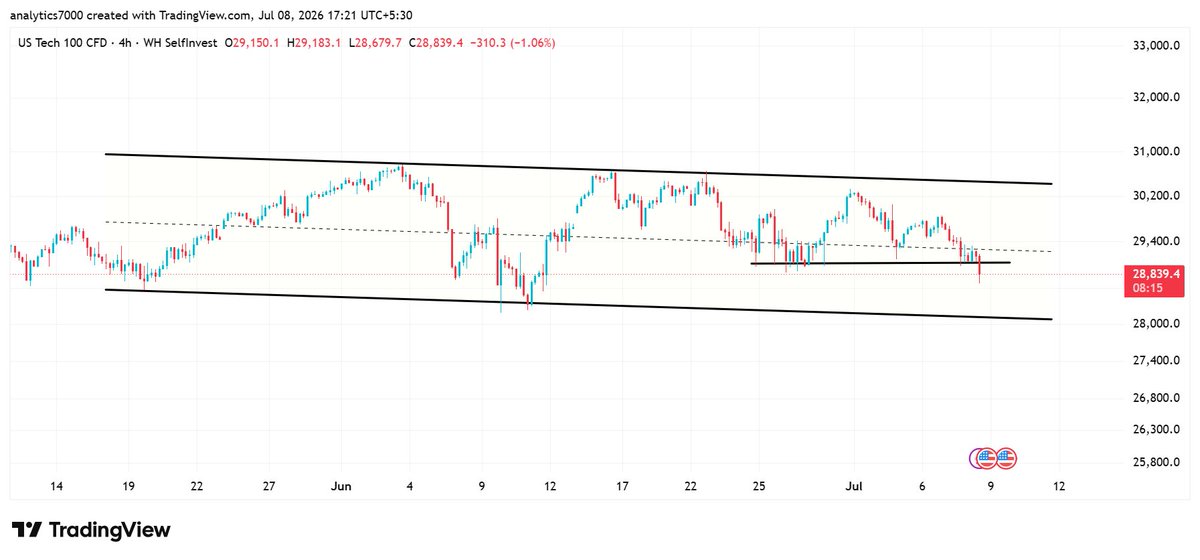
Price has broken below the midline of the channel. The next support level below the midline held initially, but news acted as a catalyst, driving the price to break below it as well.
The previous support and midline - two consecutive level are now expected to act as resistance.
The major support remains at the lower trendline of the channel.
#NIFTY50
4HR CHART
The price has reached the half measured target and i mention clearly in last post , it will act as interemdiate resistance , It was rejected from that level.
Due to the new catalyst/effect, it easily broke below the rising trendline and moved down to the upper trendline of the channel, which is now acting as the next support level (it was previously a resistance).
If this support level also breaks, prepare for the price to move back inside the channel.
updated short term chart on telegram channel , join via given link in pinned msg.
#US30#DOWJONES
4HR CHART
The upper trendline is acting as major resistance(mentioned in last post). Price has pulled back to the channel midline, which is now serving as intermediate support.
If price holds the midline, expect another bounce. A break below it would target the lower trendline of the channel - the next major support.
#XAUUSD#GOLD
4HR CHART
Price has been respecting the downtrendline within the channel till now. Below it, the intermediate support is the midline of the channel.
updated short term chart on telegram channel , join by given link in pinned msg .
#Nikkei#jp225
4HR CHART
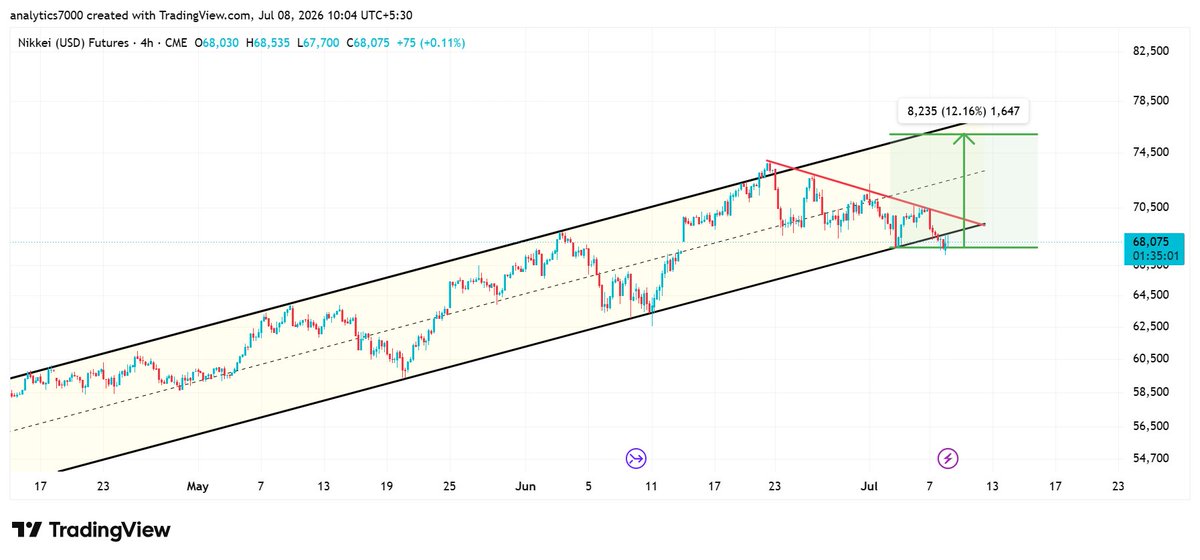
Price rose again but got rejected again at the downtrendline. It then declined to the lower trendline of the channel and is currently trading around it.
However, this does not change my overall view yet. My bullish stance remains intact. I will update if there is any short-term shift in the structure. If price starts stabilizing below the lower trendline, we may see one more dip before the next upside move.
But as of now, it is not indicating that.
for minor move track short term chart .
#CRUDEOIL#WTI
4HR CHART
Price is about to reach the upper trendline of the channel, which is acting as a major resistance. Updated 1HR Chart (Telegram): There was a clear breakout yesterday - clearly shown in yesterday breakout , link is in the pinned message.
#SILVER#XAGUSD
4HR CHART
The price has reached the rising trendline within the channel. This is a key area because after showing a bounce, the price retraced back to a strong confluence support zone formed by the midline and the rising trendline.
This confluence makes the area a major support. If the price holds here, the next move is expected to be a bounce toward the upper trendline of the channel.
However, if it breaks below this level, a decline will follow.
updated short term chart on telegram channel, join by given link in pinned msg.
#NIFTY50
4HR CHART
The price has been trading inside a channel for a long time and has finally broken out after respecting the channel boundaries.
The breakout occurred while holding the rising trendline, which itself originates from the lower trendline of the channel .
The first half of the measured target will act as the initial intermediate resistance. As long as the rising trendline holds, the upside momentum is expected to remain strong.
updaTED 15 MIN CHART ON TELEGRAM , YOU CAN JOIN BY GIVEN LINK IN PINNED MSG AND ITS FREE.
#Nikkei225#jp225
4HR CHART
The price continues to remain inside a well-defined trading range. It has bounced approximately 4 times from the support level up to the downtrendline, and has been rejected 4 times from the downtrendline back down to the support.
This range has provided excellent trading conditions so far. The price is expected to eventually break out of this trading range, moving toward the major target that was marked on the 4-hour chart.
For the minor (short-term) direction, it is better to monitor lower timeframes such as the 1-hour or 30-minute chart, whichever suits your trading style.
#NASDAQ100#USTECH100
4HR CHART
The price has broken below the rising trendline and has now reached the midline of the descending channel, which is acting as an intermediate support level. The price has bounced slightly from this level.
The upper trendline of the channel remains the key resistance, while the midline continues to serve as the immediate intermediate support.
#US30#DOWJONES
4HR CHART
After taking multiple supports around the midline of the channel, the price has finally reached the upper trendline, which is now acting as a major resistance level.
#Nikkei225#jp225
4HR CHART
Short term target=75000-76000 is marked on the chart .
After hitting the lower trendline, the price showed initial strength and bounced back. Its first intermediate resistance is the downtrend line, which has consistently kept the price in check on the downside. The price has been repeatedly taking dips from this level.
#KOSPI
4HR CHART
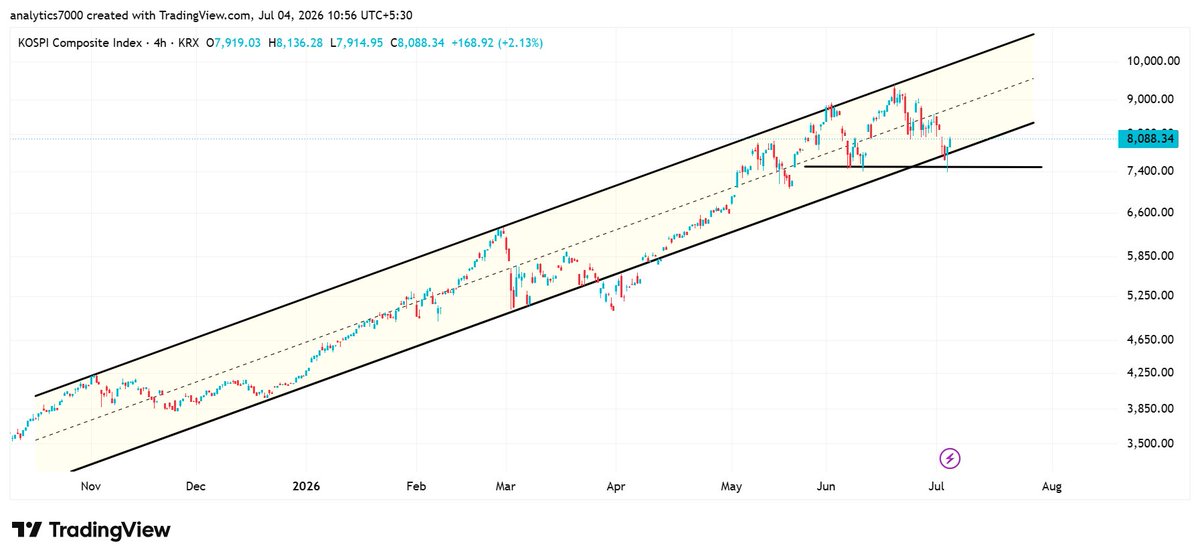
The price has been rallying within this ascending channel. After hitting the upper trendline, which acted as a major resistance, it has now pulled back to the lower trendline of the channel, which is serving as a major support.
This bullish run is not over yet, and more upside potential remains.
As long as the price continues to hold the horizontal support marked on the chart, the next upside target is the midline of the ascending channel.