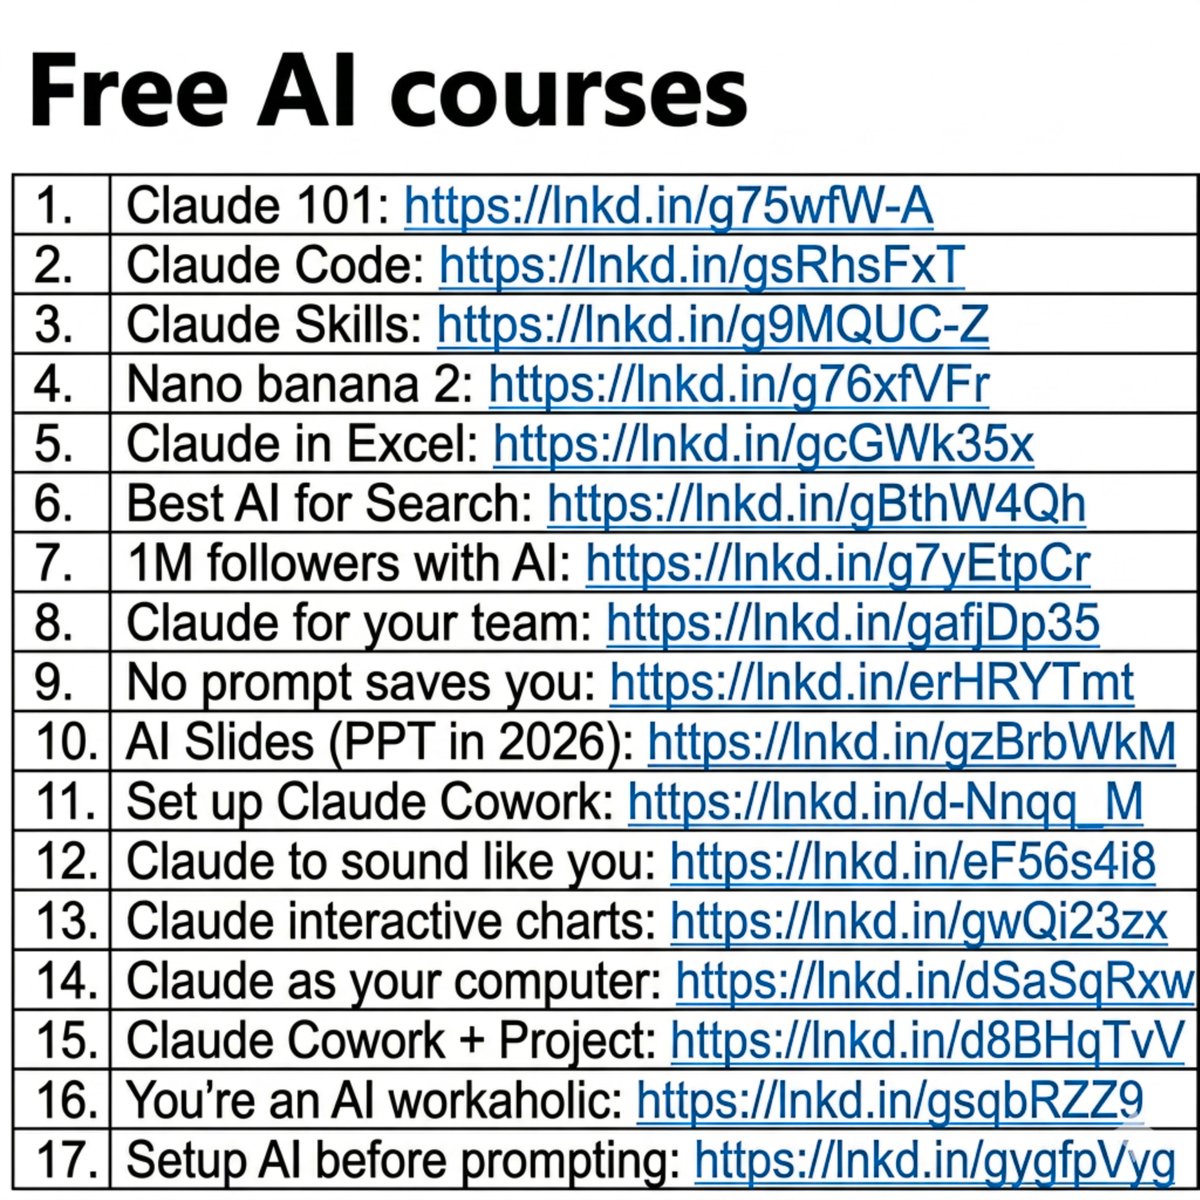
People think learning AI takes months.
It's really just a couple of hours.
And I wrote 17 free guides to start right away:
Claude 101: https://t.co/Jv1jsvFB7T
Claude Code: https://t.co/WYZd5ltnXo
Claude Skills: https://t.co/jT4uB5AFtY
Nano banana 2: https://t.co/qfHT594CCI
Claude in Excel: https://t.co/mfcXYSA57j
Best AI for Search: https://t.co/77BmjbJjP0
1M followers with AI: https://t.co/1TV9LYAptv
Claude for your team: https://t.co/U1JsBVC299
No prompt saves you: https://t.co/SDKJWykHE4
AI Slides (PPT in 2026): https://t.co/RfcyYRQ2Ad
Set up Claude Cowork: https://t.co/diDhiKjHtU
Claude to sound like you: https://t.co/99RzxXTvzs
Claude interactive charts: https://t.co/ebCHGZqgPt
Claude as your computer: https://t.co/TxYuHPiImn
Claude Cowork + Project: https://t.co/Q7AN9CZ2mg
You're an AI workaholic: https://t.co/mCIvB3ZPA5
Setup AI before prompting: https://t.co/pE3OF722aw
___
1. Save this list for later (three dots, top right).
2. Share it with a friend by ♻️ reposting this image.
3. Subscribe to my free newsletter: https://t.co/psB7XxAv8w.
⚠️ATENCIÓN⚠️
¡EL RIESGO MUNDIAL ES TOTAL!
🩸El índice de RIESGO GEOPOLÍTICO MUNDIAL está en su NIVEL MÁS ALTO desde el 11 de septiembre del 2001 (caída de las Torres Gemelas).
¿Sabés qué hicieron los mercados la última vez que este índice estuvo donde está hoy⁉️
🔻El Global Geopolitical Risk Index es un indicador que mide el nivel de riesgo geopolítico mundial basándose en menciones de eventos, amenazas y conflictos en la prensa internacional.
🔻Hoy está ARRIBA de 300. La última vez que tocó esos niveles fue el 11 de septiembre de 2001, después de los atentados a las Torres Gemelas.
🔻Y si pensás que es "solo otro gráfico que el mercado puede ignorar", te equivocás.
🔻Esta no es una zona donde se llega por una mala semana. Es una zona donde se llega cuando el mercado empieza a poner en precios algo mucho más grande que un shock de un día.
¿QUÉ PASÓ CON LOS MERCADOS DESPUÉS DEL 11/9⁉️
👉La gente recuerda las imágenes. Casi nadie recuerda lo que pasó en Wall Street. Te lo cuento, porque es CLAVE para entender lo que se puede venir:
▪️Las bolsas de EE.UU. cerraron por casi UNA SEMANA. Fue el cierre más largo desde la Gran Depresión.
▪️Cuando reabrió Wall Street el 17 de septiembre, el Dow Jones se desplomó 684,81 puntos en UN solo día. Era la mayor caída en puntos hasta ese momento.
▪️Al final de esa semana, el S&P 500 había caído 11,6%.
▪️El Nasdaq había caído 16%.
▪️Aproximadamente $1,4 TRILLONES en valor de mercado se EVAPORARON.
▪️Y ese fue solo el comienzo. La recesión que siguió duró meses.
🎯AHORA MIRÁ LO QUE ESTÁ PASANDO HOY:
👉El índice volvió a romper 300. Está EN la misma zona que el 11/9. Y al mismo tiempo:
▪️El petróleo BRENT subió 64% en un mes.
▪️El petróleo americano subió 52%.
▪️El Estrecho de Ormuz cerrado.
▪️JPMorgan pronostica petróleo a $150 para mediados de abril.
▪️Reservas estratégicas vaciándose por región.
🧨LA DIFERENCIA CON EL 11/9 Y POR QUÉ ESTA VEZ PUEDE SER PEOR:
📍El 11/9 fue un evento puntual. Un día, un ataque, una respuesta. Dolor concentrado, pero con un punto de inflexión claro.
📍Lo de hoy es diferente. Es un proceso PROLONGADO. La guerra no se pelea en un día. Las cadenas de suministro destruidas no se reconstruyen en un mes. Esto puede ser una crisis con DURACIÓN.
¿Creés que el mercado ya descontó lo peor o estamos viendo solo el comienzo⁉️
🚨🚨EL VIDEO MÁS PODEROSO QUE VERÁS HOY.
John Clauser, Premio Nobel de Física y 1,500 Cientificos más en Quantum Korea dicen:
"NO EXISTE Cambio Climático, NO EXISTE Emergencia Climática"
El Dr. Clause Agregó: "La narrativa del Cambio Climático es una PELIGROSA CORRUPCIÓN QUE AMENAZA LA ECONÓMIA A NIVEL GLOBAL" ⚔️🔥
🚨ATENCIÓN🚨
¡ESTÁS ADVERTIDO! (REACCIÓN EN CADENA)
❌La FED y el BCE plantean un horizonte oscuro...
¿A qué me refiero con esto⁉️
🤯Lagarde, presidenta del Banco Central Europeo, en relación a la guerra: "Los mercados financieros no entienden lo que les espera.”
🔻Christine Lagarde afirma que el daño de la guerra con Irán ya está hecho y que va a durar años.
🔻Pero lo peor sería esto. Señaló algo que la mayoría de los inversores pasó completamente por alto:
"El helio (crítico para fabricar chips avanzados) fluía a través del Estrecho de Ormuz; los fabricantes de chips solo tienen inventario para unos pocos meses."
👉Básicamente, el MOTOR PRINCIPAL del S&P 500 de los últimos años (la revolución de la IA) corre un riesgo enorme...
👉Y, como venimos comentando hace rato, Lagarde agrega que esta guerra va a aumentar la inflación, lo cual probablemente "lleve al BCE a aumentar la tasa".
🇺🇸Por el lado de la FED nos encontramos con lo siguiente:
🔻Ahora no se espera que la Reserva Federal de EE.UU. recorte las tasas de interés hasta diciembre de 2027.
🔻Ahora hay un 51% de probabilidad de un AUMENTO de tasas de interés para marzo de 2027.
🔻Los AUMENTOS de tasas ahora son más probables que los RECORTES de tasas.
🔻Esto sería NEGATIVO para los mercados financieros debido a que REDUCE la circulación del dinero, lo cual nos deja con menos dinero disponible para la inversión.
📍El panorama CAMBIÓ COMPLETAMENTE en cuestión de días...
@techconcatalina Esto es un antes y un despues en la percepcion de muchos sobre lo que es y el origen conceptual de bitcoin.
Las narrativas que nos contaron, las zonas grises que ahora toman forma y clarifican intereses. A largo plazo las cosas cuadran mejor.
@techconcatalina Estamos siendo protagonistas de una epoca historica, un cambio que si bien viene sucediendo hace años, esta etapa se intensifica
Salu2 desde bs as!
$BTC
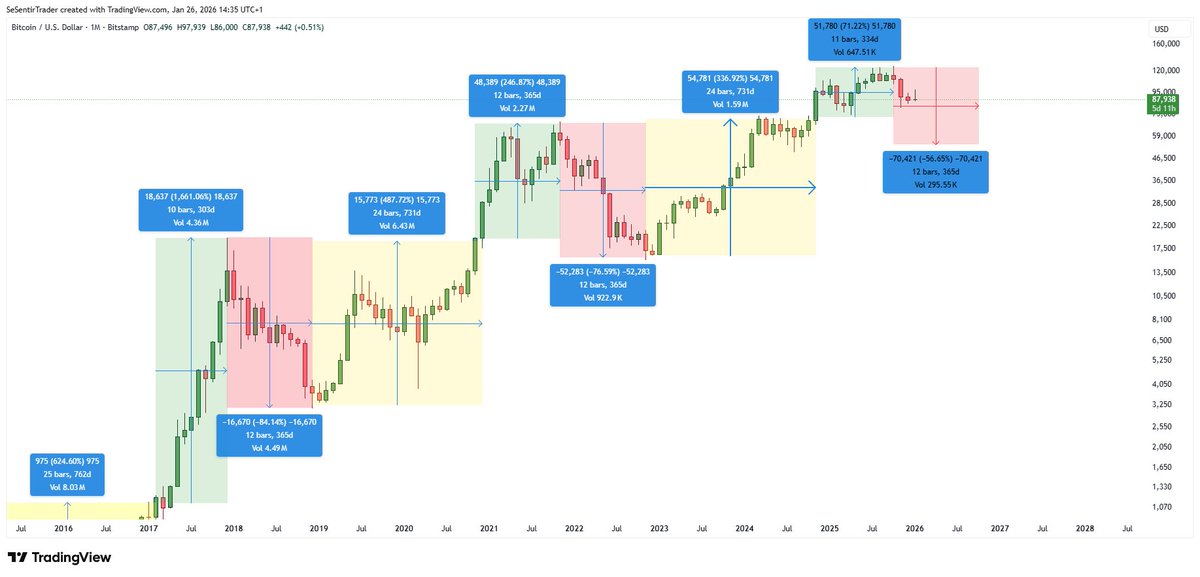
MONTHLY CHART - the 4-year cycle is repeating itself
My best indicator to understand long-term trends about Bitcoin remains the 4-year cycle theory. It has never failed once. Not even last year.
For those who don't know, since 2013 Bitcoin has know 3 market cycles with the following phases:
▪️2 years of solid growth (yellow in the chart)
▪️1 year of bullrun (green in the chart)
▪️1 year of bearmarket (red in the chart)
The bullrun phase ended at the top in October 2025. We are now in the bear market phase until around October 2026.
If we extrapolate from the previous cycle, my bear market target is around 50 000$ in October 2026.
In the meantime, we can and probably will range around 80k for a while before reaching 50k.
This is really the only indicator that never failed me. I'll update this post in October 2026.
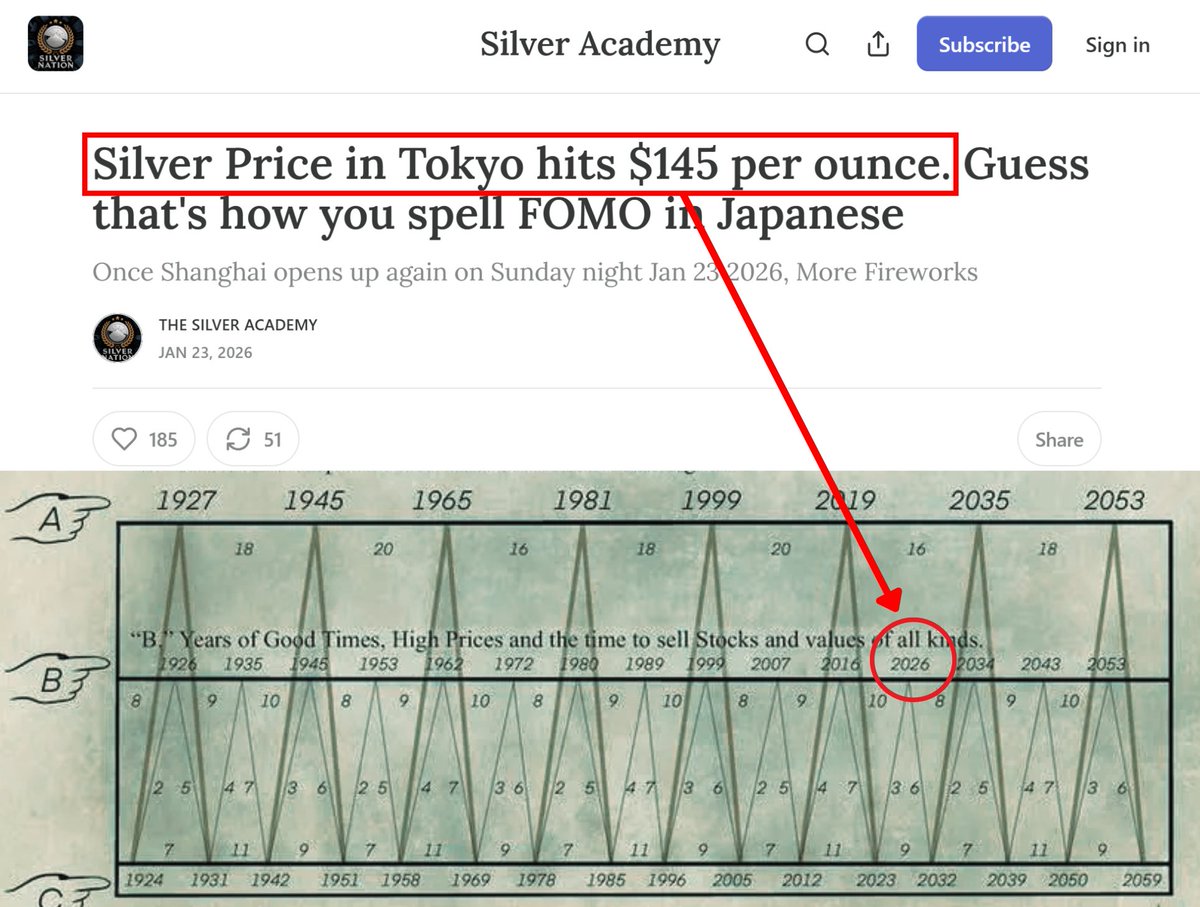
This 150-year-old market cycle chart has a surprising track record. For generations, it has highlighted the best moments to buy, sell, and build wealth- Prices, and a good time often long before the average investor noticed.📜📈📉
🚨 IF SILVER HITS ITS TRUE VALUE, BANKS GO TO ZERO!!
The charts say silver is at $100/oz.
But try buying physical in the real world.
You will see a completely different price.
Physical vs paper spread:
- 🇯🇵 Japan: ~$145/oz
- 🇦🇪 UAE: ~$165/oz
- 🇨🇳 China: ~$140/oz
- 🇺🇸 COMEX spot: $100/oz
Do you see the problem?
That's a 45-80% divergence between the paper price and the physical clearing price.
In a healthy market, arbitrage would close that gap fast.
The fact it has not tells you one thing
The paper market is capped.
Now look at the mechanism.
Why is COMEX suppressed
Because bullion banks are sitting on huge net short exposure.
If silver reprices to where physical clears, $130-$150, the mark to market losses on those short derivatives become CATASTROPHIC.
That's BILLIONS in losses hitting bank balance sheets fast.
Tier 1 ratios get smashed.
They're not trading silver anymore.
They're trying to survive.
Now the endgame.
This is a delivery squeeze setup.
People pull physical out of vaults.
Banks print more paper contracts.
Good money gets hoarded.
Bad money floods the market.
Eventually, registered inventory gets too low.
Then delivery stress goes vertical.
And when that happens, the paper price becomes irrelevant.
Price snaps to the physical reality.
This is not just manipulation.
It is a desperate attempt to avoid a solvency event.
I’ve studied macro for 10 years and I called almost every major market top, including the October BTC ATH.
Follow and turn notifications on.
I’ll post the warning BEFORE it hits the headlines.