@J_Davis132 Cap is amazing btw. very unique system combining geometry, fibs, gann and time cycles across asset types and instruments (from commons, futes to lev ETFs to options). on top of it he’s a really good person who loves to share and teach his system.
@Bluekurtic There’s a misunderstanding of what sell in May and go away really means. It doesn’t mean that markets print a local top but rather that the easy money has been made and market goes into less volatile grind up or chop mode instead
BREAKING: President Trump says the US government is now up over $30 billion since he decided to buy Intel stock, $INTC, in August 2025.
"I'm very proud of that company," Trump says.
Agreed. Ppl will be in BTFD mode since they know Trump put can come anyday. But on the other hand, they will also be short time speculative buyers since they know anyday another geopolitical induced crash may come. So instead of buying LEAPS or holding stocks for medium/term term, we will probably see short term buying and selling and more of lotto bets than long term investing.
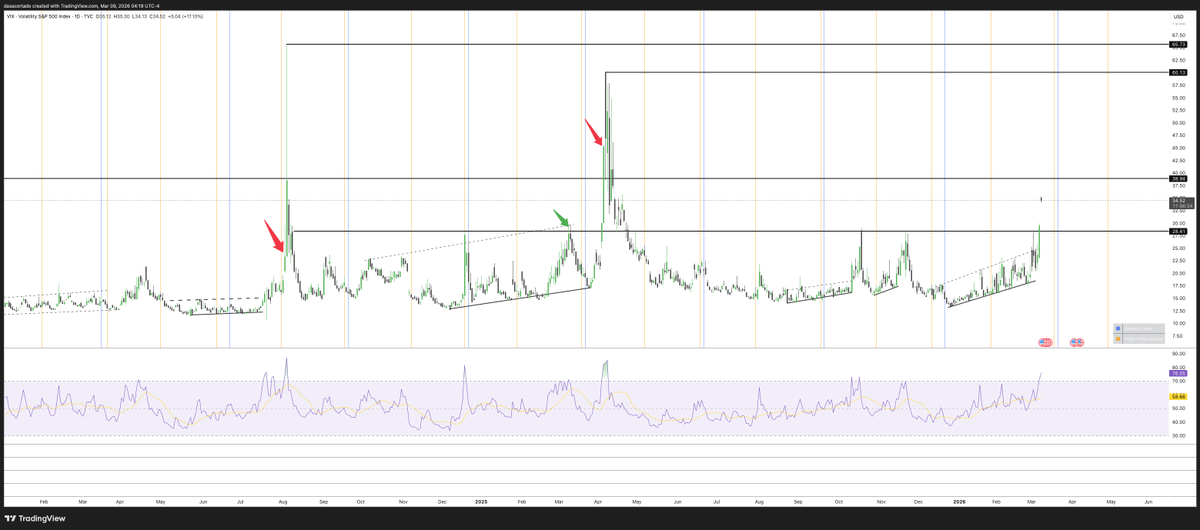
I believe we are in the mid-late Mar'25 phase in equities and crypto in relation to actual bottoming (green arrow in the attached VIX chart)
We should expect counter trend rally this & next week (weak or strong) and some sorta VIX crush to happen but considering next week is FOMC and quarterly OPEX, there's a higher probability that the actual bottom will form the week after the OPEX
And if VIX fails to lose 20 on weekly close then we should expect a 2022 LH/LL bear market playing out. Still not my base case even though the war/oil/crypto are kinda working as leading indicators for that fractal.
My base case is that this was a head fake out of the indices weekly bollinger band squeeze and we go long & strong after Apr/May real bottom for a real squeeze for US equities considering now global (incl emerging countries) have had there fill of parabolic runs
I will NOT delete this post if wrong, although I doubt anyone would care 😀 it's a game of probabilities, most theories are bound to be wrong
@Chillingbo11008 nominal terms can be misleading too. AUM since 2020s has increased by multi folds in tech. which means that while the outflows are quite large, they may provide a different picture in % of AUM. if these are already not in % of AUM.
AAPL
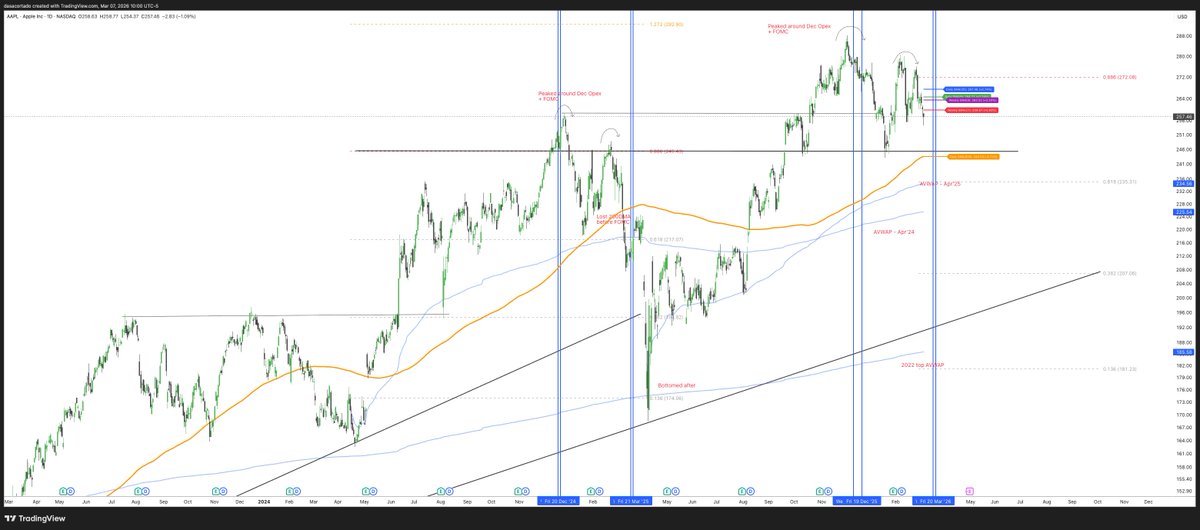
Blue vertical lines are the FOMC press conference and Quarterly OPEX dates. Notice how back in Dec'24 we peaked around the quarterly opex + fomc week, then slid down losing the 200DMA (orange line) when approaching the Mar'25 quarterly opex + FOMC.
the playbook seems to be repeating now too. upcoming quarterly opex is on 20th Mar while the FOMC press conference is on 18th Mar.
so let's see what the upcoming week brings going into week after's catalyst loaded week.
either way the actual resolution of the current 4 months long choppy range in indices will probably resolve around Mar QOPEX + FOMC.
PS: sorry for the busy chart.
unless it’s a prolonged bear market.
not that we are in one now nor do I know if we will be in one in near future (no one knows).
bubbles can take up forever to burst. also bubbles can form out of nowhere, all it will take is one domino to fall in global macro environment.
ultimately if one is buying commons as the accumulation dip thesis, position sizing, risk management and profit taking is all what matters. doesn’t matter if it’s a bubble or not or pico bottom or not, since no one knows when those happen.
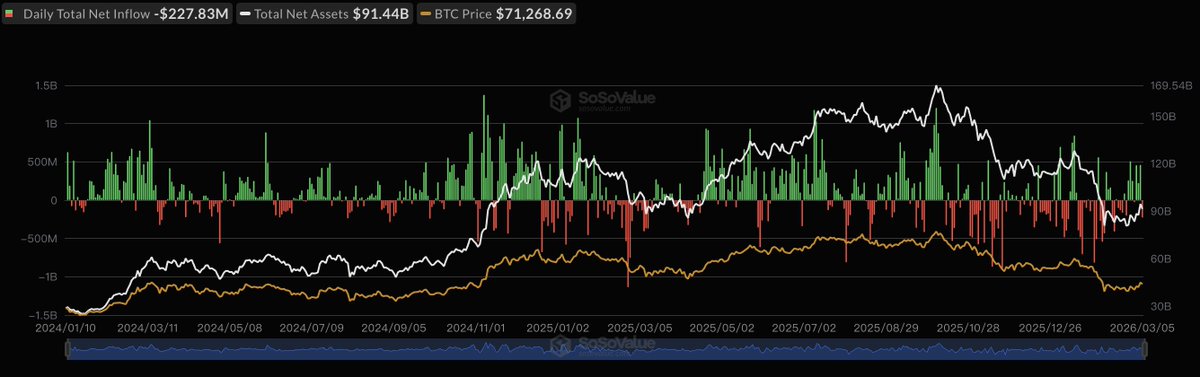
ETF in/out flows are spurious at best, they haven't given as clear a signal before IMO: https://t.co/Tm88BPCDiO
Also fwiw ETFs positions can be used in multiple ways to actually take a bearish position in BTC and other crypto. Selling covered calls is one way. Buying and selling in range is another way. Actually shorting the ETFs is another way. Jane St 13F filings have already shown that big MMs can buy into crypto ETFs in what looks like an accumulation but rather could be part of a larger HFT and hedging machinery.
also I don't know if it matters but I would love for BTC and alts to just run from here and not look back for the sake of my port :D
On March 5 Eastern Time, Bitcoin spot ETFs recorded a total net outflow of $228 million. Ethereum spot ETFs recorded a total net outflow of $90.9365 million. https://t.co/Hj2Gs49bWa
TSLA
Would be pretty crazy (but not really) if history rhymes. HTF H&S look. I know it's a stretch.
Part of me feels that the right shoulder comes when during the dip to 0.382 the voices and noises of SpaceX IPO and Tesla holders being beneficiary somehow would take hold and people will shout $2k targets for Tesla (which can happen, you never know with Tesla). What if Tesla holders become the exit liquidity considering retail owns a lot of Tesla stock (like me)?
What's interesting is that if that 0.382 (320-340) dip comes and then we run up to make that right shoulder, that would place us in Apr-May/June'22 scenario which also rhymes with BTC chart in Apr-May/June'22.
In short if this scenario was to come true Tesla and BTC today are in the same scenario as they were in Apr-May/June'22.
Ofcourse this is just a theory, no one knows what's ahead. All we can do is speculate.
PS: I am long term holder since 2020 in Tesla (and much before in BTC) so if it was upto me this scenario won't happen 😁
And if we get that 200DMA touch, the reaction there will be pretty clear for us to know whether we are getting 2022 bear market or Apr'25 drawdown or something totally different. Only time will tell.
SPX
I know everyone is drooling over Apr'25 like entries again with a rounding top look on SPX. And it sure looks weak with now RSP/equal weights giving some of the way as well.
I have posted before on how RSP making new ATHs (i.e. breadth) visualized as an oscillator shows how current circumstance is different even though tech was lagging before Feb'25 like it has been lagging now.
So all it will take is RSP+IWM to give up and tech + software continue it's way down. No one knows what and when "something" will happen.
Here's one theory though: maybe we create one low towards 200DMA (1.272 fib) like we did in Aug'24 before going up and to the right for few more months and that's when the real hammer comes. May be before the 200DMA touch we overthrow into a new ATH before the 200DMA touch, maybe we won't.
Would kinda make sense too considering at range lows the whole world hedges like hell and at range highs everyone wants to frontrun a breakout.