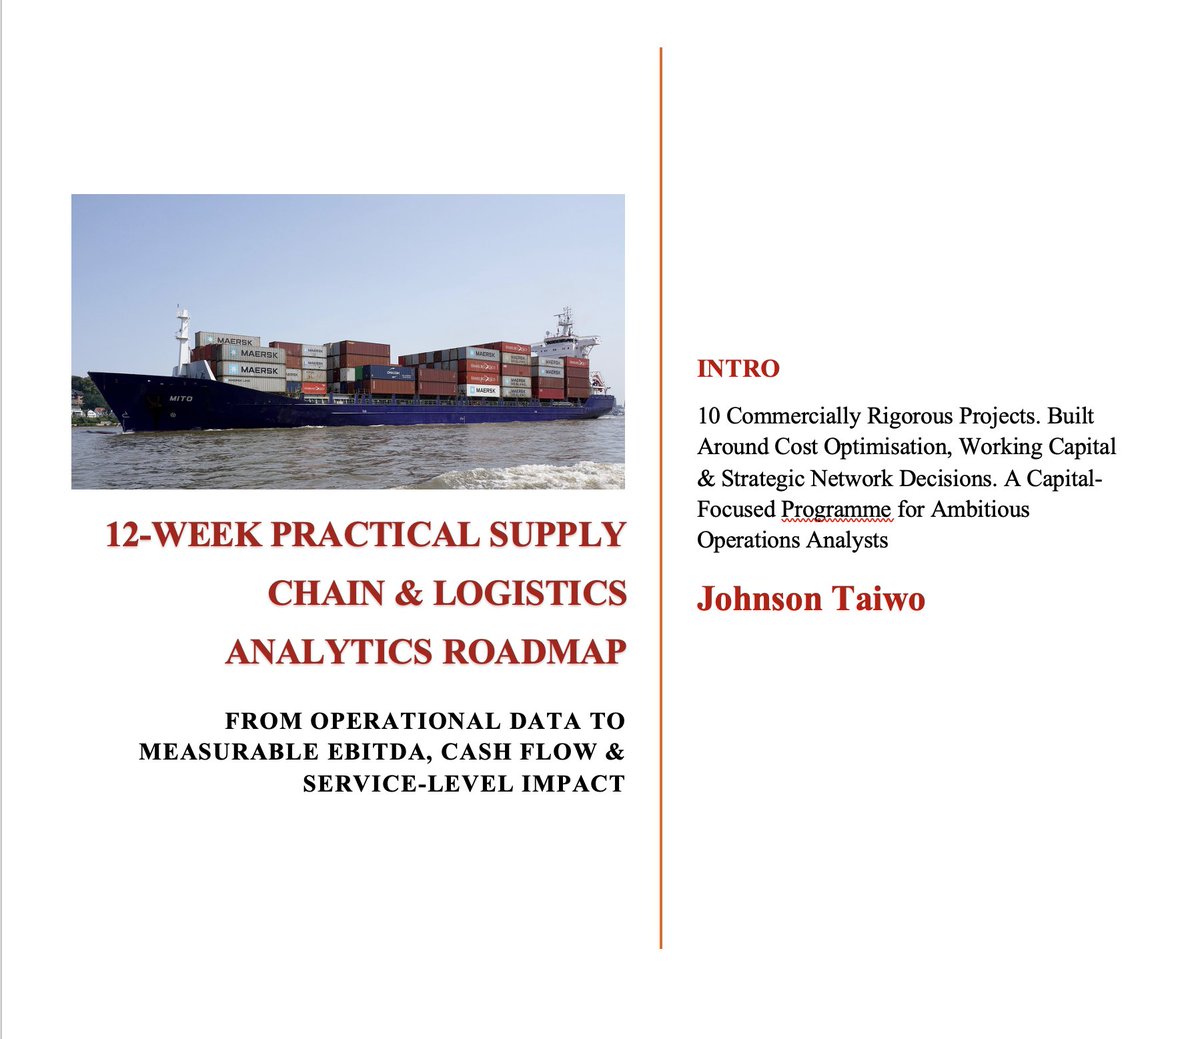
If you're a Data Analyst, Operations Analyst, or aspiring Supply Chain & Logistics Analyst who wants to move from reporting dashboards to driving real supply chain decisions, read this:
Dashboards are not enough.
Modern supply chain teams promote analysts who can:
• Forecast demand under uncertainty
• Optimise inventory and release working capital
• Model cost-to-serve and margin impact
• Quantify supplier and operational risk
• Simulate stockouts and lost-sales exposure
• Design efficient distribution and network flows
Most analysts track KPIs.
Very few understand capital and operational impact.
So I built the >>Supply Chain Capital Intelligence Blueprint << to move you from metric reporting to operational decision intelligence.
A system with two parts:
>>1. Supply Chain & Capital Intelligence Framework
Learn how real supply chains actually operate:
• Working capital & inventory optimisation
• Cost-to-serve and margin dynamics
• Supplier & concentration risk
• Multi-echelon inventory logic
• Transport cost volatility
• Network design and expansion strategy
• Executive operational communication
>>>2. The 12-Week Practical Supply Chain Analytics Roadmap
Build 10 real-world projects:
• Inventory optimisation (capital-focused)
• Cost-to-serve modelling
• Stockout and lost-sales simulation
• Supplier risk analysis
• Network optimisation
• Demand variability modelling
• Capacity and fulfilment analysis
• Capital allocation modelling
• Service level vs cost trade-offs
• Operational KPI system (decision-focused)
This is not decorative analytics.
This is institutional-level operational intelligence.
If you want the roadmap:
➡️Like
➡️Repost
➡️Comment ROADMAP
➡️send me a DM, I’ll share it
Today marks a real milestone in my data analysis journey — I've completed my Excel for Data Analytics course.
From basic spreadsheet navigation to building dashboards, writing DAX formulas in Power Pivot, and automating data workflows with Power Query, it all came together gradually, one concept at a time.
Looking back, the biggest shift wasn't learning individual functions. It was starting to think in terms of data structure, relationships, and repeatable processes.
Next step: completing my final Excel project, then moving into SQL.
Every tool builds on the last. That's what makes this process worth documenting.
#DataDriven #msexcel @cfc_prayz@msexcel@SQLServer
Every data analyst should read this 👇
Firstly , Great breakdown 👏 this is one of the most common interview questions, and your approach is solid.
That said, as you grow in your career, what really differentiates you isn’t just explaining the process, it’s showing:
1. Realistic evidence
2. Business context,
3. Critical judgement,
And how you make decisions that the business can trust.
Most analysts explain what they did. Stronger candidates explain why it mattered and how they made decisions under uncertainty.
Here’s how you can elevate your response:
>> Intro (Data Assurance & Cleaning)
“I approach data cleaning as a data quality and risk management process, ensuring the data is reliable enough to support business decisions, not just technically ‘clean’.”
For example;
>> Situation (Context)
“I worked on a monthly revenue reporting dataset used by the commercial team to track performance across UK and Nigerian markets. The data came from an e-commerce platform, Excel uploads, and an internal system, and had several quality issues, duplicate customers, missing revenue, mixed currencies, inconsistent dates, and negative values that didn’t clearly distinguish between refunds and errors.”
Task
“My responsibility was to ensure the revenue report presented to leadership each month was accurate, consistent, and could be confidently defended.”
Action (Judgement, Justification & Clarity)
“I approached this by focusing on key data quality dimensions, completeness, accuracy, consistency, and uniqueness.”
- For missing data (completeness), I didn’t remove it immediately, because that could bias insights. Instead, I assessed patterns and treated it based on impact
- For duplicates (uniqueness), I consolidated records to avoid double-counting customers, ensuring reliable customer-level analysis
- For currencies and dates (consistency), I standardised them so performance could be compared fairly across regions and time
- For negative values (validity), I investigated whether they were real refunds or errors, so revenue figures reflected actual business activity
- Finally, I validated the dataset against finance records (accuracy), to align with how the business defines “truth”
(what is show here is a very clear reasoning, not just steps)
>> Impact (Measured)
“This reduced reporting discrepancies by approximately 30%, significantly improving confidence in the data used for business decisions.”
>> Reflection
“And In hindsight, I would push for stronger upstream data governance, introducing validation checks earlier to improve data quality at source.”
At that level, it’s not just about cleaning data.
It’s about showing you can apply structured thinking, communication clearly and deliver measurable business impact.
That’s what interviewers remember.
Have you tried this Data Analysis hack in Excel yet? 🤔
I'm hosting a FREE Data Analysis class to help you transform dry data into compelling spreadsheets that tell a story. Click the link in my bio to register today! 🙌
#excel#exceltips#corporate
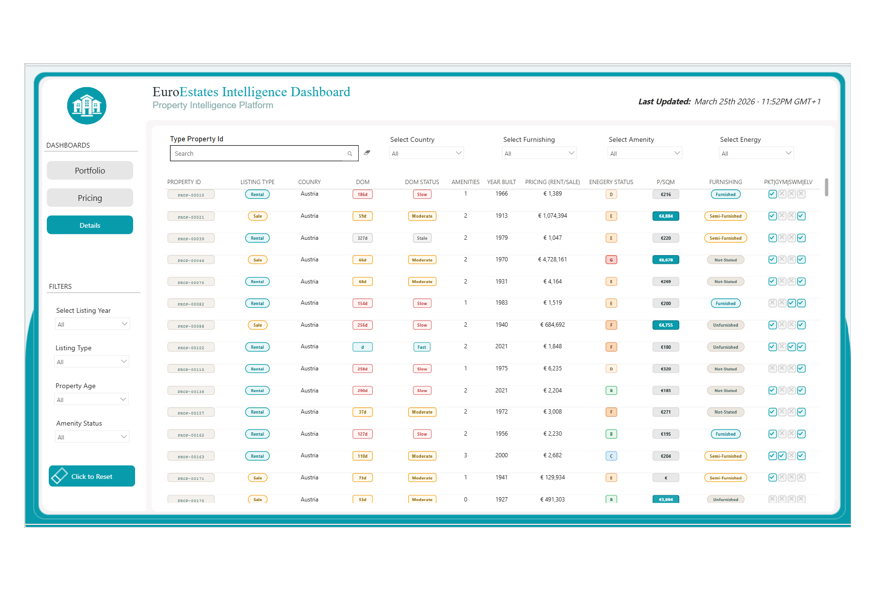
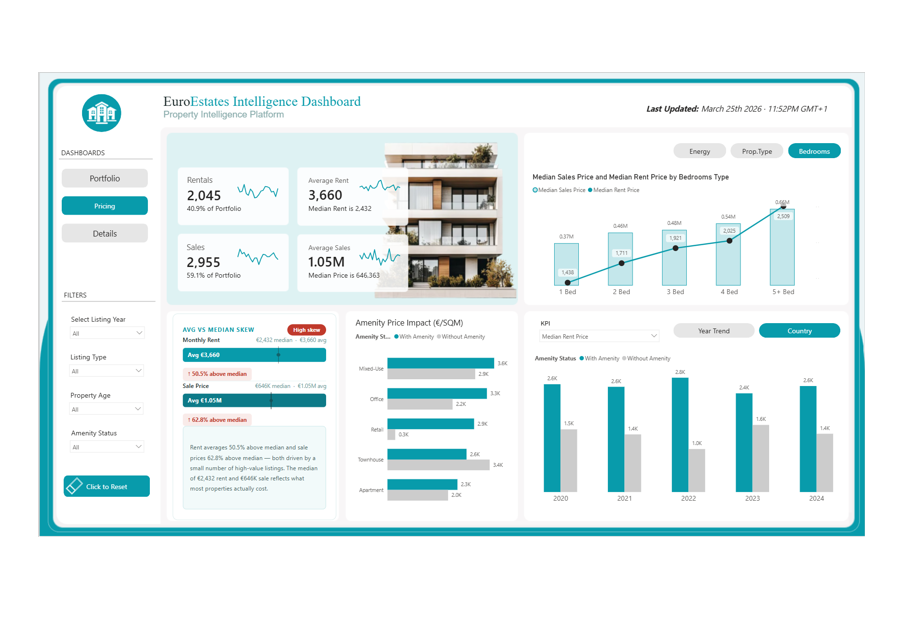
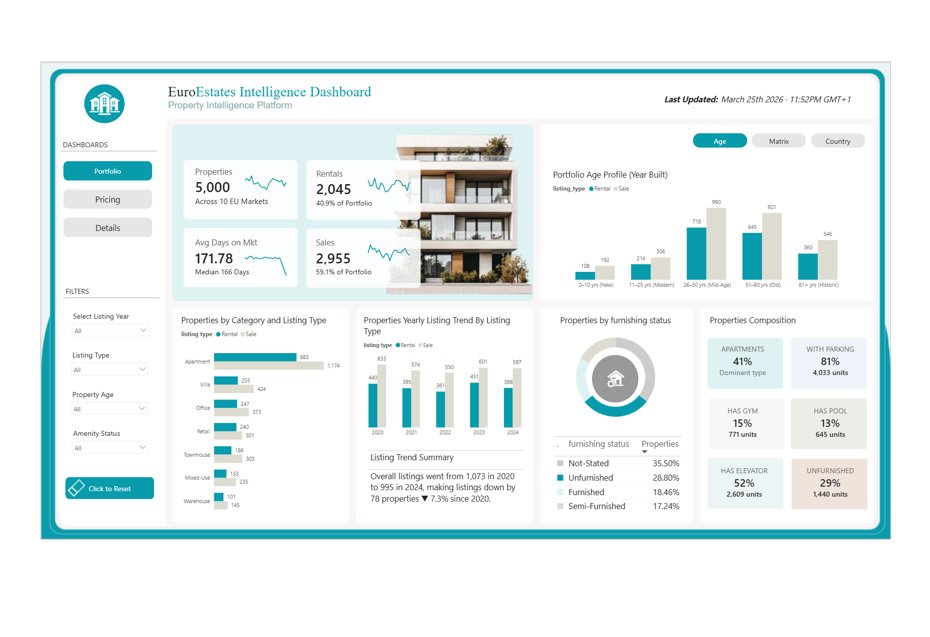
Real Estates Portfolio - Power BI Dashboard
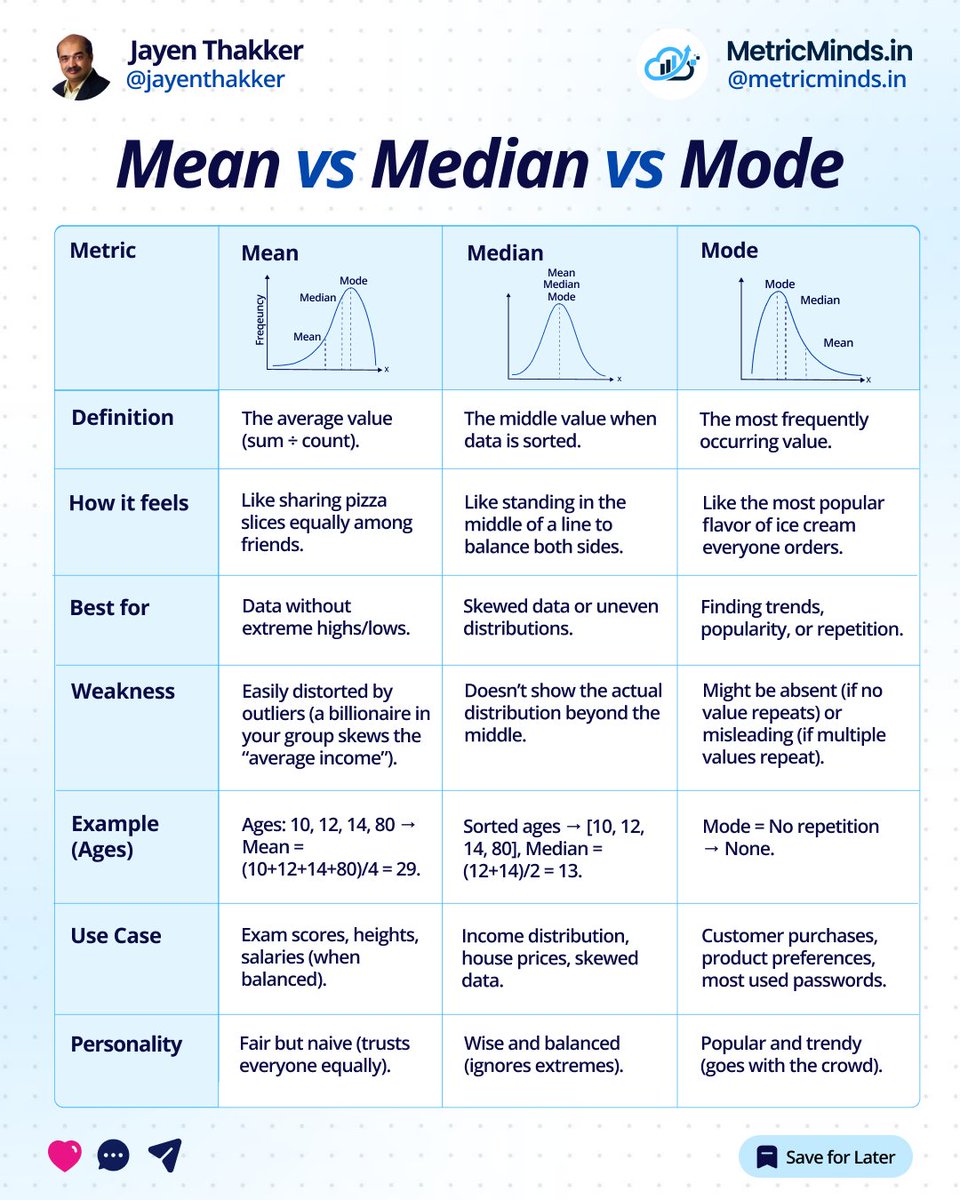
key takeaway: using median over average gives a more realistic view of housing prices.
Walkthrough Video: https://t.co/EVlB6taKT8
#PowerBI#DAX#RealEstate#DataAnalytics
I'm a Senior Data Analyst.
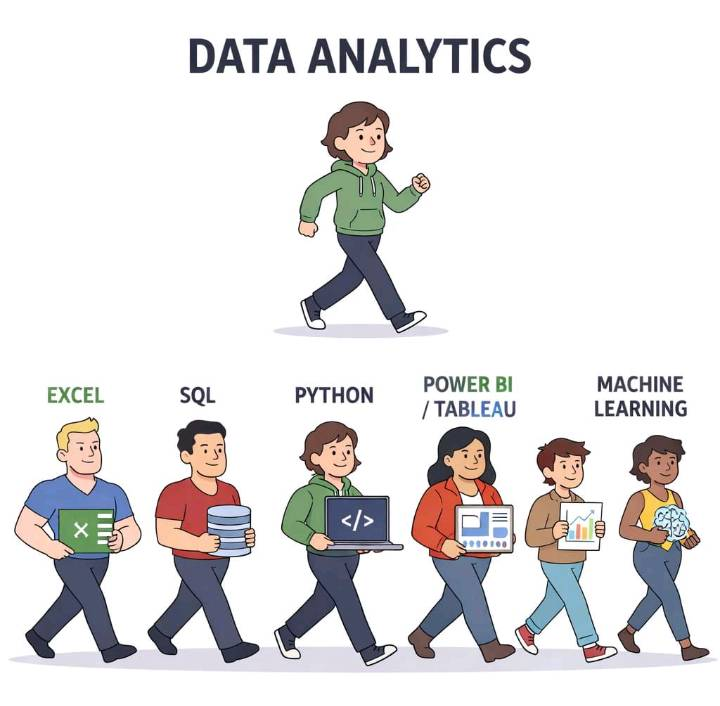
Don’t start with advanced tools.
Start smart:
Excel → see how data behaves.
SQL → see how data is stored.
Power BI → see how data tells stories.
The right order builds real skill.
Sequence > shiny tools.