Value Drop #1
Research → Hypothesis → Validation → Out-of-Sample Testing → Live Deployment.
The best edges I have tested that survived this framework:
• US Equities Drift with Volume Confirmation | IVB, ORB or IB Volatility Breakout | Timing Improvement using Orderflow Data
• Earnings Surprise Drift Effect | Paired with Sector Analysis
Congressional Trades Portfolio | Information Asymmetry
• Option Premium Harvesting | Implied Volatility > Realized Volatility
• Blockchain Intelligence Statistical Models | Mathematical DCA
These are not models I use because I like them.
They are supported by decades of academic research, validated across multiple markets and countries, tested by thousands of researchers and practitioners, and have demonstrated persistence across different market regimes and economic cycles.
PEAD, momentum, earnings drift, and related anomalies have been documented, replicated, challenged, and studied extensively for decades across global financial markets.
a citadel quant told me something that broke my entire trading framework
"we don't predict markets. we model the state machine"
he explained markov chains in 90 seconds
the market is never random - it always exists in one of three states
trending up, trending down, ranging - each has a fixed probability of shifting to another
build the transition matrix from real price data:
> trending up -> 68% stays trending, 21% flips to range, 11% reverses
> ranging -> 54% stays range, 28% breaks up, 18% breaks down
> trending down -> 61% stays falling, 24% flips to range, 15% reverses
now you're not guessing, you're playing probability
identify current state, enter with the 68% edge, size with kelly criterion based on that probability
the formula is public - markov published it in 1906
hedge funds use it, the math costs nothing
what costs you is asking the wrong question
"where is price going?" is random
"what state am I in right now?" has an answer
transition matrix built from 10 years of data is your edge
Bookmark it
not a signal, not an indicator - just conditional probability that compounds every single trade
Life cycle of an ICT trader:
1st year - watches 2022 mentorship videos, paper trades NY open every day for 8 months
2nd year - speaks only in acronyms now (FVG, OB, BPR, IFVG), consistently blowing prop firm challenges
3rd year - quits job convinced he's ready
4th year - back to 9-5
5th year - 2 green months in a row, declares himself "a consistently profitable trader," profile pic becomes a suit silhouette
6th year - $1,500 mentorship, private Discord, weekly livestreams where he never takes a live trade
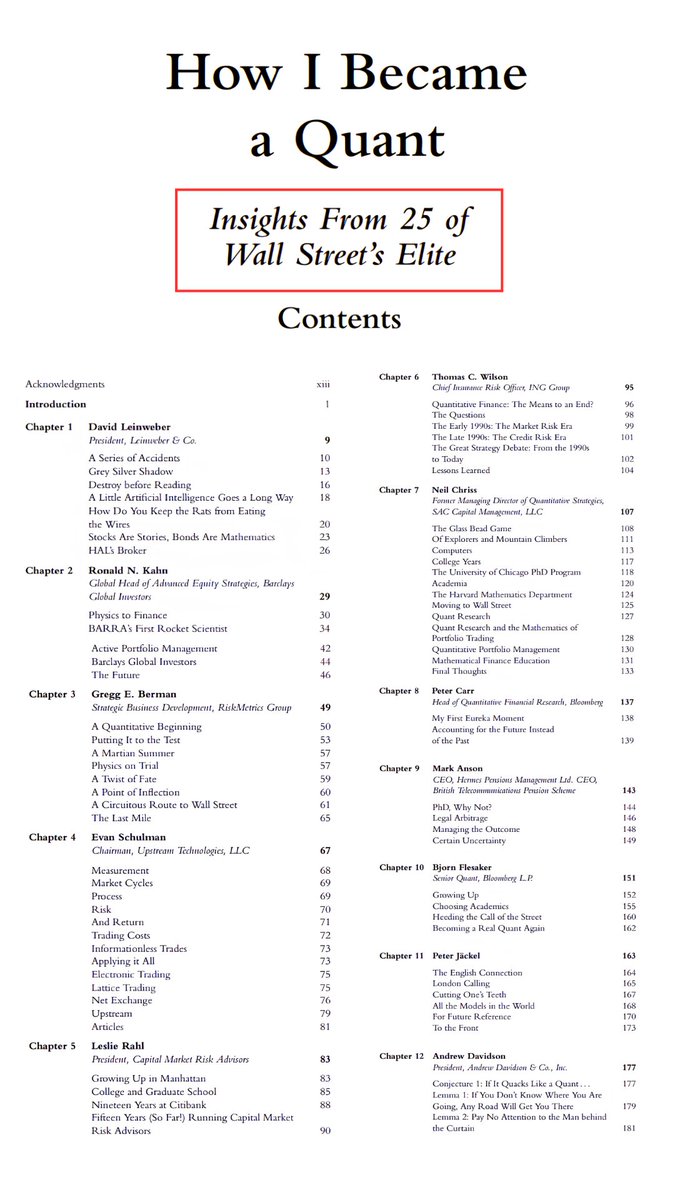
Jane Street pays $650,000+ a year for quants. 25 of Wall Street's most elite quants wrote the exact blueprint of how they got there & released it completely free.
25 Chapters. Zero to quant. Real careers from real people at the top. Bookmark this, before someone takes it down.
J.P. Morgan pays $650,000+ a year for quants. They built this exact Python training to get you there & released it for free.
Zero to quant directly from J.P. Morgan technologists. Bookmark this & read the article below before someone takes it down.
1/ Orderbook manipulation is not random noise.
Most traps leave footprints.
If you know how to read the DOM, heatmap, Time & Sales, CVD and 3D orderbook structure, the market starts telling a much deeper story.
Here are 12 major orderbook manipulation tactics every orderflow trader should understand. 🧵
Anthropic’s CEO when he saw this leaked 1-hour Claude course where some guy literally shows how he automated his entire business and makes $100K/year on autopilot
The introvert guy in a hoodie with a pack of Red Bull, elite Claude skills and relentless determination probably has a higher probability of creating generational wealth today than someone with 3 PhDs.
We entered an era where leveraged execution beats credentials.
The underdogs are my favorite.
These VWAP strategies will completely change how you trade.
In this guide you'll get:
- Indicator set up guide
- VWAP reversal and breakout trading strategy
- Real Trade Examples (not just theory)
I also made a full cheatsheet for you to download.
Enjoy.
POC Shifts
Good for developing an intra-day bias inside developing value.
Looking for consecutive shifts in the time point of control in a given direction.
The continuous shift signifies an imbalance in directional value.
Done inside a developing day.
...example below ↓
82 minutes of an MIT lecture on Volatility Modeling > 6 months of any trading course or guides on YouTube
You'll finally understand what conditional variance, GARCH and volatility clustering actually mean
Bookmark & watch, no matter what
80% of the traders confuse trend and balance and that’s why they get chopped or miss the move.
These are 2 environments you need to understand:
• D-Shaped Volume Profile (Balance Market)
This is where price is accepted market rotates within value, liquidity builds and no clear directional edge.
✅ Proper D-shape → Expect range / slow accumulation
⚠️ Failed D-shape → Close outside value = bias shift
❌ Not a D-shape → Messy profile = stay out
Rule:
In balance, be patient.
Wait for acceptance or rejection, not predictions.
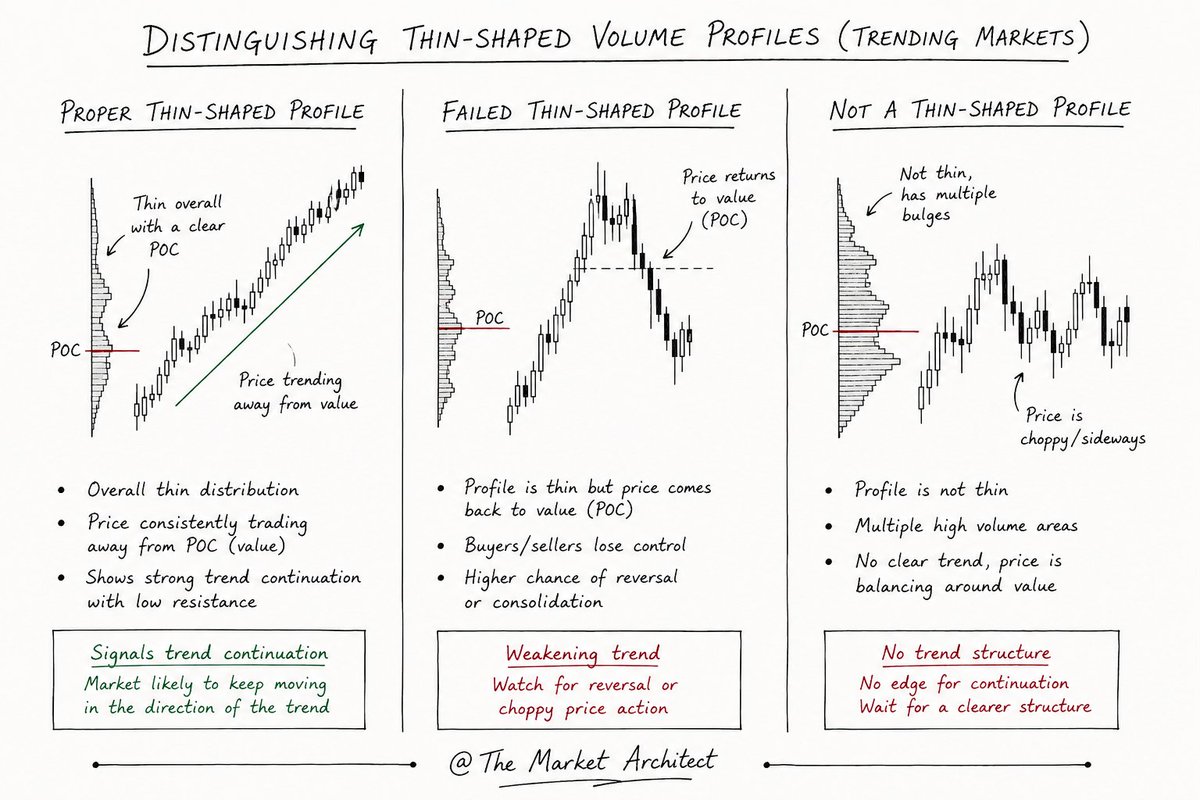
• Thin Volume Profile (Trending Market)
This is where price is rejected from value.
Price moves fast, low resistance and strong directional intent
✅ Proper Thin → Price leaves POC = continuation
⚠️ Failed Thin → Returns to value = weakness
❌ Not Thin → Multiple bulges = chop
Rule:
In trends, stop fading.
Trade continuation, not reversals.
Most traders: Trade reversals in trends ❌
Trade breakouts in ranges ❌
Smart traders: Trade rotation in balance and trade continuation in imbalance
Understand this and your win rate changes completely.