$ETH
Looks like wave (3) is finished. We've got a rapid sell off in wave (4) which is not a really good sign because we're already at the 50% fib level of support.
If the support holds and we could reach targets in wave (5) from 3,465$-3,596$
A break below would be bearish sign
$DOT
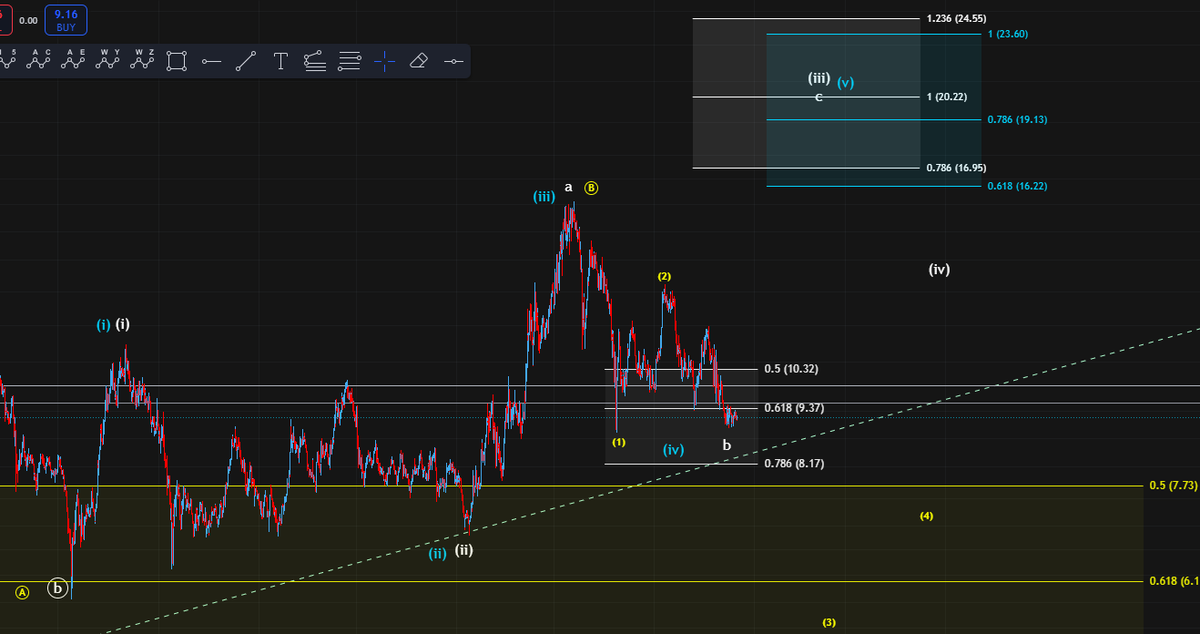
1. 4h-chart
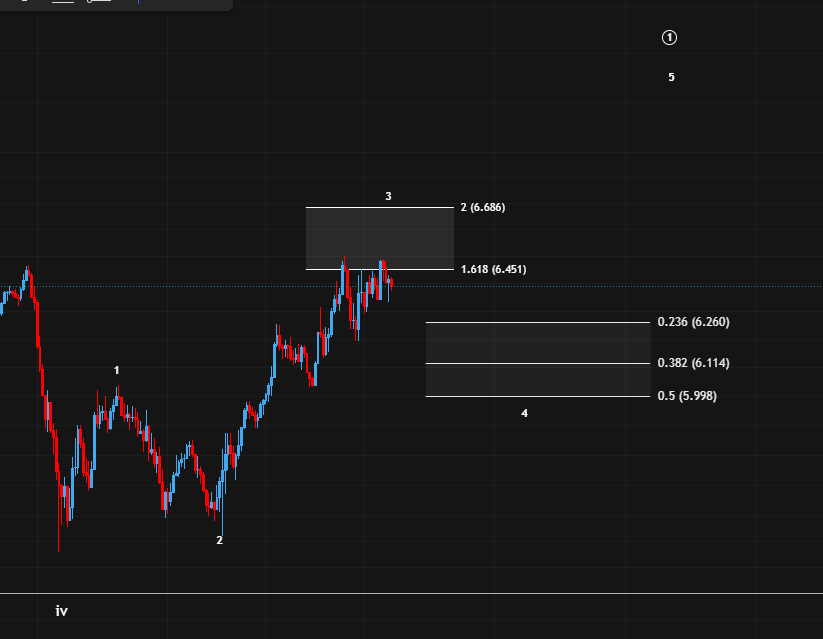
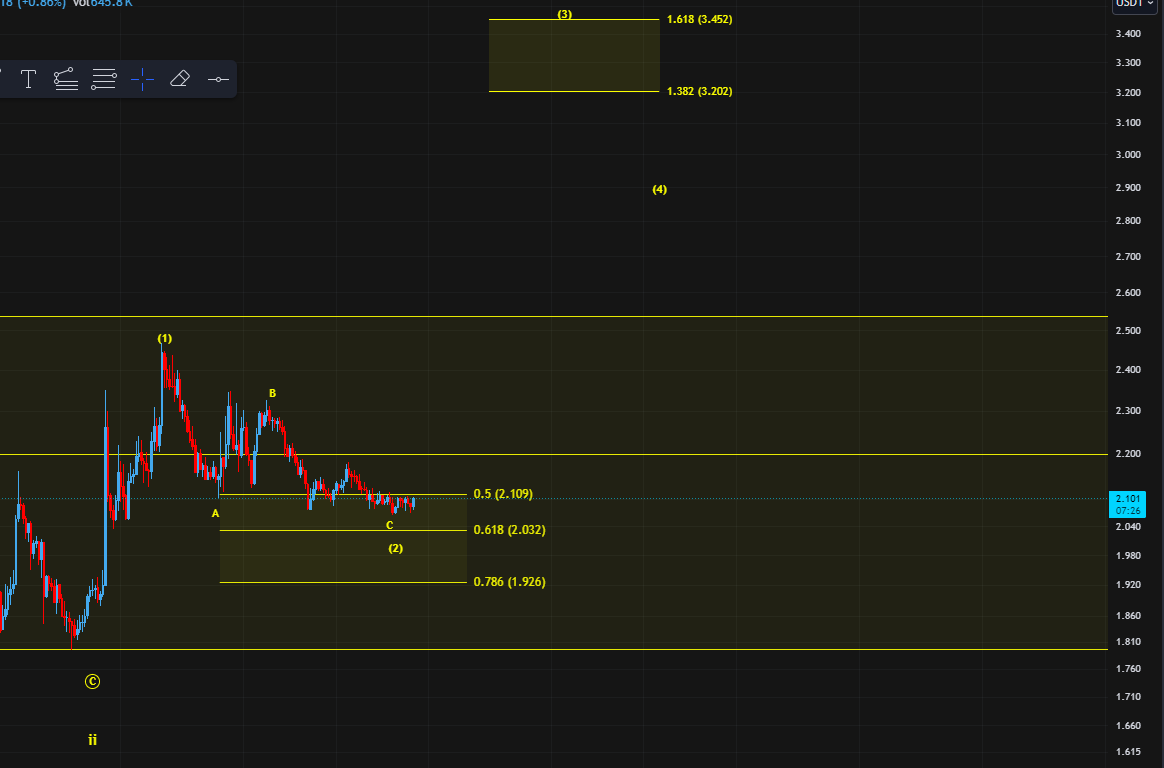
Expecting the price to climb to at least 12.08$. An optimal price target for wave (iii) is at 20$-25$
But before we can confirm a bottom we need to get wave 1 with a 5-wave structured followed by an ABC- structure in wav 2!!
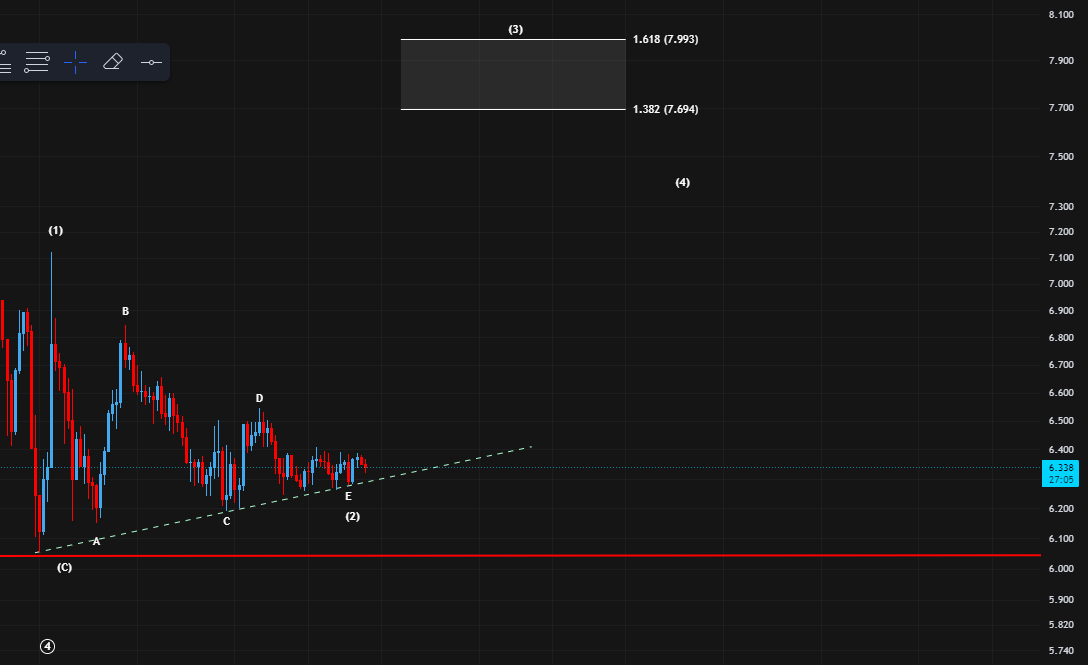
2nd picture 1h-chart
$BTC
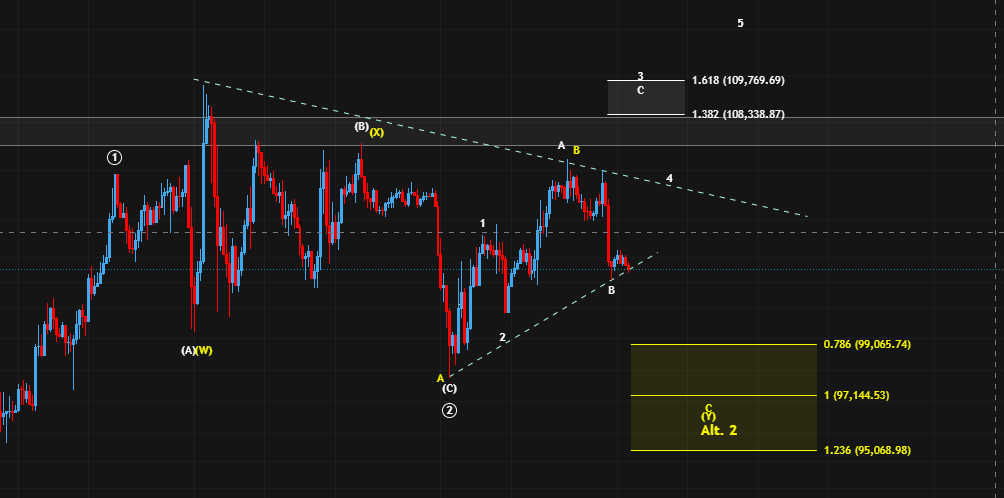
We're moving right at the trend line. A break below would confirm that we're dealing with the yellow count which support is at around 97,144$.
But if the trend line holds and we get some upwards momentum our next target is at 108,338$
$SUI
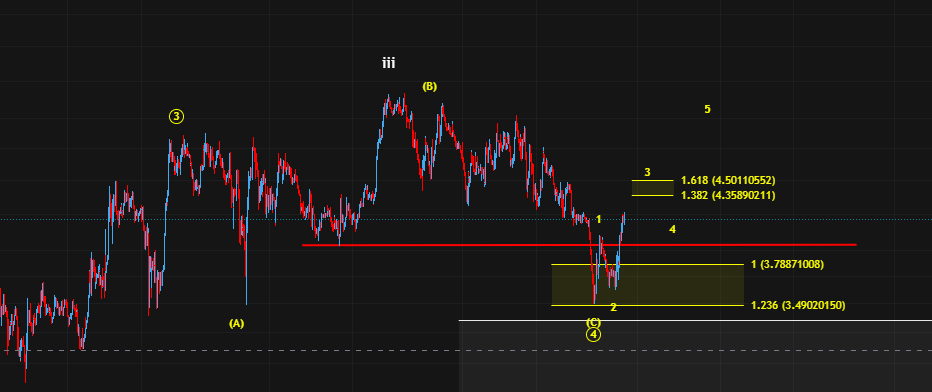
First sign that we're dealing with the yellow count. Next target in the yellow count is at 4.35$ and higher!
A break below 3.49$ would invalidate the yellow count
$XRP
We could make another low in #XRP which would bring us to around 2.92$.
But we could also already have finished wave 2 which would get confirmed with a breakout above the trend line!
$ADA
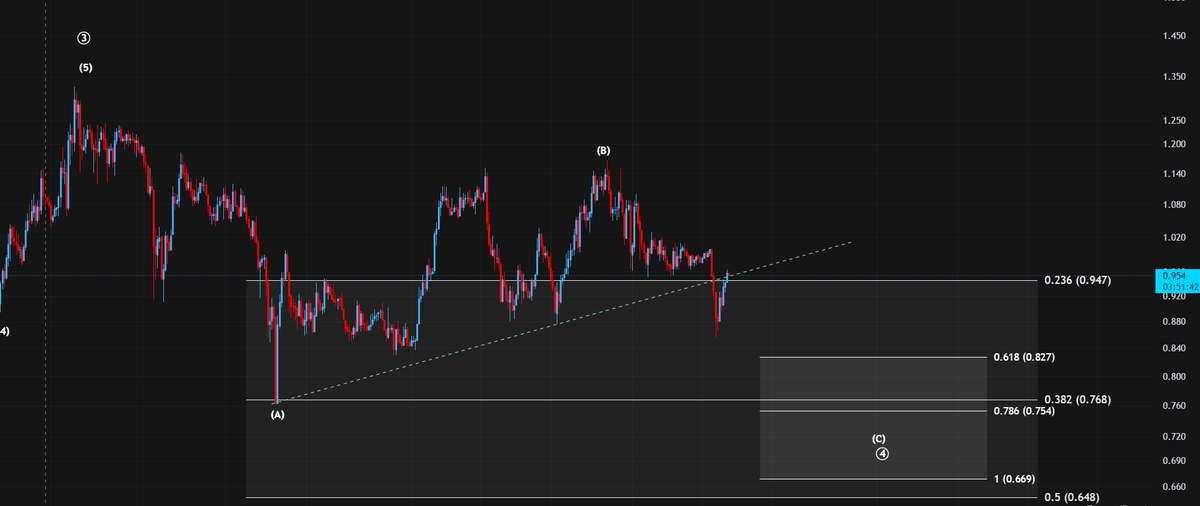
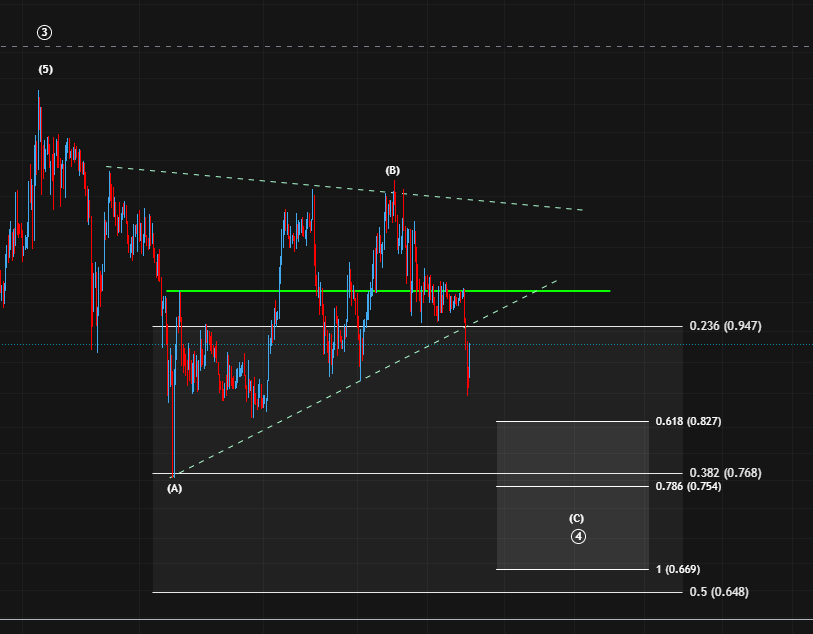
We broke below the trend line and directly retested it.
Now we have to look if we get rejected at the trend line or not. If yes then the next support is at 0.75$
$SOL
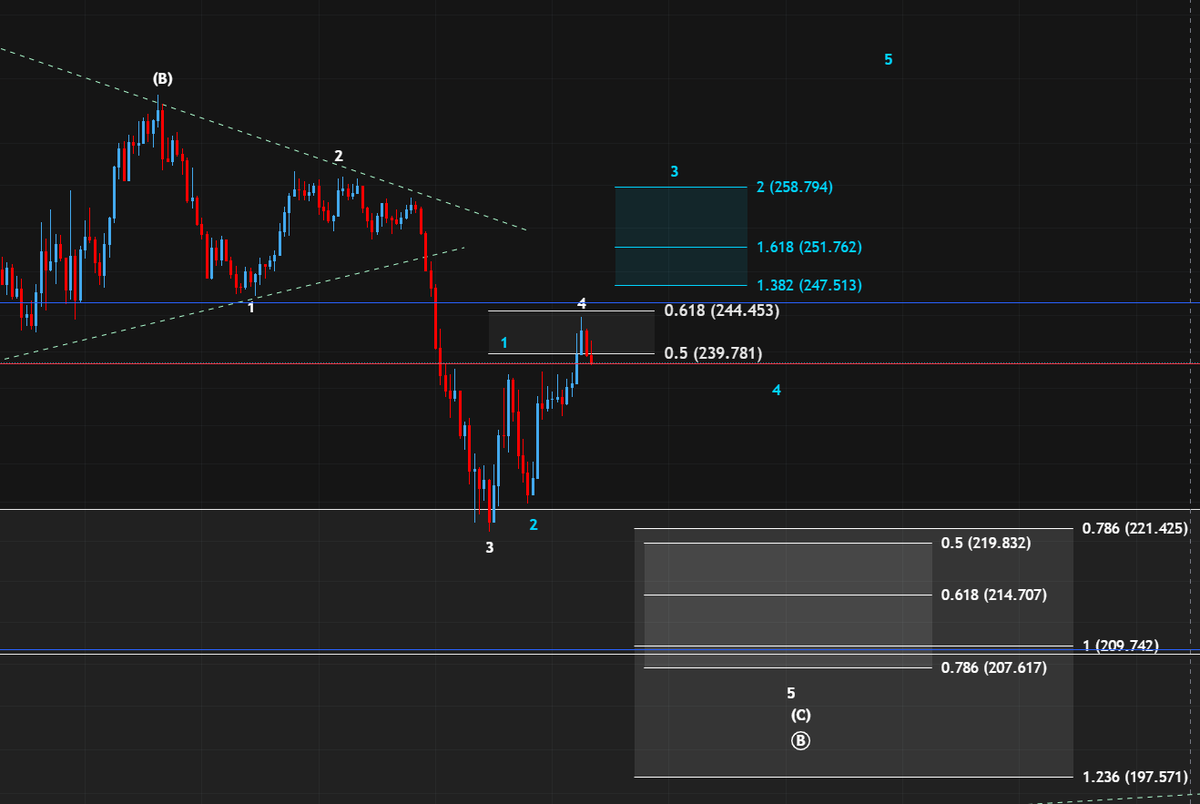
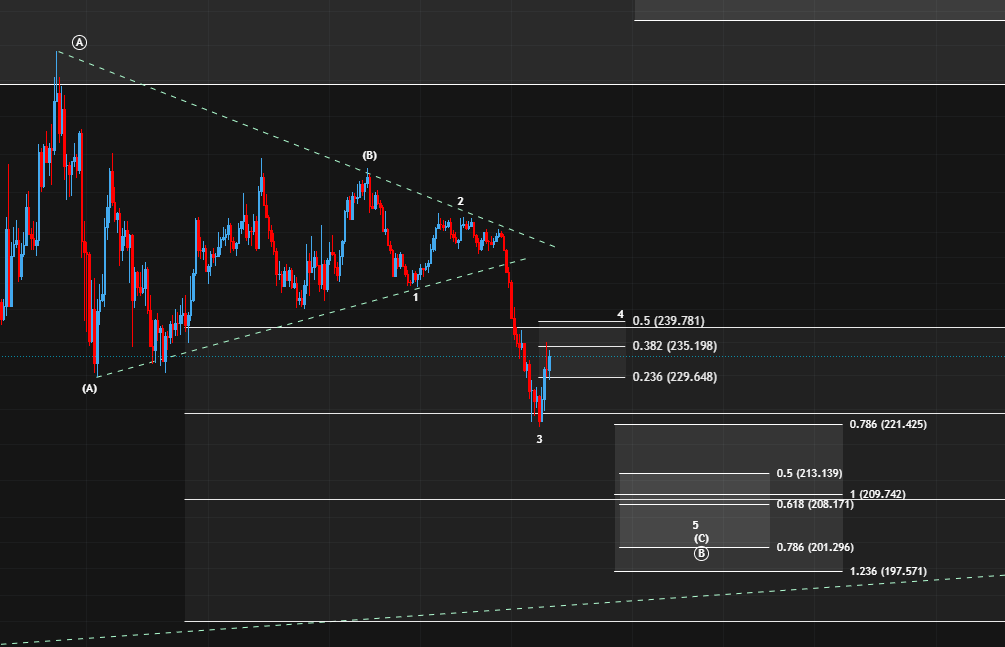
Until now we're in the middle of the resistance of wave 4. If we make a sustainable break above 240$ circle wave B is already finished and we could push higher!
If the resistance holds our next support is at 210$
$BTC
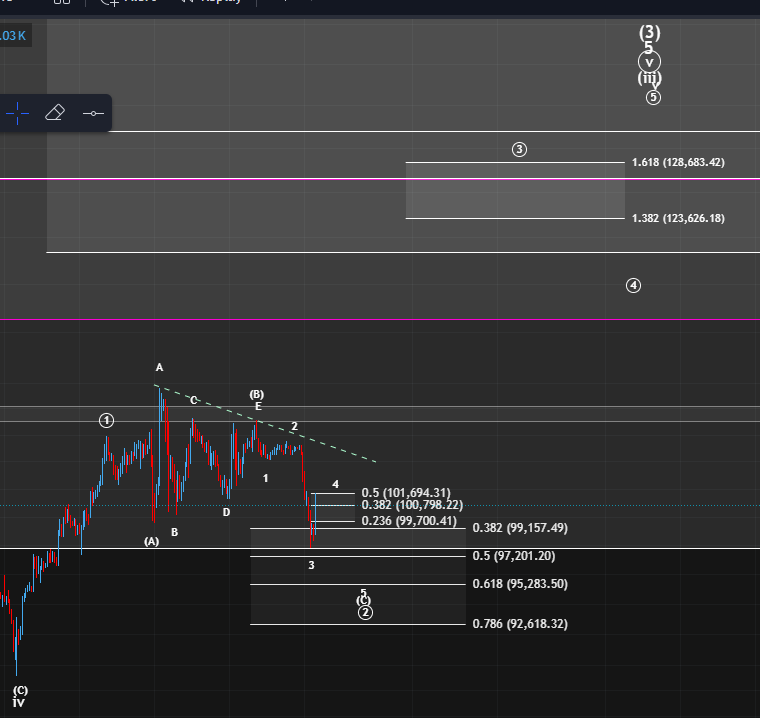
I'm expecting that we get one more low in wave (C). But we could also see a direct push because of the start of the NY session in 10 minutes!
But in both scenarios I'm expecting to push higher to around 123,626$
$ETH
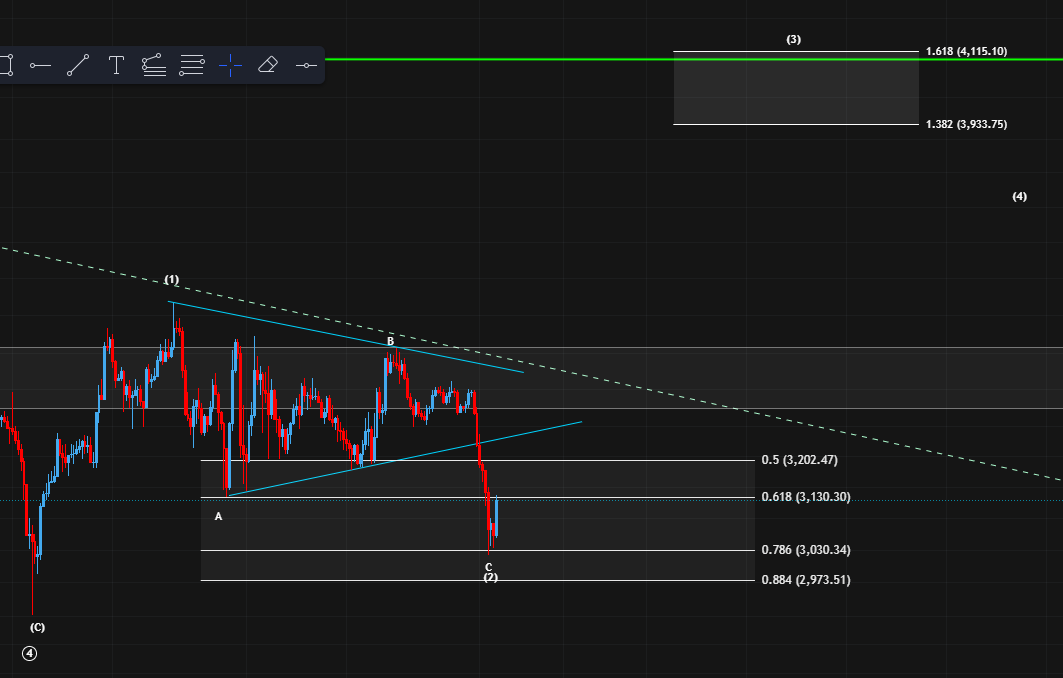
After the Black Swan Event because of #DeepSeek we got a reaction to the 78.6% Fib level!
We now need make a sustainable break above the trend line to confirm a bottom!
Wave (3) target is now at 3,933$
$TAO
Is this the reversal sign we were waiting for all the time?
It's a first good sign but we still need to make a sustainable break above the trend line before calling a possible bottom!!!
$ICP
The chart is still shows no reversal sign.
As long as we trade above the trend line our blue and white counts are possible.
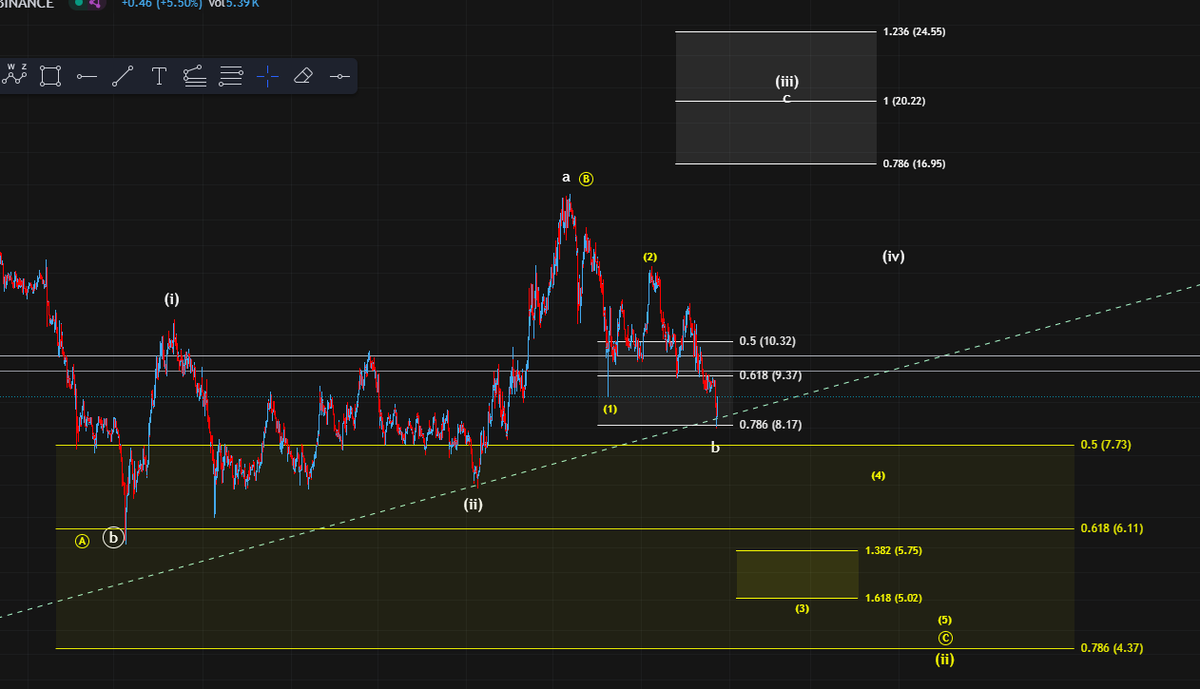
A break below would indicate that we're dealing with the yellow count which could bring us back to around 5$
$DOT
Like on many altcoin charts it looks like we're also working on an triangle pattern in wave (2).
Target for wave (3) is at 7.69$
A break below the red line (around 6$) would be a sign for a more bearish structure!
$SOL
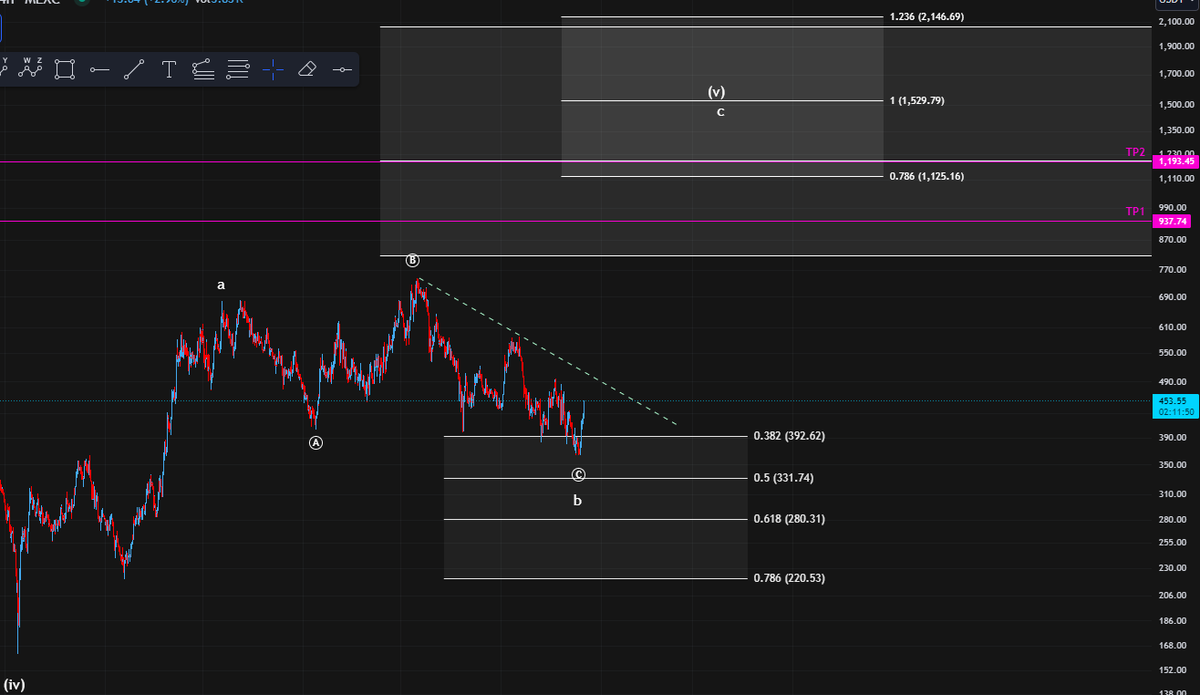
We're could work on an ABC-Structure in the wave v.
In the blue count the circle wave B is already finished and we could push higher to around 400$
In the white count we could get one more low in circle wave B which could bring us to 211$. The next target would be at 366$