👁️ Welcome back, @Visual_eyed!
The website, powered by Dalk and TVA and developed by @ShiroiStudio, is now completely renovated.
You will find the best data journalism projects out there, together with a collection of original articles.
🔗 https://t.co/c6wDsjKKnB
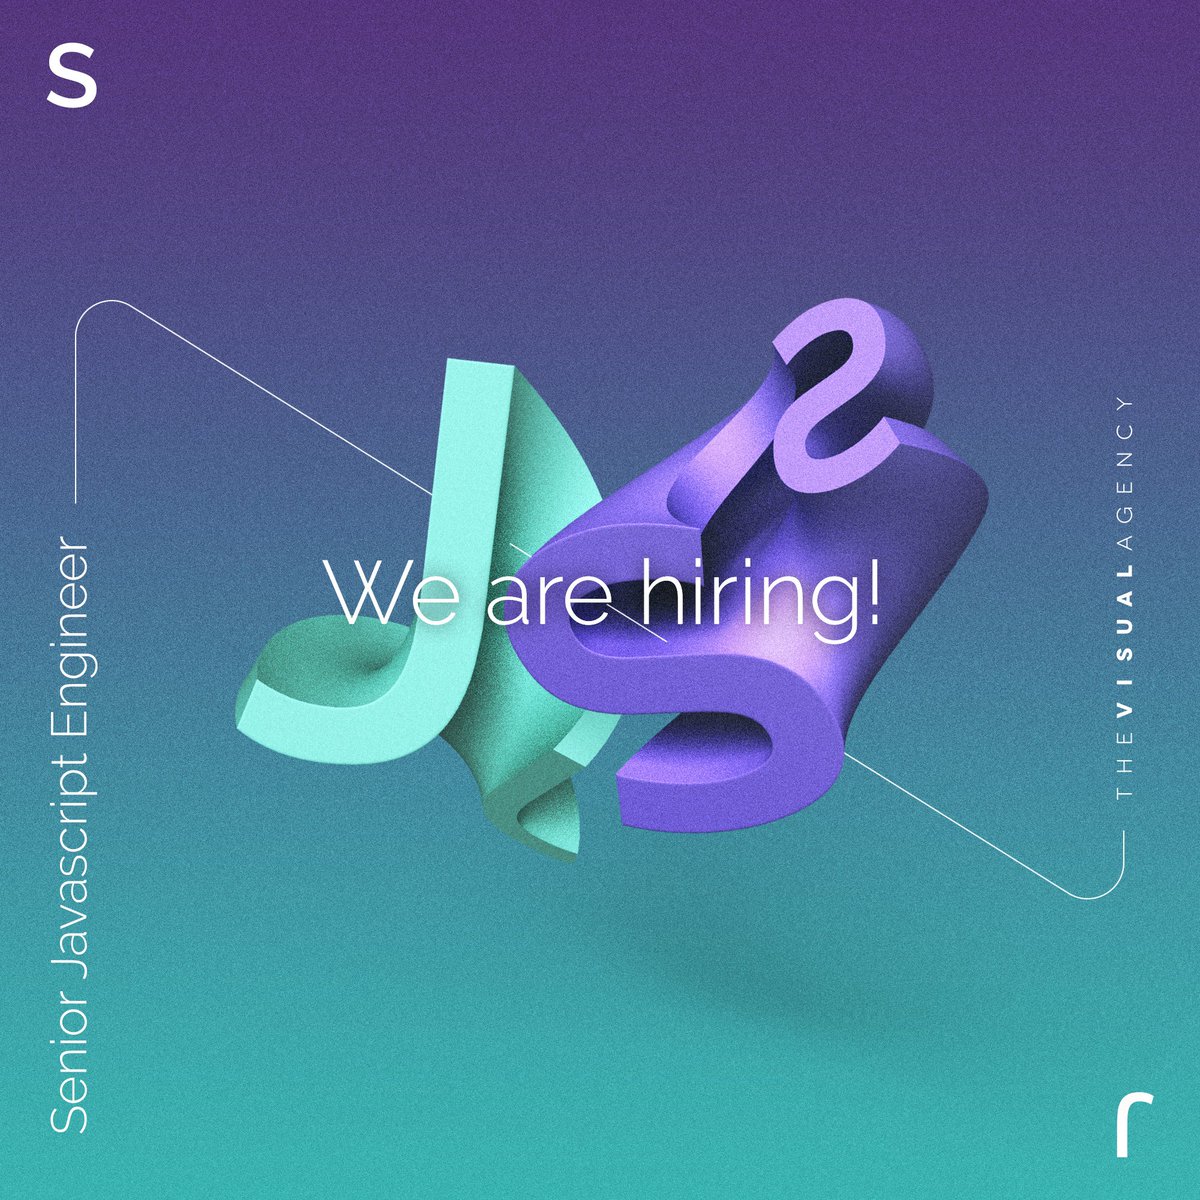
We are looking for a senior Javascript engineer to join our team.
Main tasks: developing data-driven web applications and dashboards for data visualization.
🔗 If you think you do the trick, submit your application here: https://t.co/juGOq05CqE
#Javascript#developer
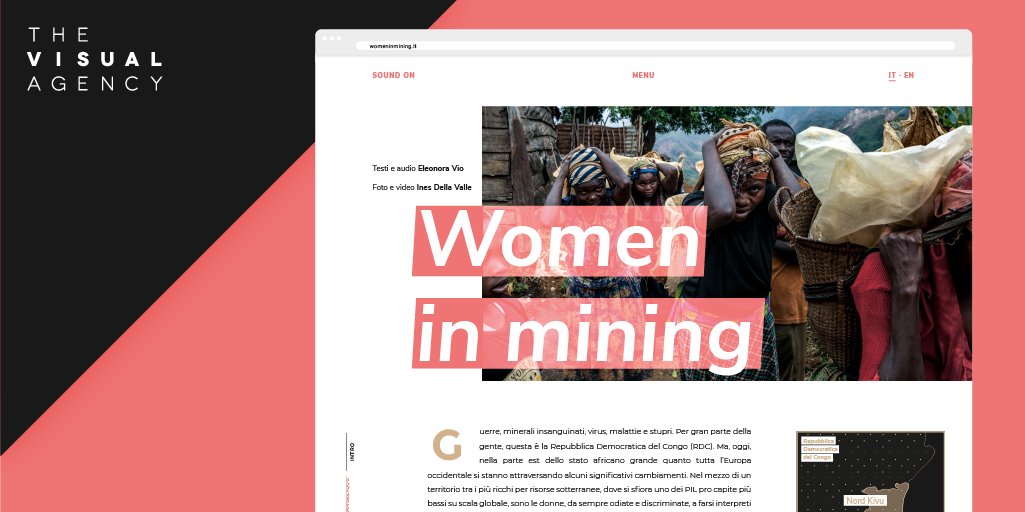
Three years after the beginning of https://t.co/YASKP7btvf now online one of the biggest projects we worked on, thanks to @NawartPress to let us design your amazing experience in Congo. (Design credit: @sbennii@frenk1196) https://t.co/0y5cQjKj5F
"Women in Mining", a moving tale by @NawartPress about women involved in the mining sector in the DRC, become an impressive and cutting-edge longform thanks to the all-around designers of TVA team.
🔍 Link: https://t.co/sH7Xp0ztIf #dataviz#datavisualization#datajournalism
⛰ This great atlas explores the extraordinary environmental and cultural world of The Appenines! @SymbolaFondazio engages us to design this book full of📊 #infographics and 📍#maps! Discover more: 👉https://t.co/5vKl9lAQU7
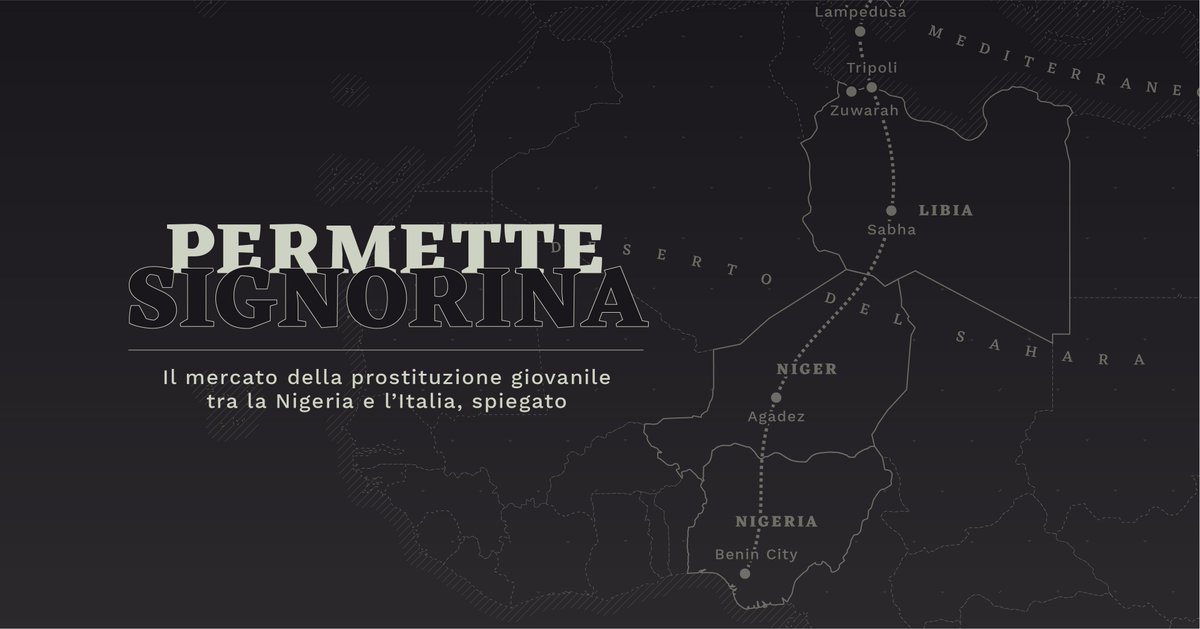
La tratta di ragazze dalla Nigeria all’Italia a scopo di sfruttamento sessuale: ecco l'ultimo progetto di visual journalism che abbiamo curato, realizzato con il nostro spin-off @Visual_eyed e pubblicato su @sole24ore 👉 https://t.co/XBdLxWdWbf