@_MaxO22_ May I ask you, how much time you spend in average daily for your trading (charting, building theses,...)? I think thats my biggest fault, by spending to much time things becomes complicated 🤣
“Mate, how do you actually use Volume profile or AMT when looking at a chart? Anything more I can learn?"
Ok guys, let's drop the whole framework with the hope that you may find interesting ideas to apply to your journey/trading. (❗️Brutal value below❗️)
Disclaimer: As always, everyone has a different style and the goal is not copying someone else's strategy but building a process that provides statistical advantage over time (after backtesting).
What works for me might not work for you depending on timeframe, goals and availability.
(Quite long post, if you're lazy skip it (but don't expect results/improvments)
🔸 1st step -> Understanding what Volume Profile actually represents.
Volume Profile is simply the distribution of traded volume across price levels, not across time like traditional volume bars.
This allows you to see where the market actually accepted value and where it rejected it.
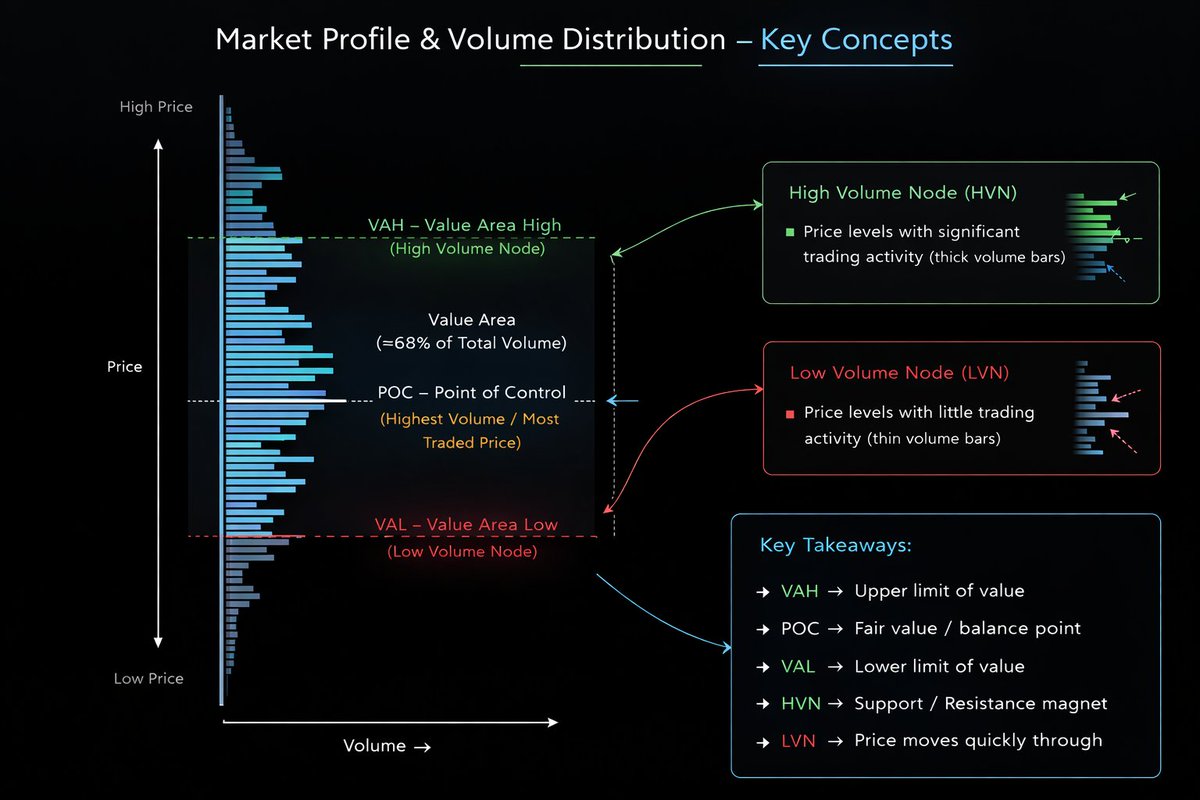
From a basic perspective, there are 3 important elements:
• POC (Point of Control) → the price with the most traded volume
• Value Area (VA) → where roughly 68/70% of the trading activity occurred (divided into VAH and VAL)
• High Volume Nodes (HVNs) → areas of acceptance
• Low Volume Nodes (LVNs) → areas of rejection or inefficiency
HVNs act like magnets for price because they represent equilibrium where buyers and sellers previously agreed on value.
I like to think, instead, about LVNs as "highways" where price tends to move quickly due to the lack of prior transactions.
Already here you can start understanding why the market often accelerates through certain areas and slows down around others.
🔸2nd step -> Auction Market Theory
Markets are basically continuous auctions between buyers and sellers.
The market constantly asks a question:
“Is this price fair?”
- If participants accept the price → the market builds value.
- If participants reject the price → the market moves to find a new fair value.
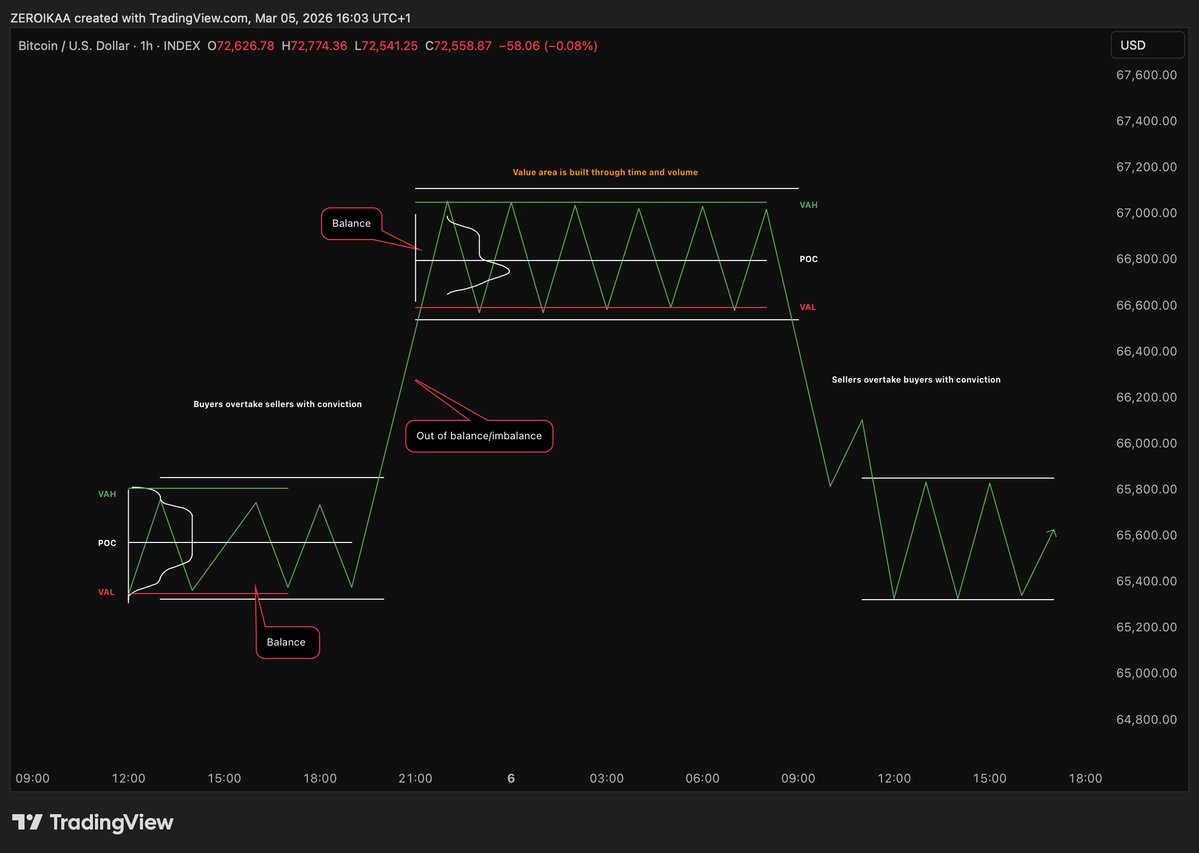
This creates 2 fundamental environments:
- Balance (equilibrium)
Price rotates inside value areas and HVNs.
- Imbalance (discovery)
Price leaves value and searches for a new fair value.
Recognizing when the market is balancing vs discovering is one of the most simple yet powerful concepts in trading.
If the market is balanced → expect rotations.
If the market is imbalanced → expect continuation.
🔸 3rd step -> reading the shape of the profile
This is something that usually gets unnoticed.
Volume profiles often form recognizable structures:
• D-shaped profile → balanced market, rotation
• P-shaped profile → short covering -> bullish continuation
• b-shaped profile → long liquidation -> bearish continuation
• Double distribution → market transitioning between 2 value areas
The shape of the volume tells you what's happening in the auction.
"Eh? What do you mean?"
For example:
A P-shaped profile has higher probability of appearing after aggressive short liquidations where the market rallies and then builds value at the top -> based on context it's a bullish sign -> why? -> If the market holds the upper value area, it suggests that after shorts were squeezed, new buyers are accepting higher prices.
A b-shaped profile usually appears after longs get trapped and forced to exit -> based on context it's a bearish sign -< why? -> If the market accepts lower prices after the liquidation, it suggests new sellers are active, not just liquidation.
These structures help you understand who is trapped and where liquidity might sit, forming a bias.
🔸4th step -> Identifying volume voids
One of the most powerful concepts is the Volume Void.
These are areas where very little volume was traded.
Because the market previously rejected those prices quickly, when price re-enters these zones it often moves very fast.
You will see tht volume voids frequently align with:
• FVGs
• Impulsive candles
• Liquidity sweeps
When multiple inefficiencies overlap, the probability of fast price movement increases significantly, so you can use them to your own advantage.
🔸 5th step -> Value migration
Another key AMT concept is observing how value shifts over time.
- If the POC and value area move higher, the market is accepting higher prices → bullish context.
- If value migrates lower, the market is accepting lower prices → bearish context.
In this GBP/USD example I made you can clearly see the migration of value + the concepts explained.
However, in my experience the real edge comes when price moves away from value too aggressively.
Markets tend to revisit previous value areas because auctions like to rebalance unfinished business.
That's why many large moves eventually retrace toward prior POCs or HVNs.
🔸Sixth step -> Combining VP with price action
Volume Profile alone is not enough, nor it will ever be.
It becomes powerful when combined with:
• S&D zones
• Liquidity pools
• MS (HH/HL or LH/LL)
• FVGs or inefficiencies
Example:
Price sweeps liquidity above a swing high → enters a LVN → rejects from a HTF supply zone.
That confluence creates a much stronger trade idea than using any single tool, in my experience.
The profile simply provides context about where the auction is strong or weak.
🔸 Seventh step -> Execution
The most important step, isn't it?
Once the levels are mapped, I usually monitor:
• Reactions at HVNs or POCs
• Fast moves through LVNs
• Acceptance or rejection outside value areas
• Value area shifts
- If price re-enters value after a breakout, there's a high probability of a rotation across the value area.
- If price accepts above or below value, the market has a higher probability for starting a new auction.
Based on this I plan my longs and my shorts but also (and that's probably the most important part) I adjust the stop loss in a dynamic manner, meaning that I wait for the price to test and to be rejected from a value area before moving my stop depending on my bias (long🔼 or short 🔽)
That’s basically the framework I use when incorporating Volume Profile and AMT into my analysis.
It's pretty much logical that you need time to assimilate these concepts, but to me and for my style they're the best I can use, so I highly encourage you to study them.
They don't replace price action, but they reveal the structure of the auction behind it, which is ��
As always, if you found this helpful, the like and repost buttons are just a few centimeters below.
@_MaxO22_ I took some time of which helped me to see what I made wrong over the years. Know I have to find a way to improve and to avoid the same faults again
@CryptoChase02 Very true, but this takes also some time learn when you come from a Hodler.
I'd like to ask you something. If we get a bounce on alt's in the coming weeks, it's most propably not the final bottom. Do you expact that thos key levels hold again our will we head much lower.
@_MaxO22_ Max I´ve found your account last week. I´ve watched a couple of your video´s the last days. I really like and appreciate your style. Thanks for sharing!