#XAUUSD#GOLD
The weekly trend remains bearish. Gold has spent the week moving lower, breaking structure, and reacting weakly from the lower zone. Buyers are trying to defend the floor, but they still need confirmation above 4,037 and 4,082 - 4,098 to prove strength.
If price holds the current reaction zone, a short-term corrective rebound can still develop. But if gold fails below 3,980, the next bearish move toward 3,950 may continue.
For now, the best approach is to wait for confirmation around 4,037 and 3,980 instead of chasing price in the middle.
#Gold is currently trading around 3,989 after reacting from the strong liquidity zone near 3,964. The main trend remains deeply bearish, supported by the descending trendline and multiple BOS signals on the chart.
The 3,964 area is the major downside level to watch. If price breaks below this zone with strength, bearish continuation may open toward lower liquidity levels.
However, if gold holds above the 4,008 trendline area and forms bullish confirmation, a corrective rebound can happen first. The nearest upside reaction zone is 4,036, followed by the next target around 4,083.
The key sell area above remains the OB zone around 4,180 - 4,200. If price recovers into this zone and rejects, sellers may return again for the next bearish leg. #XAUUSD
#XAUUSD#gold
Current Gold Trading Recommendations:
Strategy 1: Sell gold in batches around 4140-4150 with 20% of your position, stop loss at 4170, target 4100-4080, and if it breaks through, look for 4050.
Strategy 2: Buy gold in batches around 4050-4060 with 20% of your position, stop loss at 4035, target 4100-4130, and if it breaks through, look for 4150.
#Gold#XAUUSD
Gold continued its decline on Tuesday, falling to $4110. We remain focused on a break below $4100 or even lower!
If gold holds above $4170, or even below $4140, during the European trading session,
consider selling gold, with a target price between $4100 and $4080-$4060.
#XAUUSD
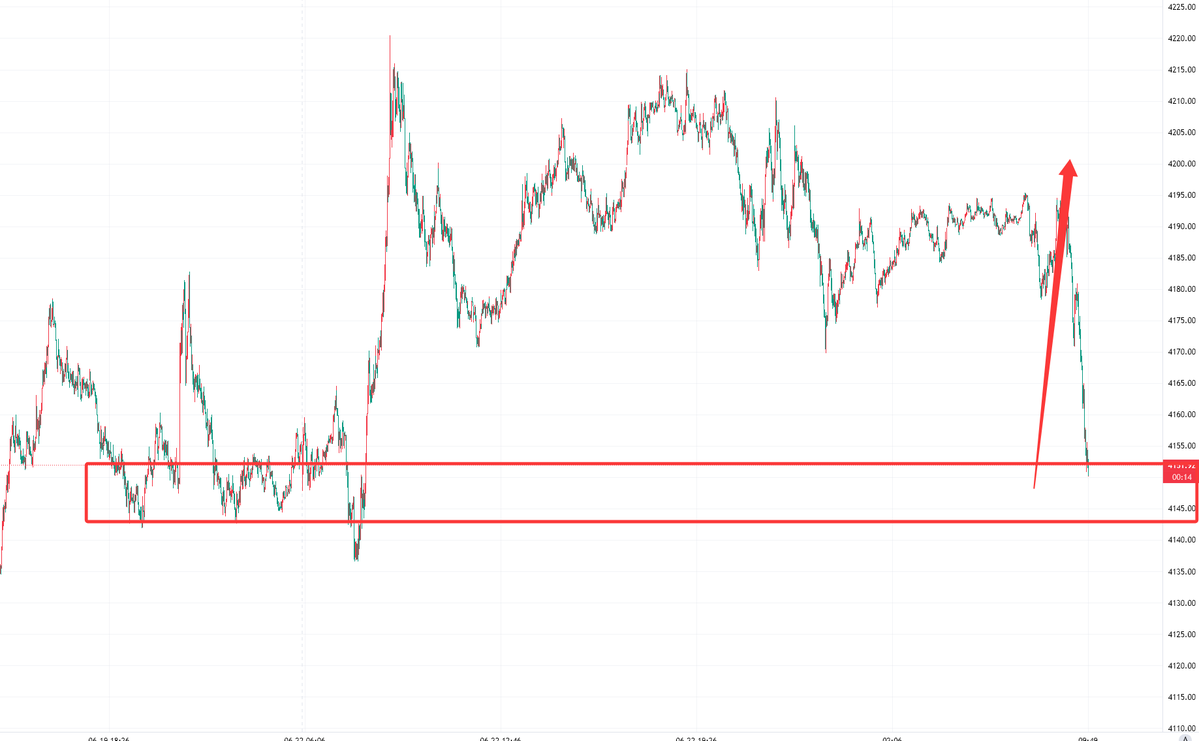
Resistance & Supply Zones
The upper half of the chart showcases a broad Supply Zone where strong selling pressure consistently re-entered the market.
Major Resistance ($4,210): This is the ultimate double-top structure formed early in the chart session. Price aggressively rejected this level twice, confirming massive institutional sell orders sitting at this psychological ceiling.
Current Resistance Zone ($4,198): A minor distribution area that capped the final buying relief rally just before the massive downward expansion began.
Key Structural Pivot / Role Reversal Zone ($4,180 - $4,190): This is arguably the most important historical area on the chart. It repeatedly flipped between floor and ceiling. It acted as solid support early on (marked by the green Test and Touch arrows) before being broken sharply around 03:00, turning it into a textbook resistance level.
2. Support & Demand Zones
The right side of the chart illustrates an aggressive bearish expansion breaking through historical support floors into a deep Demand Zone.
Interim Support ($4,152): A minor internal structural level that offered a brief pause and a small counter-trend scalp setup during the crash before giving way to the bears.
Major Support / Demand Zone ($4,130 - $4,136): This represents the current structural floor. Price collapsed heavily into this green block, which is currently undergoing intensive testing (marked by the Test arrows near 06:00).
3. Market Outlook & Trading Strategy
The market structure is firmly bearish (Markdown Phase) on this timeframe, characterized by a massive impulsive drop below the $4,180 pivot line.
Bearish Scenario: If the price breaks cleanly below the current $4,130 Demand Zone, it indicates a continuation of the macro downtrend, opening up room for deeper sell-offs.
Bullish/Retracement Scenario: Because the market is severely extended to the downside into a major demand zone, a technical relief bounce is highly probable. Aggressive buyers will look for long scalps targeting a retest of the $4,152 Interim Support or even a deeper pullback back up to the $4,180 structural pivot to mitigate the imbalance.
#XAUUSD#gold
Gold has currently fallen from around 4190 to around 4150.
The support level is around 4142-4130.
Therefore, you can now buy around 4150 with targets of 4160-4170-4180-4200.
#XAUUSD#gold
The current overall trend for gold is bearish. Today's intraday movement is merely a correction after a sharp drop, not a trend reversal. Strong resistance lies at 4200-4220, while short-term support is at 4140-4150. 4100 is a key support/resistance level this week. The price is likely to rally encounter resistance and pull back. Only a sudden positive geopolitical development could trigger a brief rally. Avoid chasing the market higher; prioritize shorting on rallies, and only consider small long positions after a pullback to support and stabilization, always with strict stop-loss orders. Tonight, pay close attention to the US dollar, US Treasury yields, the Middle East situation, and inflation expectations. A decisive break below 4100 would open up significant downside potential.
Short-term trading range:
1. Short at 4200-4210, stop-loss at 4225
2. Long at 4140-4150, stop-loss at 4130
#XAUUSD
Gold is currently in a key consolidation range, with the core trading range for the day locked at 4180-4220.
1. If gold prices stabilize above 4220, the bulls will likely continue their rebound, with a short-term target of the 4236-4252 resistance zone.
2. After reaching the 4236 and 4252 resistance levels, the upward momentum is likely to slow, and short positions can be established. Strong resistance remains around 4270.
#GOLD
#XAUUSD#gold
The sell signal around 4220 has now reached around 4195, successfully dropping 20 points.
Today, we continue to focus on the 4140-4220 range. Short-term traders can continue to buy low and sell high within this range.
If you need more accurate signals, you can contact me.
#XAUUSD#GOLD
🚨🚨
The Iranian military announced the closure of the Strait of Hormuz.
The central headquarters of the Iranian Armed Forces, Khatnam Anbia, stated on the 20th local time that the Strait of Hormuz would be closed to all shipping.
Gold prices are expected to decline again next week, while crude oil prices are expected to rise.
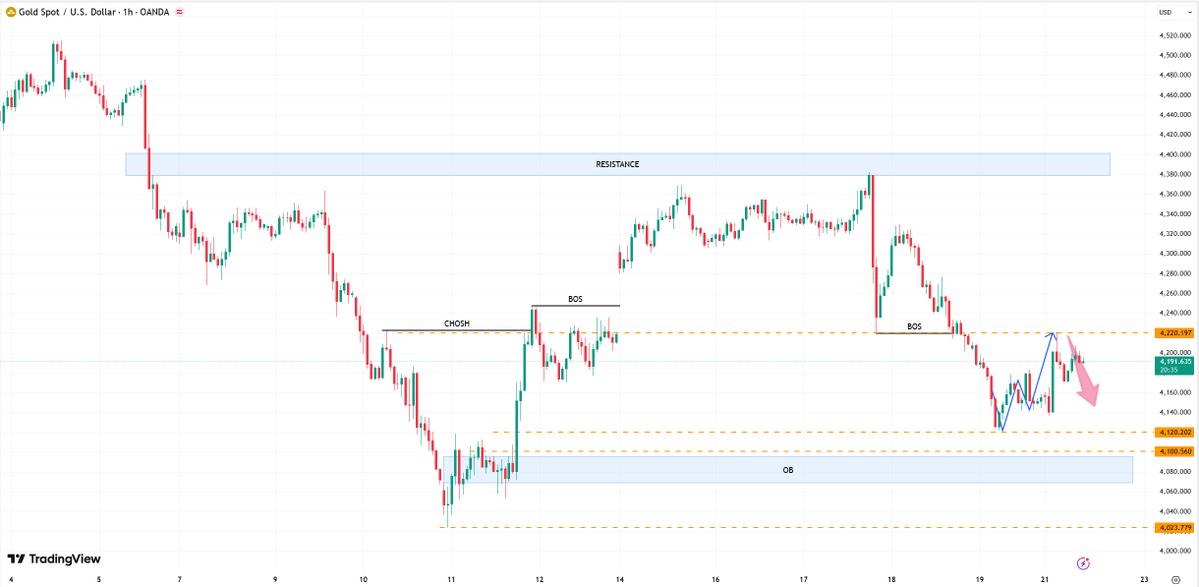
#Gold remains under bearish pressure after sweeping buy-side liquidity near 4,378 and forming a strong rejection. The subsequent impulsive decline broke market structure around 4,220, confirming a bearish shift in order flow.
The current structure is printing lower highs and lower lows, while price trades beneath the broken ascending trendline. As long as the market remains below 4,230, the path of least resistance favors further downside.
There are currently two sales areas: 4170-4190 and 4210-4230.
Have a great weekend! Like and follow, I'll always be with you! #XAUUSD
#XAUUSD#GOLD
The optimal selling point is currently in the 4200-4220 range, with a stop-loss at 4230.
This could yield a profit of 200 points, or even 500 points, or more.
Good luck! Like and follow for more related content.The optimal selling point is currently in the 4200-4220 range, with a stop-loss at 4230.
This could yield a profit of 200 points, or even 500 points, or more.
Good luck! Like and follow for more related content.
#XAUUSD
Market Structure & Trend Dynamics
Strong Intraday Downtrend: The market has been under persistent bearish control, guided by a clean, descending blue Downtrend Line that repeatedly rejected buyers trying to drive a reversal.
Failed Breakout Attempt: Over the session, price attempted a temporary "Downtrend Break" above the diagonal line. However, this recovery quickly failed as sellers stepped back in at the 4,180.000 Pivot Point, turning it into a new overhead resistance and forcing the market into a fresh leg lower.
2. Overhead Resistance Zones
Major Resistance / Range Top (4,310.000): Marked by the solid red line at the absolute top of the chart framework, representing the macro ceiling of the broader price structure.
Key Resistance Zone (4,260.000 – 4,280.000): Shaded in red, this area contains historical consolidation highs and a major failed breakout level where buying pressure was fully exhausted.
Pivot Point S/R (4,180.000): Marked by the solid orange line, this is a vital structural flip level. Formerly acting as an old floor support, it has now firmly flipped into a solid intraday resistance ceiling.
3. Key Downside Support Floors
Key Support Zone (4,140.000 – 4,160.000): Shaded in green, this represents a crucial area of recent price consolidation and a primary target area for buyers looking to accumulate long contracts.
Major Support / Key Floor (4,120.000): Marked by the lower solid green line, this acts as the final macro protective line for buyers within this immediate sequence.
4. Current Price Action & Outlook
Current Price: Sits at 4,135.905, with the market actively retesting the Key Support Zone.
Short-Term Outlook: Sellers remain in complete control of the immediate momentum. Price is currently pressing hard into the 4,140.000 – 4,160.000 demand pocket. Traders should watch this zone closely; if buyers fail to print strong rejection wicks or a double-bottom structure within this green zone, expect a further slide down to test the major floor at 4,120.000. Reclaiming 4,180.000 is required to break the current bearish chain.
Technical Takeaway: Price is entering an oversold extremes territory inside a key buying area. Look for clear exhaustion signatures from sellers inside this green block before looking for any reversal plays
#XAUUSD_GOLD
I am considering Demand Zone 4264/4260
Buy Reason
15 Minutes Bullish Base
Breakout structure
Order Block
Target:- 4268
Target:- 4272
Target:- 4276
Target:- 4280
Target:- 4284
Target:- 4288
Target:- 4294
Telegram Link 🔗 in Bio 👌👌
#XAUUSD 30M Update.....‼️
Price is retesting the 4320–4330 supply zone after a strong recovery. As long as sellers defend this area, the market remains vulnerable to another bearish leg toward liquidity around 4220
Stay Tuned for More Updates & Targets