We’re building Second Order Research.
Independent research on equities, macro & market structure, built with institutional-grade rigor.
Our premise: the obvious fact is rarely the whole story. Expectations, incentives, positioning and second-order effects often matter more.
Curiosity Before Capital. Evidence First.
Adeia Inc. ($ADEA): The Hidden Tollbooth Beneath AI Chips
I started looking at Adeia because of hybrid bonding.
The research ended up becoming much more interesting than that.
The obvious AI beneficiaries are GPUs, HBM, foundries, and advanced packaging.
Adeia may sit one layer underneath them: owning semiconductor IP whose economic terms were negotiated before some of these technologies became as strategically important as they may become over the next several years.
That led me to a broader framework:
Road → Moat → Meter → Renewal → Repricing → Operating Leverage
The important question isn’t simply whether hybrid bonding grows.
It’s whether increasing industry dependence gives Adeia enough leverage to reprice access when major licensing relationships eventually reset.
There is real evidence behind the thesis.
• Major memory companies already license Adeia semiconductor IP.
• AMD signed a multi-year portfolio license after patent litigation.
• Hybrid bonding is moving deeper into advanced semiconductor roadmaps.
• Adeia’s semiconductor business is becoming financially meaningful.
• The licensing model can produce substantial operating leverage if contract economics improve.
But I’d be cautious about the clean bull case.
Current HBM4 and 12-layer HBM4E can still be produced without hybrid bonding.
Customer-level contract economics are mostly confidential.
And the 2027–2028 renewal window is supported by public discussion, not a customer-by-customer contract schedule we can see.
So the biggest part of the thesis is still unproven:
Will greater technological importance actually translate into better licensing economics?
That distinction matters.
Using the Aug. 31 close of $25.23, my current underwriting looks roughly like this:
Bear: ~$15
Base: ~$30
Bull: ~$49
Probability-weighted value: ~$31
My current posture:
WATCH — DO NOT CHASE
I become more interested around:
$23–24: starter territory
$21–22: attractive
$19–20: preferred accumulation
Those aren’t standing buy orders.
If the stock falls because the thesis deteriorates, the old valuation no longer applies.
The question is always:
Why did it reach our buy price?
What would raise my conviction?
• Commercial hybrid bonding moving into higher-layer-count HBM or advanced logic
• Additional major semiconductor licenses after AMD
• Memory renewals showing broader or stronger economics
• More durable, production-linked semiconductor revenue
• Continued operating leverage and debt reduction
What would make me materially more cautious?
• Hybrid bonding adoption grows but Adeia’s economics don’t follow
• Customers demonstrate credible design-arounds
• Important patent claims weaken
• Major renewals fail to improve economics
• Semiconductor growth remains mostly episodic contract recognition
The full report is a Flagship Deep Dive, but I built a ~3-minute Executive Summary at the top for anyone who wants the conclusion before deciding whether to audit the full research.
Full research:
https://t.co/5CLi67TZCX
The biggest takeaway may ultimately extend beyond Adeia.
Find yesterday’s boring contract before tomorrow’s industry dependence forces it to be repriced.
Curiosity Before Capital.
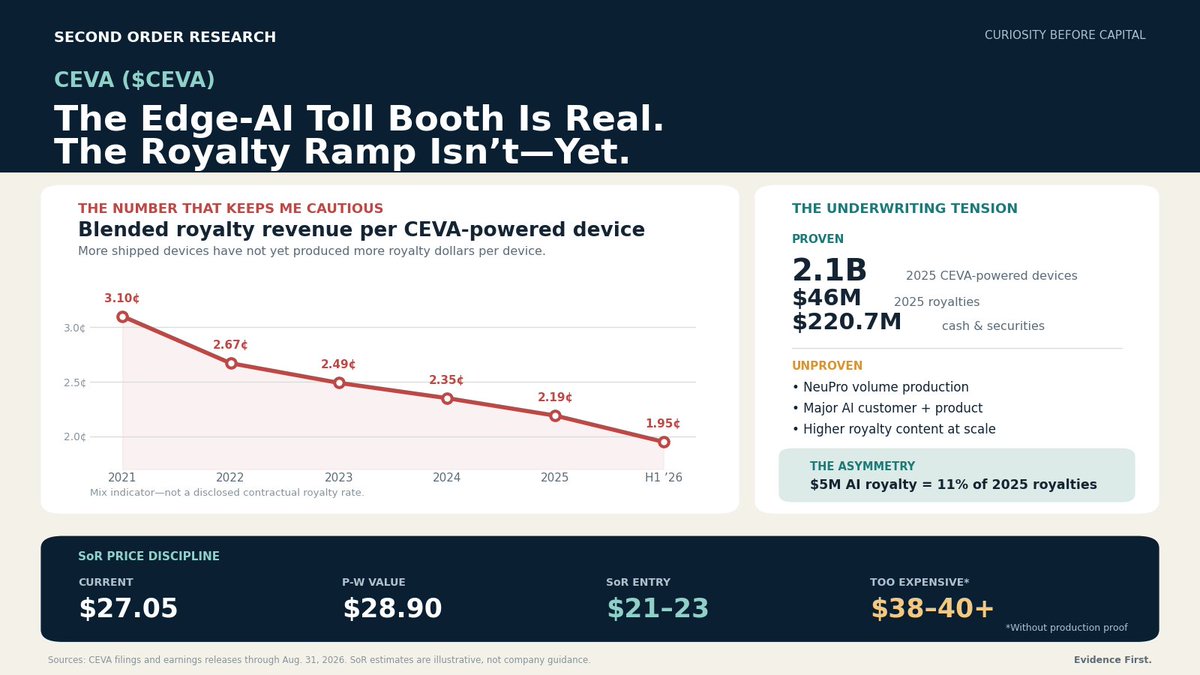
CEVA ($CEVA): The Edge-AI Toll Booth Is Real. The Royalty Ramp Isn’t—Yet.
Evidence and valuation are timestamped August 31, 2026.
I went into CEVA expecting to find a miniature Arm.
I came out believing something more nuanced:
CEVA has credible IP, a real royalty business and valuable optionality on edge AI and custom silicon.
But the Arm analogy is too generous—and the AI story is still one production ramp ahead of the economics.
At $27.05, I’d be cautious. This is buyable on weakness, not a stock I’d chase because an unnamed platform company licensed an NPU.
What CEVA actually sells
CEVA does not manufacture chips. It licenses IP that customers integrate into ASICs and SoCs.
It earns money twice:
1. Licensing revenue when customers receive the IP, customization, tools and support.
2. Royalty revenue when products containing CEVA IP ship.
In 2025, CEVA generated:
• $63.6M licensing revenue
• $46.0M royalties
• $109.6M total revenue
• 87.1% GAAP gross margin
About 75% of revenue came from Connect: Bluetooth, Wi-Fi, UWB, cellular IoT and 5G DSP/modem IP.
The remaining 25% came from Sense & Infer: sensor and audio DSPs, MotionEngine, RealSpace software and NeuPro NPUs.
Software matters, but it is embedded in licenses, support and royalty-bearing products—not separately reported as SaaS.
How a design becomes money
The lifecycle is:
evaluation → license/design win → integration → tape-out → silicon validation → qualification → production → royalties
A design win can create licensing revenue today. It does not mean a chip has taped out, will reach volume or will produce recurring royalties.
CEVA’s sales cycle is usually 3–9 months. The post-license conversion generally takes another 18–36 months, with automotive and complex custom silicon potentially taking 24–48 months.
For the July 2026 custom-AI engagement, management described tape-out within a few quarters and production roughly 1.5–2 years away.
That is why I do not count recent AI design wins as production revenue.
What is real—and what is still a promise
Real production:
• 2.1B CEVA-powered devices shipped in 2025.
567M shipped in Q2 2026.
• CEVA’s AI DSP/accelerator is entering production in the 2026 Toyota RAV4 through Renesas R-Car V4H.
• Automotive and surveillance AI products are contributing royalties, although CEVA does not quantify them.
• Bluetooth 6 began entering production in 2026.
• MotionEngine has shipped in more than 500M devices cumulatively.
Licensed, but not proven in production:
• Ten NeuPro agreements signed in 2025.
• Broad NeuPro portfolio license with Microchip.
• Nextchip ADAS and ALi video-platform licenses.
• An unnamed leading PC OEM.
• The July 2026 major U.S. software/AI platform customer.
• Bluetooth HDT and newer full-stack wireless programs.
“Physical AI” across robots, drones and humanoids is strategically interesting. Today it is mostly positioning and future TAM—not a material disclosed revenue stream.
The central edge-AI question
More devices will run AI locally because of latency, privacy, bandwidth, power and cost.
The harder question is whether each intelligent device pays CEVA more.
An edge device may combine connectivity, sensor fusion, audio/vision processing, NPU inference and software. If CEVA owns several blocks, revenue per design should rise.
There is encouraging evidence:
• 2025 Wi-Fi units rose 48%, while Wi-Fi royalties rose 70%, implying roughly 15% higher royalty per unit as Wi-Fi 6 mix improved.
• Q2 2026 industrial units fell from 24M to 19M, but industrial royalty revenue rose 7% as higher-value automotive AI and infrastructure mixed in.
• Management says subsystem and custom-AI deals carry meaningfully higher license value and royalty per unit.
But the consolidated record still says the opposite:
• 2021: >1.6B devices / $49.9M royalties = ≤3.1 cents per device
• 2022: ~1.7B / $45.4M = 2.67 cents
• 2023: ~1.6B / $39.9M = 2.49 cents
• 2024: ~2.0B / $46.9M = 2.35 cents
• 2025: 2.1B / $46.0M = 2.19 cents
• H1 2026: 1.025B / $20.0M = 1.95 cents
These are mix indicators, not contractual rates. A Bluetooth chip and an automotive processor are not comparable.
Still, units have grown faster than royalty dollars. Rising content per intelligent device is plausible, not yet proven.
The KPI that matters is royalty revenue growing faster than shipments, supported by named AI products in production.
NeuPro-M: credible technology, incomplete proof
NeuPro-M scales from 2–256 TOPS per core and supports mixed precision, transformers, vision models, multimodal inference and LLMs. It includes sparsity, compression, local memory and a programmable vector processor, with an ISO 26262 ASIL-B path.
NeuPro Studio handles model import, optimization, quantization, compilation, simulation and profiling.
Customers are buying verified RTL, software, safety work and faster time to market—not just a TOPS number.
But CEVA’s efficiency claims are vendor benchmarks with insufficiently normalized configurations. I found no broad independent benchmark record against Arm, Cadence, VeriSilicon, Imagination or newer NPU specialists.
The commercial question is whether NeuPro becomes reusable platform IP or a series of bespoke engineering projects.
Microchip integrating NeuPro Studio into its SDK and ten NPU licenses in one year are encouraging.
The real test is multiple unrelated customers in volume production, repeat generations and visible royalty dollars. CEVA has not cleared it yet.
The landmark custom-AI win
On July 6, 2026, a major U.S. software and AI platform company licensed NeuPro-M for custom silicon targeting intelligent computing devices.
The customer controls both hardware and its operating-system environment. CEVA is optimizing the NPU hardware, runtime and models around proprietary workloads.
This is a real license. It contributed to licensing revenue.
It is not a taped-out chip or recurring royalty stream.
The customer is unnamed. Microsoft may fit, but so could Google or another hardware/OS platform owner. No primary evidence supports identifying it.
We do not know the product, committed volume, royalty rate, minimum payments, tape-out date or number of generations.
Illustrative annual royalties—not guidance:
• 10M units × $0.05 = $0.5M
• 50M × $0.10 = $5M
• 100M × $0.15 = $15M
• 150M × $0.20 = $30M
A $5M stream would equal 11% of 2025 royalties and roughly half of 2025 non-GAAP operating income before incremental support costs.
$15M could change the company. $30M would be transformative.
The result could also be immaterial if the product is niche, delayed, cancelled or later insourced.
That is the asymmetry: one or two programs can matter enormously because CEVA is small.
Is CEVA a smaller Arm
Only in revenue structure.
Both sell licenses and collect royalties. Both can earn high incremental margins after the R&D is complete.
Arm, however, has:
• $4.92B FY2026 revenue and $2.61B royalties
• more than 350B cumulative chips
• more than 22M developers
• CPU architecture, system IP and global software compatibility
• visible pricing uplift from Armv9 and Compute Subsystems
CEVA has:
• $109.6M 2025 revenue and $46M royalties
• more than 20B cumulative devices and roughly 2B annually
• 400+ customers
• specialist wireless, DSP, sensing and NPU blocks
• a far smaller developer ecosystem
Arm owns the CPU road system and its software traffic rules.
CEVA owns specialized toll roads inside the SoC, often beside an Arm or RISC-V CPU.
Once CEVA wins a socket, redesign, verification, certification and software integration create real switching cost. Before the win, it faces open competition again.
That is design-specific stickiness, not ISA-level lock-in.
At $27.05, CEVA’s market cap was about $762M and enterprise value about $541M—roughly 4.3x guided 2026 revenue. Arm’s market cap was about $253B.
CEVA can work without becoming Arm. But ���mini-Arm” imports a moat and pricing power it has not earned.
Competition and moat
CEVA competes with Arm, Cadence/Tensilica, GlobalFoundries’ former Synopsys ARC portfolio, VeriSilicon, Imagination, RISC-V/open-source NPUs, specialists such as Expedera and Quadric, finished Qualcomm/MediaTek chips and customer-developed IP.
Its defenses are:
• low-power wireless and DSP expertise
• standards knowledge and certification
• silicon-proven IP
• compiler/runtime software
• functional safety and verification
• implementation support
• faster time to market
• expensive redesign after integration
• cross-selling connectivity, sensing and AI
Nothing makes CEVA impossible to replace. Large platform companies have the resources and incentive to internalize AI IP. Open architectures lower the starting cost, and larger rivals can bundle broader portfolios.
CEVA’s moat is execution, time-to-market and post-design-in switching cost—not an impenetrable patent wall.
Financial condition
Revenue history:
• 2021: $113.8M
• 2022: $120.6M
• 2023: $97.4M
• 2024: $106.9M
• 2025: $109.6M
That is not yet a secular AI compounder.
The recent inflection is better:
• Q2 2026 revenue +13% to $29.0M
• licensing +21% to $18.2M
• royalties +1% to $10.8M
• non-GAAP operating margin 11% versus 3%
• 2026 revenue guidance +13–15%
• non-GAAP operating-income guidance roughly +70%
Operating leverage is appearing—but only on an adjusted basis.
H1 2026 still produced:
• $7.2M GAAP operating loss
• $7.4M net loss
• R&D equal to 69.9% of revenue
• SBC equal to 18.8% of revenue
• roughly negative $2.0M FCF
The balance sheet is strong: $220.7M of cash and securities, no financial debt and about $7.84 of net cash per basic share.
Per-share discipline is weaker. CEVA sold 3.45M shares in late 2025, while SBC remains near one-fifth of revenue. Basic shares rose from 23.6M at year-end 2024 to 28.1M by June 2026.
An 87% gross margin is less impressive when R&D is the economic cost of producing the next licensable core.
Customers and geography
Concentration is material:
• UNISOC was 15% of 2025 revenue.
• The top five royalty payers were 57% of 2025 royalty revenue.
• Q2 2026’s top five total customers were 55% of revenue.
China was 61.9% of 2025 revenue, 52% of H1 2026 and 48% of Q2.
The growing U.S. licensing mix helps, but export controls, local substitution, pricing and customer concentration remain real risks.
Bottom-up 2030 framework
The relevant formula is:
annual chips × externally licensed share × CEVA capture × royalty/content
My base 2030 royalty framework is:
• Core connectivity: 3.0B units × ~2 cents = $60M
• AI/custom silicon: 80M × ~$0.10 incremental content = $8M
• Automotive/industrial: 20M × ~$0.25 = $5M
• Sensing/software overlays: 80M × ~$0.05 = $4M
That produces roughly $77M of royalties before a larger platform ramp.
This avoids counting the same smart device separately as connectivity, AI, sensing and IoT TAM.
Consumer connectivity remains the volume base. Automotive carries richer content but longer cycles. AI PCs are mostly captive silicon. Robotics is strategically attractive but unlikely to produce billions of units. Custom AI is program-based: one large customer can matter more than an entire niche TAM.
TAM is not CEVA’s bottleneck. Conversion and monetization are.
Scenario model
2026 midpoint: roughly $78M licensing, $47M royalties and $125M revenue, with 87% gross margin, negative GAAP operating margin and near-breakeven FCF.
2030 bear:
Licensing $80M; royalties $55M; revenue $135M
86.5% GM; 3% operating margin; $9M FCF; $0.16 EPS
32.0M diluted shares
2030 base:
• Licensing $100M; royalties $95M; revenue $195M
• 89% GM; 18% operating margin; $36M FCF; $0.93 EPS
• 31.5M diluted shares
2030 bull:
• Licensing $125M; royalties $155M; revenue $280M
• 90% GM; 28% operating margin; $78M FCF; $2.17 EPS
• 31.0M diluted shares
Using an 11% discount rate, 2.5x/6x/8x terminal EV/sales and 30%/50%/20% probabilities:
• Bear fair value: $11.20
• Base: $29.70
• Bull: $53.40
• Probability-weighted: $28.90
At $27.05, expected upside is only about 7%. That is not enough margin of safety for an unnamed customer, a multi-year conversion cycle and negative GAAP FCF.
My attractive entry is $21–23. Below $20, the net cash and AI option become compelling. Above $38–40, investors would be prepaying for substantial royalty conversion without production proof.
Independent bull versus bear
The bull says CEVA already has 2B+ annual distribution, only needs royalty content to move from roughly two cents toward three or four, and can drop a $5–15M AI stream through a mostly fixed cost base.
The bear says units have grown while royalty per device fell, current growth is licensing-led, NeuPro royalties remain undisclosed, CEVA lacks Arm’s moat, and SBC, China exposure and dilution are too high.
My synthesis:
The bear wins on present economics.
The bull wins on optionality.
That is investable only with price and milestone discipline.
Catalysts
Next 6–12 months:
• six 2025 NPU customers receiving silicon
• royalty growth improving versus unit growth
• named Microchip, PC or NeuPro products
• evidence of custom-AI tape-out
• Bluetooth HDT and Wi-Fi 7 production
• improving GAAP margins
12–36 months:
• measurable royalties from the 2025 NPU cohort
• custom-AI silicon validation and volume production
• a second major platform customer
• royalty growth overtaking licensing growth
• repeat NeuPro generations
Risks and falsifiers
The real risks are failed design-win conversion, long development cycles, AI-IP commoditization, customer insourcing, pricing pressure, China exposure, customer concentration, SBC, dilution and edge AI remaining mostly captive silicon.
I would abandon the thesis if:
• the July 2026 platform program shows no tape-out evidence by the end of 2027;
• no production or firm timetable exists by year-end 2028;
• AI stays above 20% of licensing but does not appear in royalties by 2028;
• royalties keep growing slower than device shipments;
• royalty per device does not stabilize and rise;
• CEVA exceeds roughly $150M of revenue without GAAP profitability;
• SBC remains above 15% of revenue and organic dilution above 3%;
• the major AI customer cancels, delays or insources the NPU;
• CEVA raises equity again before becoming self-funding.
What SoR Actually Believes
The market is missing that CEVA does not need to dominate edge AI. One or two $5–15M royalty programs can change a company with only ~$47M of annual royalties.
I disagree with the “mini-Arm” framing. CEVA has a similar revenue mechanism, not a similar moat. The market may also be capitalizing design wins that remain 18–36 months from royalties.
My highest-conviction view is that the connectivity toll booth and NeuPro optionality are both real. What is not proven is rising consolidated content per device.
The falling historical royalty per device, flat 2025 royalties, negative GAAP FCF, SBC near one-fifth of revenue, China concentration and undisclosed AI-customer economics make me uncomfortable.
At $27.05, CEVA is buyable only on weakness. A 0.25%–0.50% tracking position is defensible, but I would not build a full position.
At $21–23, I see a better margin of safety. Below $20, I get materially more interested. Above $38–40, the stock becomes too expensive without production proof.
I would cap sizing around 0.5% before tape-out evidence, consider 1% after validated silicon and only move toward 1.5%–2% after material royalties and GAAP leverage appear.
Great technology? Credible and differentiated, but not independently benchmarked enough for certainty.
Great company? Not yet. Royalty quality, cash conversion and per-share discipline need proof.
Great stock? Potentially. The small revenue base makes the upside convex.
Great entry price? Not today. At $27, I see optionality without enough margin of safety. At $21–23, I see a bet worth taking.
Tungsten went vertical in 2026.
Tellurium might be one of the next critical metals worth watching.
Not because I think it’s about to repeat tungsten’s 300%+ move tomorrow.
Actually, the reason I’m interested is almost the opposite:
Tellurium has many of the ingredients that created the tungsten squeeze — but the price isn’t behaving like a commodity in panic mode right now.
That disconnect is what caught my attention.
Tellurium is one of those materials most investors rarely think about.
It’s a critical input in cadmium telluride, or CdTe, the semiconductor used in thin-film solar panels. It also has applications in thermoelectrics, specialty alloys, electronics, security systems and medical imaging.
But the interesting part isn’t simply demand.
It’s how tellurium is produced.
Most tellurium doesn’t come from tellurium mines.
It is recovered as a byproduct of copper refining, primarily from the material left behind during electrolytic copper processing.
That creates a very different supply curve from something like copper itself.
If copper goes from $5 to $8, miners have a reason to develop more copper deposits.
If tellurium goes from $100/kg to $300/kg, the world can't suddenly triple tellurium production.
The economics of the giant copper operation still matter more than the economics of the relatively tiny amount of tellurium recovered from it.
That is the first thing I keep coming back to:
Tellurium supply is unusually price-inelastic.
And then there is China.
According to the USGS, China accounts for roughly three-quarters of the world's refined tellurium production.
In February 2025, China placed export controls on tellurium.
That was the same round of controls that included tungsten, indium, bismuth and molybdenum.
The controls aren't a blanket export ban. Exporters have to obtain licenses and provide information about the ultimate recipient and use of the material.
But the friction matters in a small market.
USGS says the typical license process was around 45 days, and the restrictions significantly reduced tellurium availability in Europe.
The price response wasn't trivial.
Europe's average tellurium price rose about 84% in 2025, from roughly $82/kg to $150/kg.
U.S. warehouse prices rose roughly 60%.
So tellurium has already shown us what happens when the supply chain gets stressed.
But here's where the story gets more interesting.
The squeeze cooled.
As of August 28, 2026, Shanghai Metals Market had 99.99% tellurium around:
China: ~$105/kg
Rotterdam: ~$116/kg
In other words, tellurium isn't currently trading like a market expecting an imminent shortage.
I think that's important.
I'm not interested in finding critical minerals after everyone has decided they're scarce.
I'd rather find the market where the structural conditions for scarcity exist, but the price is still giving us time to do the work.
And demand is moving in the other direction.
The biggest use for tellurium today is CdTe solar.
That puts First Solar ($FSLR) directly in the story.
First Solar isn't a tellurium investment — it's a tellurium consumer — but its manufacturing expansion tells us something about the demand side.
The company expects to sell roughly 17–18.2 GW of modules in 2026 and continues expanding its U.S. manufacturing footprint.
More interesting to me is what's happening one step upstream.
5N Plus ($VNP.TO) converts critical materials including tellurium into high-purity semiconductor compounds and is a major CdTe supplier to First Solar.
In August 2025, 5N Plus expanded its agreement with First Solar.
Its CdTe production and deliveries were scheduled to increase 33% during 2025–26 compared with the original commitment, followed by another 25% increase during the 2027–28 contract period.
That is real physical demand growth moving through the supply chain.
Now follow the chain another step upstream.
Rio Tinto ($RIO) recovers tellurium at its Kennecott copper operation in Utah.
The circuit was designed to produce roughly 20 tonnes annually.
That tellurium goes to 5N Plus for refining and transformation into semiconductor materials, much of which ultimately feeds First Solar.
So we can actually see the North American chain:
Copper refining
↓
Tellurium recovery
↓
5N Plus
↓
CdTe semiconductor
↓
First Solar
↓
Solar generation
And that's where I think the second-order question becomes interesting.
What happens if CdTe capacity keeps expanding while China continues controlling exports and non-Chinese tellurium recovery can't respond quickly enough? At first, probably nothing dramatic.
Inventories absorb it.
Recycling helps.
Customers secure longer-term contracts.
Processors diversify suppliers.
Prices gradually rise.
But small commodity markets don't always move gradually.
Eventually buyers stop asking:
"What is the tellurium price?"
And start asking:
"Can you actually deliver it?"
That's the transition I want to watch.
Because once procurement departments begin prioritizing availability over price, the economics change quickly.
Tungsten reminded us how violently a strategically important but relatively obscure commodity can reprice when geopolitical constraints collide with an inflexible supply curve.
I'm not saying tellurium is the next tungsten.
That's too easy.
There are meaningful differences.
China can increase production.
Copper refining activity can increase byproduct recovery.
Recycling can become more economical.
CdTe manufacturers can continue reducing material intensity.
And tellurium already experienced one significant repricing in 2025 before giving much of it back.
Those are important counterarguments.
But that last point is also why I'm interested now.
Tellurium isn't sitting at the end of a parabolic rally.
The market has had a supply shock.
The price reacted.
Then it normalized.
Meanwhile, the underlying strategic conditions haven't disappeared:
China still dominates refined production.
Export controls remain part of the supply-chain landscape.
Supply is largely tied to another commodity.
CdTe manufacturing is expanding.
North America is actively trying to create a domestic critical-mineral supply chain.
And the physical market is small enough that relatively modest changes in inventories or procurement behavior could matter.
My read:
Tellurium isn't a high-conviction trade yet.
It's a high-conviction research target.
There is a difference.
I don't see enough evidence today to say a tungsten-style squeeze has begun.
But I think the ingredients are sitting on the table.
The signal I'd really want to see next is not simply a higher tellurium price.
I'd watch for a widening ex-China premium, declining Chinese exports, longer delivery times, rising CdTe procurement commitments, inventory drawdowns, more long-term contracting, or producers talking about securing supply rather than minimizing cost.
If several of those start appearing together, my conviction changes quickly.
And there may be an interesting equity angle here too.
Rio Tinto ($RIO) produces tellurium, but tellurium is far too small relative to Rio's enormous business to create much earnings sensitivity.
First Solar ($FSLR) creates demand but could actually be hurt by severe raw-material inflation if it couldn't pass those costs through.
5N Plus ($VNP.TO) may be more interesting because it sits directly in the critical-material processing and semiconductor conversion chain — but we'd need to understand its contract structure, raw-material pass-through mechanisms and actual tellurium economics before calling it a beneficiary.
There is also a tiny company called First Tellurium ($FTEL / $FSTTF), but the name alone means nothing. That's a speculative microcap that requires an entirely different level of diligence before I would attach the SoR name to it.
So I'm not buying a ticker just because I like the commodity setup.
The opportunity may ultimately be the metal.
It may be the processor.
It may be a producer with overlooked byproduct economics.
Or the best trade may be somewhere we haven't looked yet.
That's the research I want to do next.
Tungsten's move showed what can happen after the market recognizes a strategic-material shortage.
With tellurium, I'm more interested in the period before recognition.
That's usually where the asymmetry is.
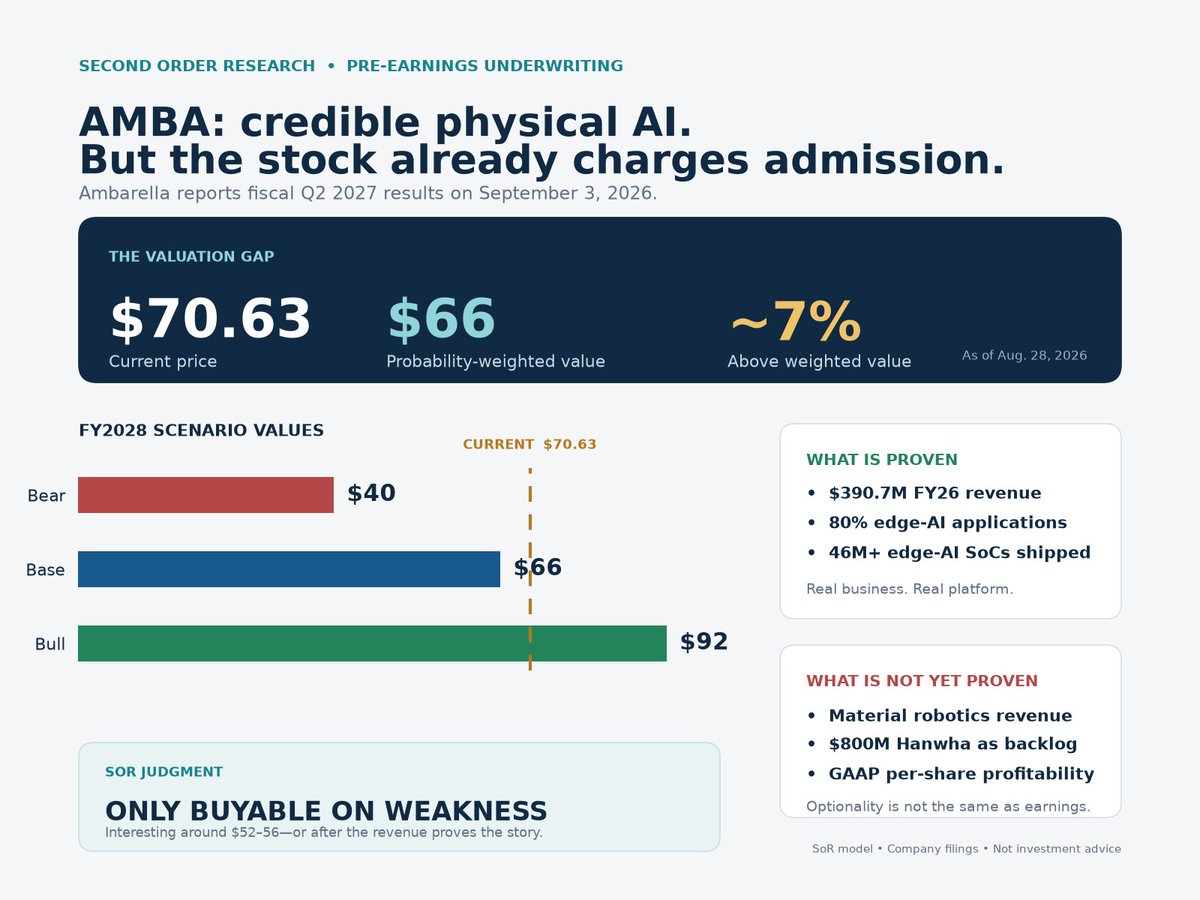
Ambarella ($AMBA) may be one of the more interesting public-market ways to invest in physical AI (subset of Robotics).
But at $70.63, investors are already paying for a robotics business that Ambarella does not separately disclose.
Ahead of earnings on September 3, here is our underwriting:
AMBA is not a speculative pre-revenue robotics company.
It generated $390.7M of revenue last fiscal year, up 37%, with approximately 80% attributed to edge-AI applications.
The company has shipped more than 46M edge-AI SoCs and supports over 200 AI model architectures already in production.
Its chips combine AI inference, image processing, video encoding, sensor fusion and CPUs in low-power systems designed for cameras, vehicles, drones and autonomous machines.
That is the proven business.
The robotics thesis is different.
Ambarella is winning designs across drones, industrial automation, autonomous mobile robots and delivery robots. Its newer CV72 and CV75 chips are ramping, CV7 is expected to enter production by year-end, and the 2nm CV8 is expected to follow in the first half of fiscal 2028.
These products target more sophisticated workloads and should carry ASPs well above AMBA’s current corporate average of roughly $15.
The opportunity is real—but robotics revenue is not separately disclosed.
That distinction matters.
The market became particularly excited after Ambarella announced a long-term agreement with Hanwha representing more than $800M of potential revenue over more than ten years.
The headline is enormous relative to AMBA’s current revenue base.
But it is not the same as $800M of robotics backlog.
The agreement spans physical security, industrial automation, life sciences and robotics. Ambarella has not disclosed minimum purchase commitments, annual revenue cadence, cancellation provisions, product mix or expected margins.
We assign Hanwha strategic value today, not full backlog value.
There are other reasons to remain disciplined.
Q1 revenue grew 17% to $100.4M, and automotive reached a record. But GAAP gross margin declined to 58.4%, partly because of higher advanced-node manufacturing costs.
Inventory jumped from $52.2M to $80.4M in one quarter. Inventory days increased from 99 to 145, contributing to a $25.6M operating cash outflow.
Management says the build supports upcoming product cycles. That is plausible—but the inventory now needs to convert into shipments.
Stock-based compensation is another problem.
AMBA recorded $21.9M of SBC in Q1, compared with only $5M of non-GAAP profit. Shares outstanding increased despite repurchases, and another $169.6M of unrecognized compensation cost remains.
Adjusted profitability is therefore not the same as per-share value creation.
Competition is also intense.
NVIDIA owns the strongest robotics software ecosystem. Qualcomm combines efficient AI with connectivity. NXP and Texas Instruments have deep industrial relationships. Mobileye and Horizon Robotics are formidable in automotive.
AMBA’s opportunity is not to beat Jetson Thor at maximum compute.
Its credible wedge is low-power, camera-heavy perception and inference—integrating AI acceleration, image processing, video and sensor fusion into one SoC.
That can be valuable in drones, cameras, telematics and power-constrained autonomous machines.
The question is how much of that future is already reflected in the stock.
At $70.63, AMBA’s market capitalization is approximately $3.14B. After subtracting $277.8M of cash and securities, enterprise value is roughly 7.3× fiscal 2026 revenue.
That is a platform valuation, not a recovery valuation.
Our FY2028 scenarios:
Bear: $450M revenue → ~$40/share
Base: $510M revenue → ~$66/share
Bull: $560M revenue → ~$92/share
Probability-weighted value: approximately $66/share
Our reverse valuation suggests the current price already requires roughly $550M–$560M of fiscal 2028 revenue, meaningful operating leverage and reasonable dilution control.
In other words, the stock needs an outcome between our base and bull cases.
For September 3, management’s Q2 guidance is:
• Revenue: $105M–$111M
• Non-GAAP gross margin: 59.0%–60.5%
• Non-GAAP operating expenses: $56M–$59M
A revenue beat alone will not be enough.
We want to see:
• Q3 guidance around or above $120M
• Inventory days begin to normalize
• Positive operating cash flow
• CV7 and CV8 remain on schedule
• Quantifiable production revenue from robotics
• Better disclosure around Hanwha
• Evidence that higher ASPs produce gross-margin and operating leverage
• Buybacks beginning to offset dilution
The bull case is straightforward:
Ambarella becomes the low-power perception and inference layer across cameras, vehicles, drones and autonomous machines. Higher-ASP products scale, robotics becomes material, and the company grows into its current valuation.
The bear case is equally straightforward:
Robotics remains a collection of demonstrations and design wins, product ramps slip, gross margins remain under pressure, and stock compensation absorbs the operating improvement.
Our judgment:
AMBA has earned the right to be taken seriously as a physical-AI platform.
It has not yet earned a robotics multiple without qualification.
We would not chase the stock ahead of earnings at $70.63.
It becomes interesting in the low-to-mid $50s—or at a higher price after the company proves that robotics, CV7/CV8 and Hanwha are becoming recurring, high-margin silicon revenue.
The physical-AI thesis is credible.
The current valuation already knows it.
Kura Oncology ($KURA): one of the more interesting asymmetric setups I’ve found lately
I’ve been scanning for situations where the upside can be multiples of the downside without requiring me to believe an obviously heroic story.
Kura Oncology ($KURA) keeps surviving the tests.
My read: this is not the highest-convexity biotech I looked at. It may be the best combination of evidence quality, balance-sheet protection, commercial validation, and upside.
KOMZIFTI, Kura’s menin inhibitor ziftomenib, is already FDA-approved in relapsed/refractory NPM1-mutant AML.
And the launch is starting to matter.
Q2 KOMZIFTI revenue was $9.1M, up 57% sequentially, with roughly 115 new patient starts, up 35%. Management says it captured a majority of new patient starts within the R/R NPM1-mutant menin-inhibitor class.
That by itself isn’t why I’m interested.
The much larger question is whether ziftomenib can move earlier into frontline AML.
The current data are hard to dismiss.
In 99 newly diagnosed AML patients receiving ziftomenib + 7+3 chemotherapy:
• NPM1-mutant: 96% composite complete response
• KMT2A-rearranged: 90% composite complete response
• MRD negativity among responders: 83% and 82%
That is not a tiny 10-patient signal.
And Kura is already enrolling the Phase 3 KOMET-017 trial, with the first pivotal topline expected in 2028.
But this is where I’d be cautious about the easy bull case.
Kura does not have the menin-inhibitor market to itself.
Syndax Pharmaceuticals ($SNDX) already has Revuforj, which generated $54.7M in Q2 versus KOMZIFTI’s $9.1M. Syndax also has very strong frontline combination data.
So I’m not underwriting:
“KURA has the better drug and wins everything.”
That is too clean.
What I’m underwriting is:
Can ziftomenib become a durable co-leading menin franchise with enough efficacy, tolerability, dosing convenience, and combination flexibility to capture meaningful share as the market expands?
I think that is much more plausible.
There may also be an interesting tolerability distinction worth watching. KOMZIFTI’s FDA label reported QT prolongation in 12% of patients, versus materially higher reported rates in Revuforj’s label.
Cross-trial comparisons have obvious limits, so I would not call that proof of superiority. But physicians may ultimately care about differences in real-world tolerability and monitoring burden.
Then there is the balance sheet.
Kura ended Q2 with $519M in cash and investments, plus $180M of anticipated collaboration payments from Kyowa Kirin.
The partnership structure is attractive:
• Kura books U.S. sales
• U.S. profits/losses are shared 50/50
• Kyowa commercializes ex-U.S.
• Kura receives tiered double-digit ex-U.S. royalties
• Substantial additional milestones remain possible
Management believes current resources can fund the AML program through the first Phase 3 KOMET-017 topline in 2028.
That matters enormously to me.
A biotech with an approved product, early commercial traction, a global pharma partner, and enough capital to reach the key pivotal readout has a very different downside structure from a pre-revenue company racing toward its next financing.
There’s also an insider signal I don’t want to overstate, but I don’t want to ignore either.
CEO Troy Wilson bought 100,000 shares on Aug. 17 at a weighted average of $11.12.
One week later, he bought another 100,000 shares at a weighted average of $12.39.
Roughly $2.35M of open-market buying in eight days.
Insiders can be wrong. This is not a thesis by itself.
But when the CEO is writing a seven-figure personal check around the same price where I’m independently finding favorable asymmetry, I pay attention.
Here’s my current probability framework at $12.66:
BEAR — 20%
$7–9
Commercial uptake disappoints, Revuforj retains much stronger positioning, or frontline development weakens.
BASE — 55%
$18–23
KOMZIFTI becomes a durable menin franchise, commercial adoption builds, and the frontline program remains credible.
BULL — 25%
$30–38
Frontline ziftomenib becomes an important standard-of-care component and the franchise expands substantially.
Those are my underwriting ranges—not company guidance and not a promise of where the stock goes.
Using the midpoints gives me a rough probability-weighted value around $21.
At $12.66, that is an unusually interesting expected-value gap.
But price still matters.
I would rather build a meaningful position around $11–12 than chase it after the recent move. Below roughly $10.50 with the thesis intact, the asymmetry becomes substantially more interesting.
What would change my mind?
• Commercial momentum stalls materially
• Frontline data weaken as the dataset matures
• Revuforj proves much more difficult to compete with than expected
• Unexpected safety signals emerge
• The Phase 3 path slips materially
• Cash burn begins threatening the funded-through-readout thesis
What keeps me interested is that I don’t need every part of the bull case to work.
KURA already has a real drug, real patients, real revenue, real partner economics, and a large cash cushion.
The upside comes from something that is still unproven:
Whether an approved salvage therapy can become a much larger frontline AML franchise.
That is the kind of asymmetry I like.
Evidence already exists.
The bigger outcome still has to be earned.
My current posture: KURA is buyable as a starter around today’s price, but I’d prefer $11–12 for more meaningful exposure.
The most interesting thing about CRISPR Therapeutics ($CRSP) right now may not be CASGEVY.
It may be CTX310.
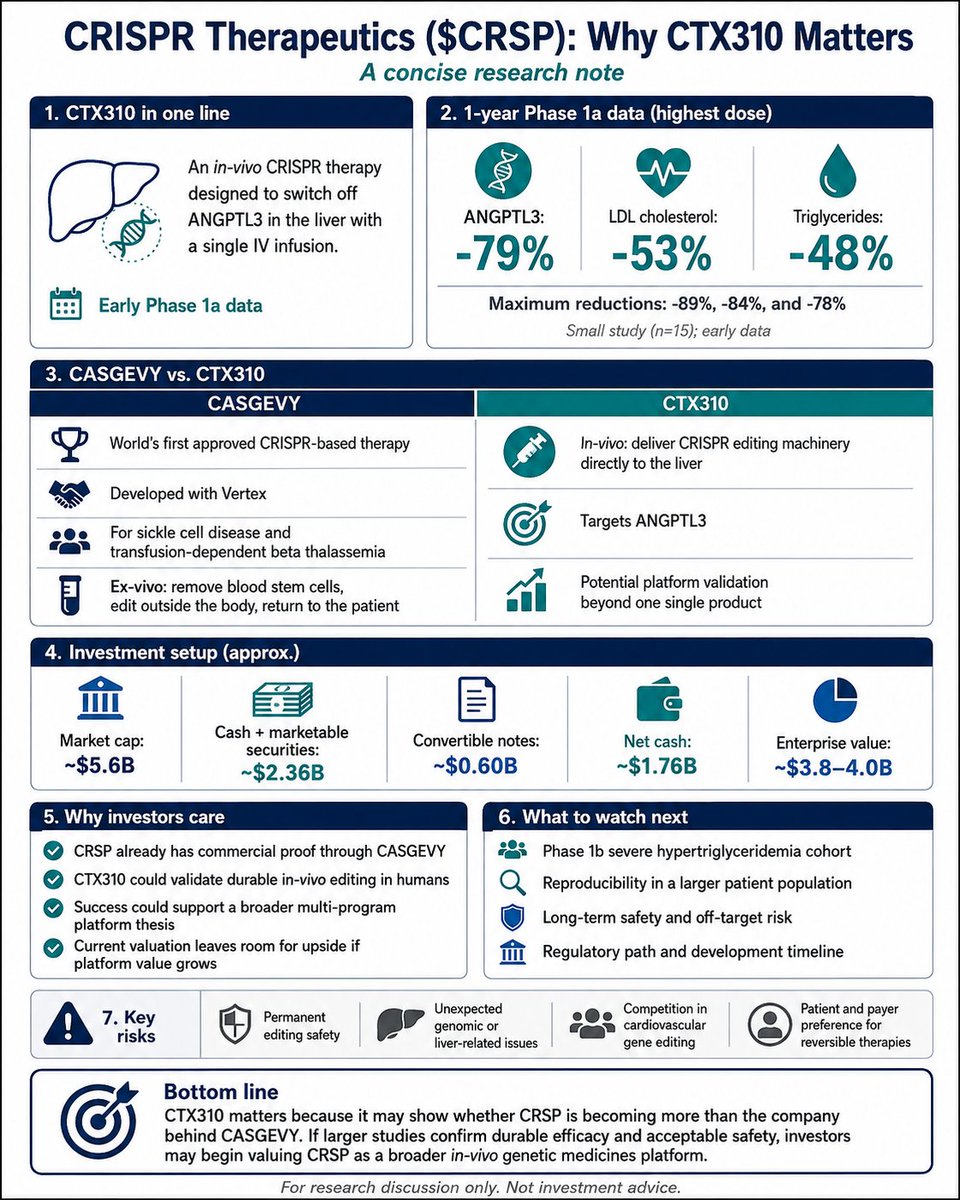
CTX310 is an in-vivo CRISPR therapy designed to permanently switch off ANGPTL3 in the liver with a single infusion.
The latest Phase 1 data are still very early — only 15 patients — but the signal is notable.
At the highest dose, mean reductions at one year were roughly:
• ANGPTL3: -79%
• LDL cholesterol: -53%
• Triglycerides: -48%
And importantly, the effect was still there a year later.
But the bigger investment question is not simply whether CTX310 becomes a successful triglyceride drug.
It is whether CTX310 is beginning to validate something much larger:
CRSP’s ability to safely and durably edit genes inside the human body.
That distinction matters.
CRSP has already proven that CRISPR can become an approved medicine through CASGEVY.
CASGEVY is the world’s first approved CRISPR-based therapy, developed with Vertex for sickle cell disease and transfusion-dependent beta thalassemia.
It works by removing a patient’s own blood stem cells, editing them outside the body, and returning them to the patient.
That was an enormous scientific achievement.
But it is complicated.
CTX310 is trying to do something fundamentally different.
Instead of removing cells and editing them in a lab, CRSP delivers the editing machinery directly into the body.
Reach the right tissue.
Edit the intended gene.
Produce a meaningful biological effect.
And make it last.
If CTX310 continues to work as the patient population expands, the read-through may extend well beyond ANGPTL3.
CRSP is already developing additional in-vivo programs targeting areas including Lp(a), hypertension, alpha-1 antitrypsin deficiency, and potentially immune cells.
That starts to look less like a single-drug story and more like a reusable delivery + editing platform.
And the valuation is what makes this interesting.
At roughly a $5.5–6B market cap, CRSP has about $2.4B in cash and securities, partially offset by $600M of convertible debt.
That leaves an enterprise value of roughly $4B.
For that, investors get:
• 40% economics in CASGEVY
• CTX310
• zugo-cel, its off-the-shelf CD19 CAR-T program
• additional in-vivo cardiovascular programs
• autoimmune CAR-T optionality
• Factor XI RNAi exposure
• regenerative medicine programs
• proprietary editing and delivery technology
That does not mean CRSP is obviously cheap.
Most of the potential value is still years in the future, and the biggest risk is safety.
Permanent gene editing is very different from prescribing a drug you can stop.
Fifteen patients cannot tell us whether rare off-target, genomic, hepatic, immune, or long-latency problems will eventually appear.
That is why the next CTX310 readout matters much more than the headline numbers we have today.
The Phase 1b severe-hypertriglyceridemia cohort should begin answering the key question:
Can CRSP reproduce the efficacy across a larger, more relevant patient population while maintaining a clean safety profile?
There is also serious competition.
Eli Lilly acquired Verve Therapeutics to gain access to one-time cardiovascular gene editing, including a PCSK9 program that has also shown substantial LDL reductions.
That cuts both ways.
Competition will be intense.
But it also tells us Big Pharma is taking cardiovascular gene editing seriously.
My read:
I would not buy CRSP simply because CRISPR sounds revolutionary.
I would buy it only if the current valuation does not fully reflect the probability that CRSP is becoming a multi-program in-vivo genetic medicines platform.
CTX310 is the program that could begin answering that question.
If the next data show durable efficacy, reproducibility, acceptable safety, and a credible path toward pivotal development, the market may eventually stop valuing CRSP mainly as “the company behind CASGEVY.”
It may start valuing it as something broader:
a company capable of repeatedly programming human biology in vivo.
That would be a very different valuation framework.
The science is ahead of the commercial proof.
But the enterprise value is low enough that successful platform validation could create meaningful asymmetry.
For me, CTX310 is now the program to watch.
Not because it proves CRSP has won.
Because it may be the first real evidence that the next chapter of CRSP is much larger than CASGEVY.
What would change my mind?
A meaningful treatment-related safety signal.
Weak reproducibility in the larger Phase 1b cohort.
An impractical regulatory path.
Or evidence that patients and payers strongly prefer reversible therapies over permanent editing.
Until then, CRSP remains one of the more interesting high-risk/high-upside biotech platform stories on my radar.
A new Nature Medicine paper on Kyverna Therapeutics caught my attention.
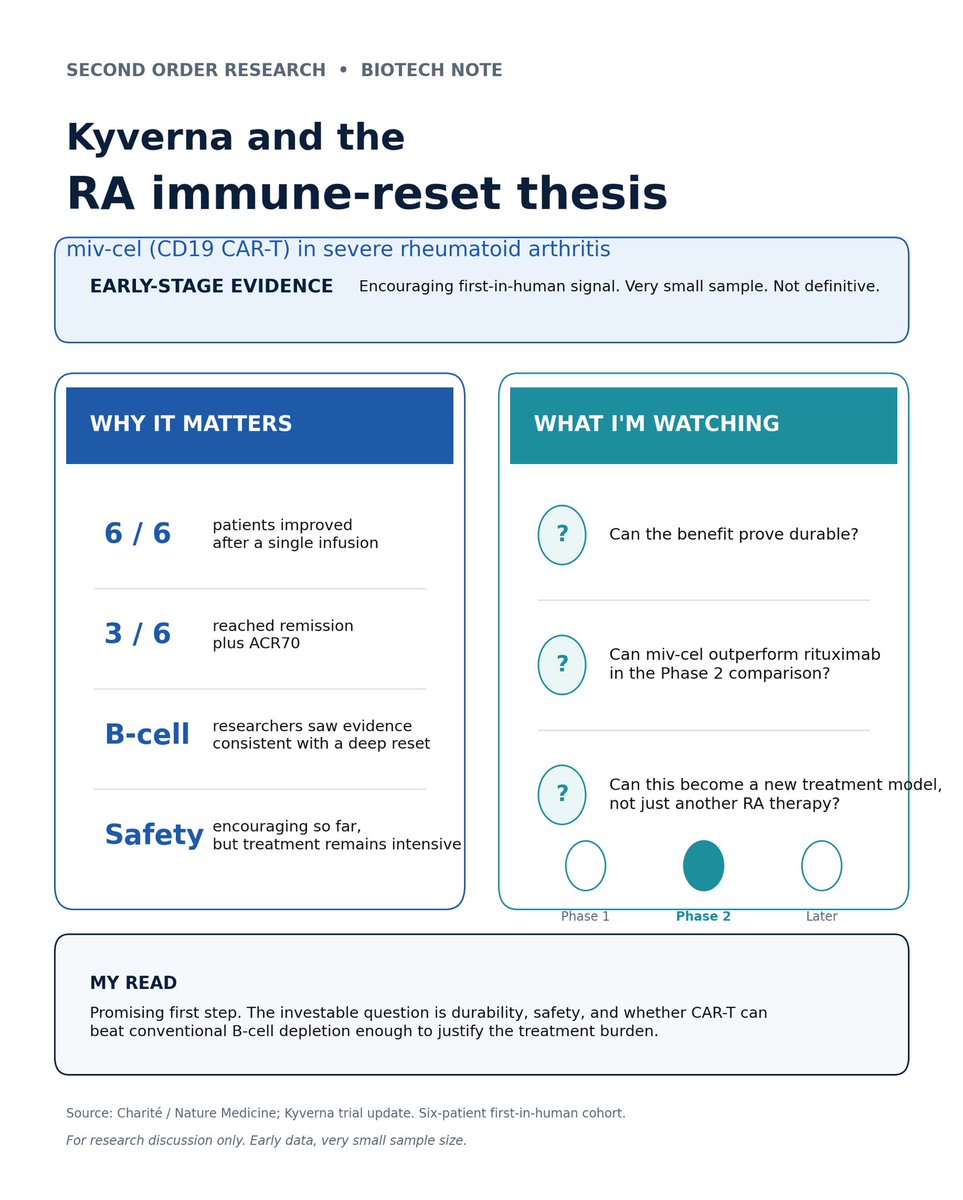
Published August 27, the paper reports early clinical results for miv-cel, the CD19 CAR-T therapy from Kyverna Therapeutics ($KYTX), in six patients with severe rheumatoid arthritis that had failed multiple prior treatments.
All six patients improved after a single infusion.
Three reached remission plus an ACR70 response.
Researchers also saw evidence consistent with something potentially more important than symptom control: a deep B-cell reset.
That raises a much bigger question.
Can some autoimmune diseases eventually be treated with one intensive immune-reset procedure instead of years of chronic immunosuppression?
I believe that’s the real promise here.
But I’d be cautious calling this a breakthrough for everyday RA yet.
It’s six patients. They needed lymphodepleting chemotherapy. Every patient experienced mild-to-moderate cytokine release syndrome. CAR-T is still far more complex than standard biologic therapy.
The next step matters much more.
The Phase 2 portion of the COMPARE study is now testing miv-cel against rituximab, an established B-cell therapy.
If CAR-T can produce deeper and more durable drug-free remission than conventional B-cell depletion, this starts to look like a different treatment model, not just another RA drug.
There’s also an investing lesson here.
The Nature Medicine paper is important because it adds peer-reviewed validation, but these six-patient results were already disclosed publicly months earlier.
So the scientific publication date wasn’t the original information-discovery date.
That distinction matters.
Sometimes the market-relevant information appears first in conference data, company disclosures or trial updates, and the journal publication arrives later as validation.
For $KYTX, I believe the bigger question now is durability.
If the immune reset holds, the platform gets much more interesting.
If patients relapse quickly or the treatment burden proves too high relative to existing therapies, the economics become much harder.
Promising first step.
Plenty left to prove.
Everyone Knows AI Needs Copper. I’m More Interested in What Comes Next.
Copper has become one of the obvious AI infrastructure trades.
I believe the more useful question now is what sits underneath the bottlenecks investors are only starting to notice.
The AI buildout needs much more than GPUs and copper wire. It needs transformers, switchgear, cooling, high-speed optics, backup power and an enormous expansion of the grid.
That pulls in a much less obvious group of materials.
**Electrical steel**
This may be one of the most overlooked.
Transformers need specialized electrical core steel, and transformers are already one of the hardest pieces of the power system to source quickly. The Department of Energy has called transformers a critical grid supply constraint, with limited domestic capacity and long procurement timelines.
If energized compute is the scarce asset, transformer materials matter.
**Aluminum**
Copper gets the headlines, but aluminum is everywhere in power infrastructure.
Conductors, busbars, cooling systems and transmission equipment can all use it. And if copper gets expensive enough, substitution toward aluminum becomes more attractive.
That makes aluminum both an AI input and a potential beneficiary of copper scarcity.
**Silver**
Silver is easy to overlook because the amount used in each component is small.
But it has exceptional electrical and thermal conductivity, which makes it useful in contacts, power modules, connectors, chip packaging and thermal applications.
The Silver Institute expects AI and data centers to become a meaningful new source of industrial demand.
I’d be cautious treating that as a pure silver bull case, but the direction is worth watching.
**Gallium and germanium**
These are much smaller markets, which is exactly why they interest me.
Gallium matters in high-performance semiconductors and optoelectronics.
Germanium is used in fiber-optic glass and other photonic applications.
As AI clusters get larger, moving data between machines becomes almost as important as the compute itself.
The problem is supply concentration. China dominates production of several of these materials and has already used export controls.
That turns a small-volume input into a potentially large geopolitical bottleneck.
**Rare earths**
Motors, pumps, cooling equipment and parts of the power system rely on permanent magnets that use materials like neodymium, praseodymium, dysprosium and terbium.
Again, AI probably isn’t the largest source of demand.
That’s not the point.
AI is arriving on top of EVs, grid expansion, defense and industrial automation, all competing for many of the same supply chains.
That’s the pattern I keep coming back to.
The next AI shortage may not come from a single material.
It may come from a collection of small, boring inputs that nobody worried about when data centers were much smaller.
My current watchlist beyond copper:
Electrical steel
Aluminum
Silver
Gallium
Germanium
Magnet rare earths
Transformer capacity
Optical components
Cooling equipment
I’m not saying all of these are good investments at today’s prices.
Some may have plenty of supply. Some may be substituted. Some may never become economically important enough to move the underlying commodity.
But I believe the research opportunity is real.
Everyone is watching the GPUs.
More people are watching copper.
I want to know what becomes scarce after copper.
That’s usually where the second-order work starts.
AI Demand Can Be Real and the Financing Can Still Get Fragile
I believe one of the biggest mistakes in the AI debate is forcing everything into two camps.
Either the boom is real.
Or it’s all circular financing and fake demand.
I don’t believe it’s that simple.
The demand for compute looks very real. Hyperscalers are still spending aggressively, neocloud capacity is expanding, token usage keeps growing, and NVIDIA continues to describe itself as supply constrained.
But the way all of that infrastructure gets financed is becoming much more complicated.
We’re seeing more SPVs, long-term leases, vendor guarantees, private credit, customer financing, residual-value support and suppliers helping customers secure the capital needed to keep building.
That can be a strength.
A company may have enormous demand for compute and still need help financing a $20B or $50B data center. If financing accelerates a project that ultimately produces strong cash flow, everyone can win.
The part I’m watching is what happens when the supplier starts taking risk on both sides of the transaction.
NVIDIA is locking up huge amounts of future supply while also helping parts of its customer ecosystem finance capacity.
Broadcom has been involved in financing structures tied to AI customers.
Neoclouds are taking on large commitments because they believe utilization will stay high enough to support them.
None of that makes the underlying demand fake.
But it does make the system more sensitive to utilization, rental pricing and customer credit quality.
That distinction matters to me.
If AI workloads keep growing fast enough, these structures could look brilliant in hindsight. Financing pulls forward capacity, more capacity enables more usage, and the resulting cash flow validates the investment.
But if utilization disappoints or token economics weaken, the question changes very quickly.
Who owns the equipment?
Who guarantees the lease?
Who absorbs the residual-value loss?
Who still owes the supplier?
And how much of the risk eventually travels back toward the companies that helped finance the buildout?
That’s why I’m starting to watch the financing structure almost as closely as the demand itself.
I’m still bullish on AI demand.
I’m just less willing to assume that every dollar of AI infrastructure spending represents the same quality of demand.
The next meaningful stress signal may not show up first in GPU orders.
It may show up in credit spreads, financing terms, guarantees, utilization or the willingness of capital providers to keep funding the next project.
That’s the part of the AI boom I believe deserves more attention now.
Demand tells us how big the opportunity is.
Financing tells us how fragile the path may be.
The Memory Cycle Is Changing. I Don’t Believe It’s Gone.
I’m always cautious when I hear “this time is different,” but memory is one area where I believe the structure really is changing.
The old cycle was simple: demand rises, prices jump, margins expand, everyone adds capacity, supply catches up, then overshoots.
HBM changes part of that.
It’s becoming much less like commodity memory and much more like a co-designed part of the AI system. Packaging, thermals, base dies, testing and customer-specific integration all matter now.
That gives suppliers better visibility into demand before they build capacity.
SK Hynix’s CEO recently said he expects tightness to last through 2030. I’m less focused on the exact date than the reason behind it: more AI memory is being built around specific customers and systems instead of being dumped into a generic commodity pool.
That could make the next cycle less violent.
There’s also a second-order effect. HBM consumes a lot of manufacturing resources, so every wafer pushed toward high-margin AI memory can tighten conventional DRAM as well.
That’s a great setup for the suppliers.
But I still don’t believe the cycle disappeared.
Margins this good attract capital. SK Hynix, Micron and Samsung are all expanding, while China keeps pushing to build domestic memory capacity. At some point, supply can still outrun demand.
So my read is:
HBM may make the memory cycle longer, tighter and more disciplined.
It probably does not abolish it.
Right now, I believe the evidence still favors the suppliers. The shortage looks real, AI demand looks durable, and customization is improving visibility.
I’m just not ready to declare victory over economics.
The investment edge is figuring out which part of the old cycle changed and which part didn’t.
The AI Capex Debate Is Focused on the Wrong Number
Everyone is arguing about how much Big Tech is spending on AI.
I keep coming back to a different question:
How long does the equipment stay economically valuable?
I’m bullish on AI demand.
I’m much less convinced that every dollar being spent to serve that demand will earn an attractive return before the hardware needs to be replaced.
That distinction matters.
Microsoft, Meta, Alphabet, Amazon and Oracle are spending at a scale we’ve never really seen before. The five are collectively on pace for roughly $750 billion of capex this year.
But capex itself doesn’t tell us whether the investment is good.
The chain I care about is:
Capex → utilization → revenue → cash flow → depreciation → replacement capex.
And depreciation is already becoming a much bigger number.
Microsoft’s quarterly depreciation expense went from about:
$4.7B → $5.2B → $5.8B
in the first three quarters of the prior fiscal year.
This year:
$7.1B → $7.9B → $9.0B.
At the same time, Microsoft’s servers, networking equipment and software asset base grew from roughly $133B last June to about $191B by March.
That is a lot of infrastructure entering the depreciation schedule.
Now here’s where I believe the question gets harder.
Accounting depreciation and economic depreciation are not necessarily the same thing.
Meta extended the useful life of certain servers and networking assets to 5.5 years. That accounting change alone reduced expected 2025 depreciation expense by roughly $2.9B.
I’m not suggesting there’s anything improper about that.
The question I care about as an investor is different:
Will a five-year-old AI server still earn an attractive return when the hardware being installed three years from now may produce dramatically more tokens per watt?
That’s where this gets uncomfortable for me.
AI hardware is improving incredibly fast.
New accelerators bring more compute, more memory bandwidth, better networking and better inference economics.
That is great for AI adoption.
But rapid improvement can also shorten the economic life of what was bought yesterday.
The old equipment doesn’t have to become worthless.
It can move down the stack.
Older GPUs can serve cheaper inference workloads, smaller models, research, fine-tuning or less latency-sensitive applications.
That would help extend useful lives.
But I believe investors should be watching that transition instead of assuming it happens automatically.
Because if the economic replacement cycle turns out to be shorter than the accounting depreciation cycle, reported earnings can look healthier than the underlying return on capital.
And the hyperscalers may find themselves doing something uncomfortable:
spending enormous amounts to grow AI capacity while also replacing enormous amounts of capacity they already built.
That’s the part of the AI boom I want to understand better.
Not:
“Is AI demand real?”
I believe it is.
Not:
“Will token consumption grow?”
I believe it will.
The question is:
How much free cash flow does each generation of infrastructure produce before the next generation makes it less competitive?
What would make me more comfortable?
High utilization.
Strong AI revenue growth.
Older accelerators staying economically productive.
Healthy resale or residual values.
And eventually, capex growth slowing while AI cash flow keeps climbing.
If we start seeing that combination, then today’s spending could look brilliant in hindsight.
If we don’t, depreciation and replacement capex may become much more important to the AI investment story than most people expect.
I’m bullish on the technology.
I’m still underwriting the economics.
Those are not the same thing.
Curiosity Before Capital. Evidence First.
The Yen Carry Trade May Be Getting More Fragile
I keep coming back to the yen because I don’t believe the real risk is simply whether USD/JPY goes up or down.
The bigger question is how much global risk has quietly been built on the assumption that cheap yen funding will remain available.
For years the trade has been pretty straightforward.
Borrow cheaply in yen.
Move the money somewhere with a higher return.
Treasuries. Credit. Equities. Emerging markets. Whatever offers enough yield or upside to justify the currency risk.
As long as Japanese rates stay low and the yen stays weak, that can be a very attractive trade.
And that’s what makes the current setup uncomfortable to me.
The weaker the yen gets, the more attractive the carry can look.
But the weaker it gets, the more pressure it creates inside Japan through import prices and inflation.
That increases the pressure on the BOJ to raise rates.
It also increases the chance of intervention.
We just saw that dynamic play out.
Japan and the U.S. stepped into the currency market in July after the yen fell toward 164 per dollar.
The intervention pushed it to roughly 155.
Now we’re back near 160.
At the same time, the BOJ is already at a three-decade-high policy rate of 1%, and a majority of economists now expect another hike in September.
That doesn’t mean the carry trade suddenly blows up.
It may keep working.
The U.S.-Japan rate gap is still meaningful, and investors may continue finding the economics attractive.
But I believe the asymmetry is changing.
Every additional move weaker in the yen may make the trade more profitable in the short run while also increasing the odds that policymakers eventually push back harder.
And if the yen suddenly strengthens, the problem is not just a currency loss.
Investors who borrowed yen to fund positions elsewhere may have to reduce those positions.
That means the assets being sold could be nowhere near Japan.
This is why I don’t really view the yen carry trade as a Japan story.
I view it as a global liquidity story.
Treasury Secretary Scott Bessent basically acknowledged the same transmission risk this week when he warned that disorderly yen moves could trigger forced unwinds across global markets.
That got my attention.
The part we can see is USD/JPY.
The part we can’t see nearly as well is how much leverage, positioning and risk-taking sits behind it.
That is what I’d be watching.
Not just the yen.
I’d watch:
BOJ rate expectations.
Japanese government bond yields.
Japanese inflation.
FX intervention.
Cross-asset volatility.
And whether a sharp yen rally starts happening alongside weakness in crowded global risk trades.
What would change my mind?
If Japanese inflation cools, the BOJ backs away from further tightening, and the yen stabilizes without repeated intervention, I’d worry much less about an unwind.
But if the BOJ keeps tightening while authorities are also defending the currency, I believe the probability of a more disorderly adjustment rises.
The yen carry trade may not be dead.
It may actually still look pretty attractive.
That’s exactly why I believe it deserves more attention now.
Sometimes the trade looks safest right before the assumptions underneath it begin to change.
Curiosity Before Capital. Evidence First.
@PodcastAlphaX@Jason@theallinpod I’m not sure what to make of this. I still distinctively remember Jeff Bezo saying the Segway was “one of the most famous and anticipated product introductions of all time” and “a product so revolutionary, you'll have no problem selling it.” I’m still traumatized by that.
This feels like another inflation risk worth watching.
Diesel runs through almost everything: trucking, agriculture, construction, shipping and eventually the price of goods on the shelf.
If refiners are already running this hard and postponing maintenance, even a few outages could make an already tight market worse.
I believe the Fed angle matters if these higher diesel costs start bleeding into broader inflation and expectations.
That would make the rate-cut conversation a lot harder.
This is the part of the $MRNA story I’d be watching hardest now.
I’d be cautious saying a $50K clinic treatment is literally the same thing as intismeran. The manufacturing, quality control and Phase 3 evidence matter.
But Friedberg’s broader point lands.
If personalized neoantigen therapy gets easier and cheaper to reproduce, how durable is a ~$500K price point, especially outside the U.S. where medical tourism and different patent regimes matter?
For me, the next question isn’t just “does the cancer vaccine work?”
It’s whether Moderna’s clinical validation, manufacturing know-how and IP create a moat strong enough to defend the economics.
I can’t say that I like Chamath due to the wealth destructions he pulled being the SPAC King. However, the fiscal mechanism he’s pointing to is worth watching.
I don’t believe 6% on the 30-year is some magical cliff by itself. What matters is why yields are getting there.
If investors keep demanding more compensation for inflation, deficits and Treasury supply, higher interest costs start feeding back into the fiscal problem that pushed yields up in the first place.
That’s the loop I’d worry about.
The Fed can influence rates. It can’t fix the structural deficit for Congress.