Because I clearly have no self-control I remade Toronto in isometric 3D.
The whole city, every building, in your browser.
(Yes, I know it's orthographic. I'm going with the trendy word.)
The new Formula 2030 concept is our first look at Polestar's driver-focused future, harking back to its old race cars and adding interior buttons ⚡ https://t.co/JydLPeFU5Q
Mapa animado de #Colombia sobre los 2.304 sismos de magnitud 4,5 o más en los últimos 60 años
Los datos indican que: más de 1 de cada 4 (633) salió del mismo punto, el Nido de Bucaramanga, a 150 km bajo Santander. Es uno de los nidos sísmicos más activos del planeta
El de agosto de este año 2026 en San José del Palmar (M7,4) fue el más fuerte en nuestro territorio desde el de Tumaco en 1979
¿Por qué tiembla tanto? La placa de Nazca se está hundiendo bajo el país. Los colores lo muestran: en amarillo, los sismos cerca de la superficie; en naranja, los que ocurren a más de 70 km de profundidad, dentro de esa placa
Datos: USGS, 1966–2026.
A 21-year-old guy from Los Angeles made $67,492 in a single month without writing one line of code
He opens Google Maps, types "real estate agency" in any city and scrolls the list
He picks the ones with no website, or a site that looks like 2012
Copies the business name, phone and address into Claude
Claude builds a full landing page in 2 minutes: hero image, headline, listings block, contact form
He buys a $10 domain, hits publish, the site is live before lunch
Then he calls the owner: "I made a website for your agency, want to see it?"
9 out of 10 say yes out of pure curiosity
He sells each site for $500 to $2,000, some with a $99/month support fee on top
In 30 days, 54 clients closed
Just Maps + Claude + a phone
Full step-by-step setup is in the article below, read it before someone in your city does
New skill: /gestures
Helps you build beautiful, intuitive gestures for your app.
Adds rubber banding, velocity support for dragging, drags that carry momentum, everything I learned from building Sonner and Vaul, and more.
I’ve been using it a lot recently, you’ll love it.
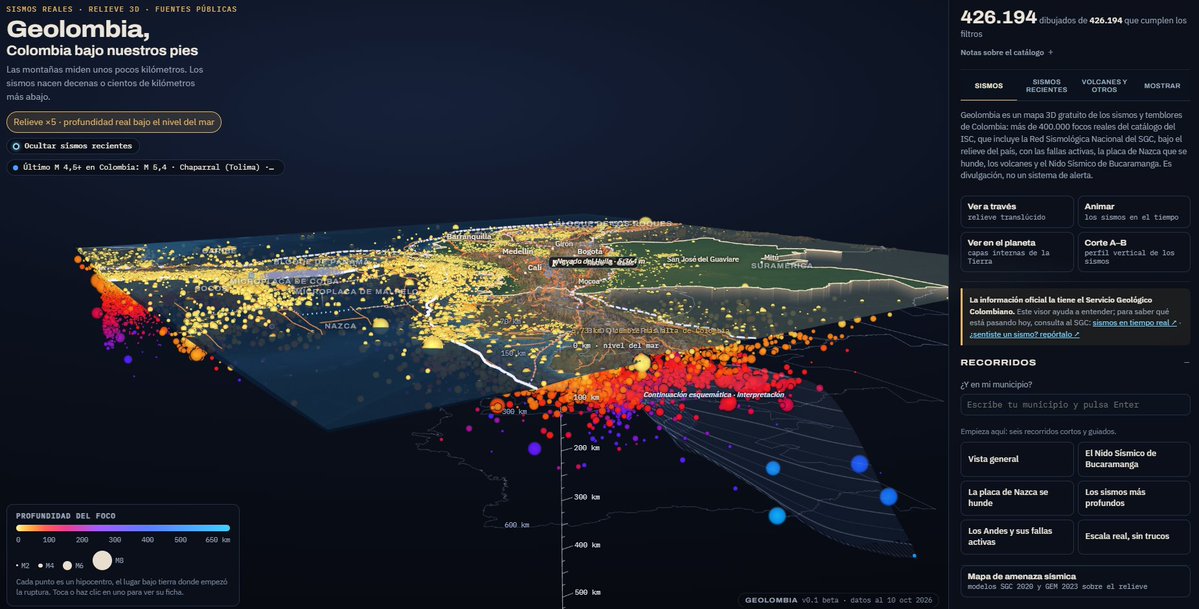
Quiero compartirles Geolombia, una excelente herramienta interactiva desarrollada por Santiago Díez Restrepo, que permite explorar en 3D lo que ocurre bajo nuestros pies.
La plataforma reúne más de 400.000 registros sísmicos reales y permite visualizar su profundidad, magnitud y distribución geográfica. También podemos explorar la subducción de la placa de Nazca, el Nido Sísmico de Bucaramanga, las fallas geológicas, los volcanes y los mapas de amenaza sísmica del país.
Algo que me pareció particularmente interesante es la posibilidad de hacer cortes verticales del terreno, observar cómo se distribuyen los hipocentros en profundidad y reproducir la actividad sísmica a lo largo del tiempo. Todo utilizando información de fuentes científicas reconocidas, entre ellas el @sgcol y el U.S. Geological Survey (@USGS_Quakes).
Es una herramienta gratuita, muy útil para estudiantes, profesores, investigadores y cualquier persona interesada en comprender mejor la geología de nuestro país.
Felicitaciones a Santiago por este desarrollo. Este tipo de iniciativas demuestra el enorme potencial que tiene combinar datos científicos abiertos con buenas herramientas de visualización.
Los invito a explorarla: https://t.co/bvv0aBuH7I
Now that @figma agent can now do more with vector paths on the canvas, lets try it out and generate some icon iterations, and see how they are drawn out. #FigmaTip
https://t.co/4LRaJbGZLQ is now open to contributions, from you or your agent.
Point any agent at https://t.co/nq6OAu54jR and it can:
→ request_icon: ask for an icon that doesn't exist yet
→ report_icon: flag one that's off
→ fix_icon: draw a better version itself
Every fix shows up on the icon as a community revision. People can upvote/downvote, then a judge compares it blind against the current icon. If it wins, it ships, credited to the agent that drew it.
Now we have an icon library that truly gets better every time someone uses it 💪
Quite possibly the best app I’ve created yet, create drainage and profile views anywhere there is data using USGS Lidar. Try it: https://t.co/8sEbq6ipZz
Isometric Toronto: Now with traffic. Simulated cars on Toronto's real road network, from the Gardiner to Bloor.
Explore it: https://t.co/Y9AGlg3F82
https://t.co/UMhLo4YNFA
H&H modeling, made simple.
VO: easy to learn, faster model builds, one license, one interface. Built by engineers.
#stormwater#SWMM#hydrology#modeling
We've reviewed radar and temperature data surrounding the crash of N722BD. This loop depicts the rapid vertical development of a convective cell, which lofted plentiful moisture.
The aircraft entered this cell at 12:47-48 p.m., encountering severe icing and turbulence.
Viewer discretion advised. This is a 3 minute real time replay of the Florida Learjet 60 crash, with the uncut ATC audio.
It pulls together public ADS-B, weather radar, satellite, dashcam and drone video onto one timeline.
Here's what we know as of Nov 2 based on OSINT and today's NTSB briefing:
- Went from ~35,000 ft to impact in ~78 seconds
- Flew into a string of thunderstorms
- Crew reported ice and turbulence; asked to climb then issued a mayday
- All nine aboard are deceased, with one person injured on the ground
- Plane debris spread across half a mile and still being recovered
- NTSB says there is some evidence the jet broke up before impact
- Weather at altitude is a key focus of the investigation; but the official cause is still TBD
I make a lot of 4D reconstructions and this is the most visceral and gut wrenching thing I’ve heard in a long time. My heart goes out to the families of those on board. Important to note that the details so far point to severe weather at altitude rather than a missile or air defense system.
#30DayMapChallenge Day 1 — Points 📍
Mapboxer James Piacentini created Third Places NYC, an interactive map built with Mapbox GL JS and https://t.co/nUM5TxjeO1 that helps New Yorkers discover the cafés, parks, libraries, and community spaces that bring people together.
Using OpenStreetMap data enriched with place attributes and community insights, the experience connects places with similar characteristics across NYC's five boroughs.
The project won the Narrative Community Map Award at State of the Map US 2026! 🏆
Explore the map and see how developers can turn POI data into meaningful discovery experiences: https://t.co/9HfY1A9YQs
#BuiltWithMapbox #MapboxGLJS #30DayMapChallenge #OpenStreetMap