Weekend prep starts now!
Everyone watches futures. The leverage. The funding. The liquidations.
Pull up aggregated spot depth instead.
Across every major exchange. Real buyers. Real sellers. No leverage distorting the picture.
Now look at what happens through the dips.
If price drops and the spot bids keep stacking beneath it - that is real demand supporting the move.
Spot is king. Futures can fake a move for hours. But spot demand stacking on the bid through a dip is something you cannot fake.
If the spot depth is holding, the buyers have not left.
Position with them.
🚨 $BTC IS FORMING A WYCKOFF ACCUMULATION PATTERN...
What indicates this?
Market is currently completing "Automatic Rally phase" after setting a local high around $82.5k
Based on historical data, this stage is usually followed by downside movement - but setup is not that simple...
Here’s detailed plan:
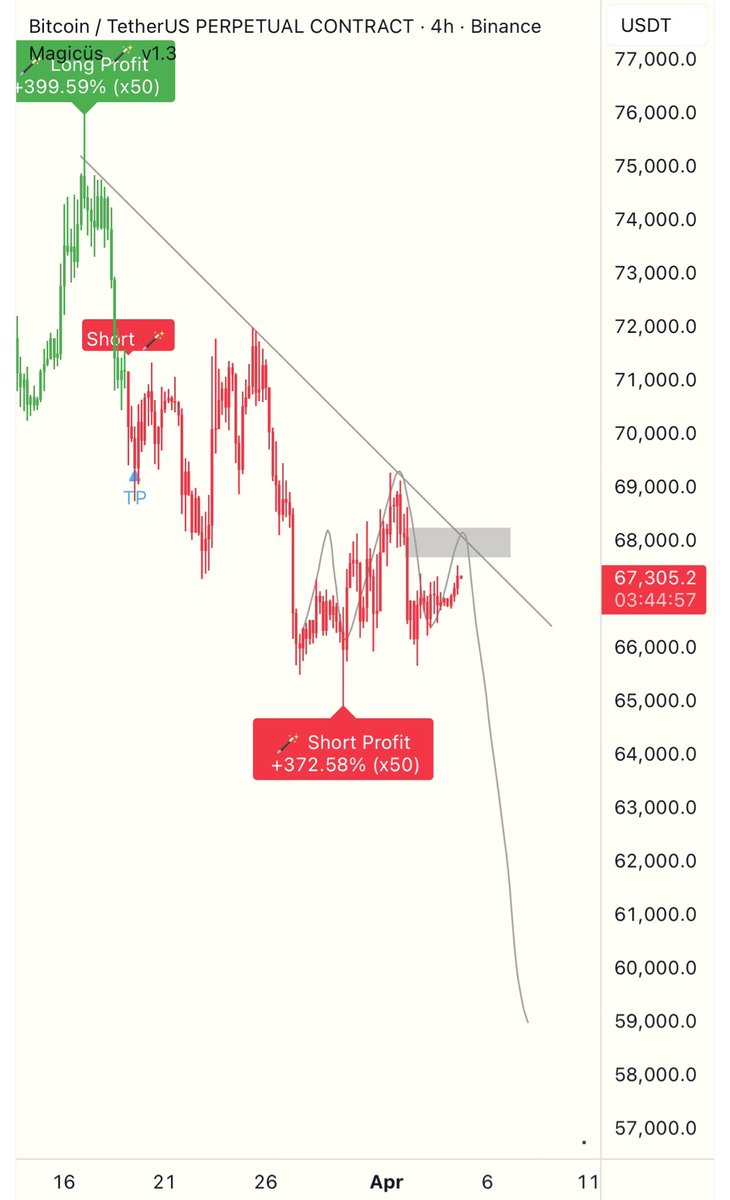
1. Gradual drop toward $60k
2. Formation of a Secondary Test
3. Bounce back toward $75k+
4. Re-sweep and final bottom formation
5. Slow recovery with a Last Point of Support
6. Break of resistance and move toward $90k+
Main focus is a potential ~$50k bottom, followed by gradual upside with BTC accumulation
Completing all stages will take time, but by the end of this year we could potentially be at stage 6 - around $90k+
Don’t rush into accumulation - turn on notifs, I’ll update
$BTC 2026 Bear Market Structure | WXY
This is how I see the structure of this Bear Market
We've already spent more time chopping between $62-78k than between $84-97k back in November-January, so now I assume we are dealing with a Double Zigzag (WXY) and this move from $60k to $79.5k (could go even higher as the next major resistance sits at $85k and the ABC target is $82.5k, so a little more upside would be quite normal) is Wave (X) between two bearish Waves (W) & (Y).
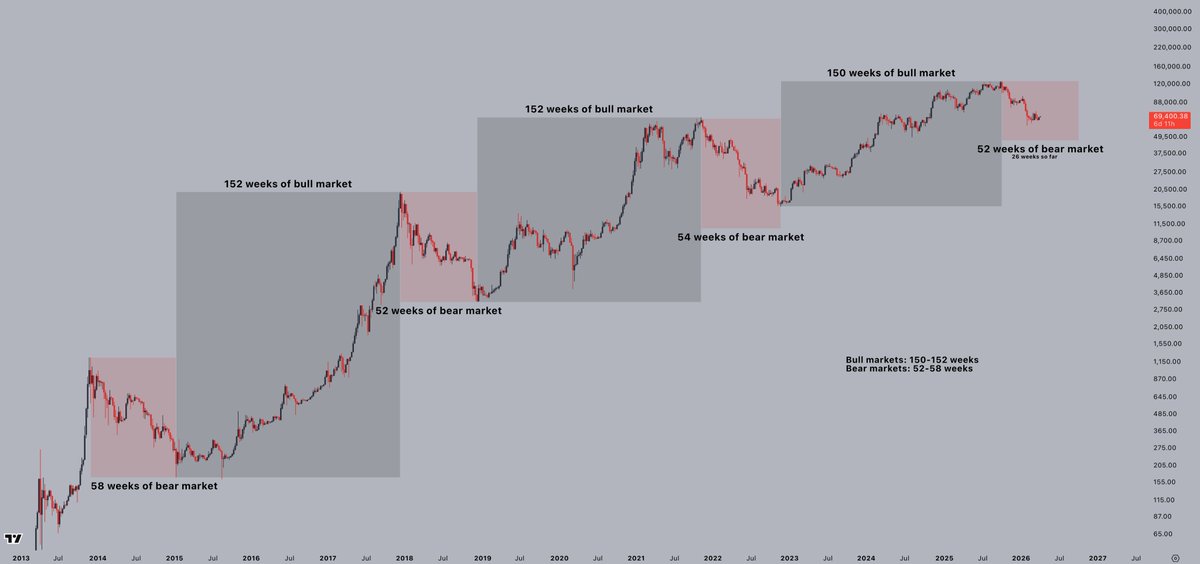
From the timing perspective, we still have ~5 months of this bear market left.
Wave (W): $126k --> $60k
Wave (X): $60k --> $80k
and now I'm expecting the final wave down - Wave (Y): $80k --> $40k (Bear Market Bottom in September-October 2026) 📍
Historically, bear markets last for about a year.
If that pattern repeats, we're about halfway through by now.
Would you survive another 6 months of pain & boredom?
$BTC
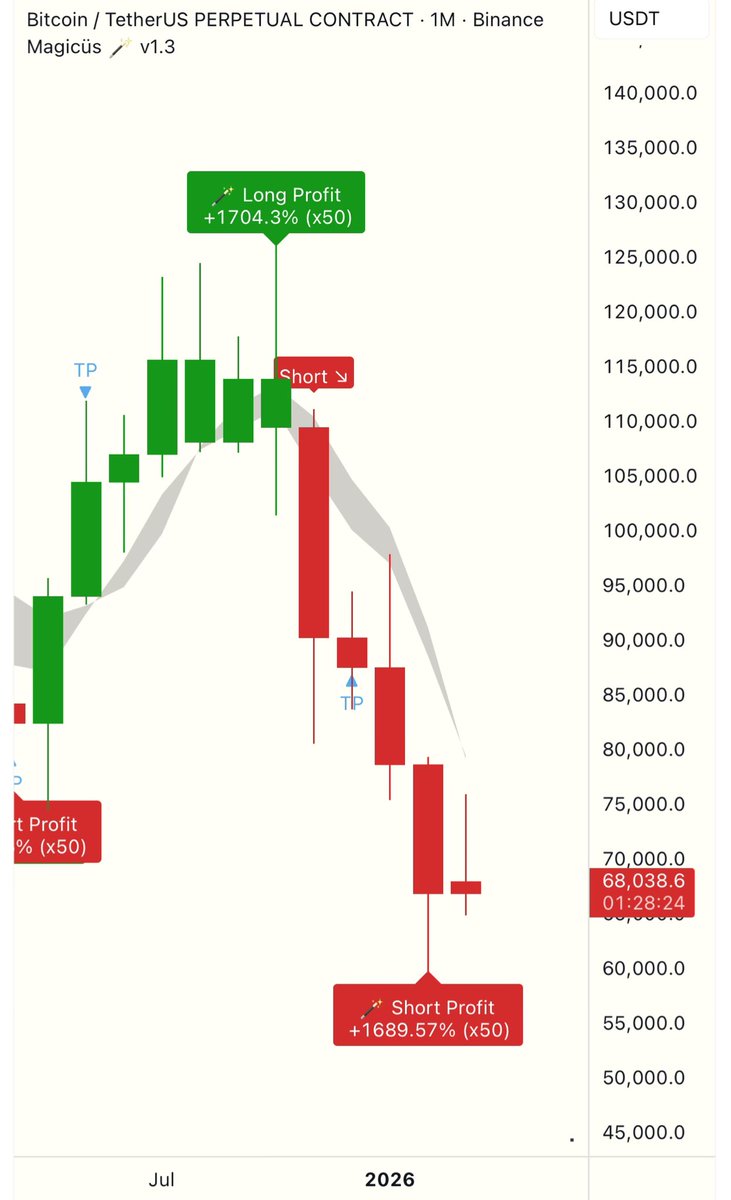
The monthly closing will be quite bullish, so be clear that April will be in a month where we will hit rock bottom, but you have to fill last month's wick first, so at some point between 50-60K we will try to go only up. $BTC
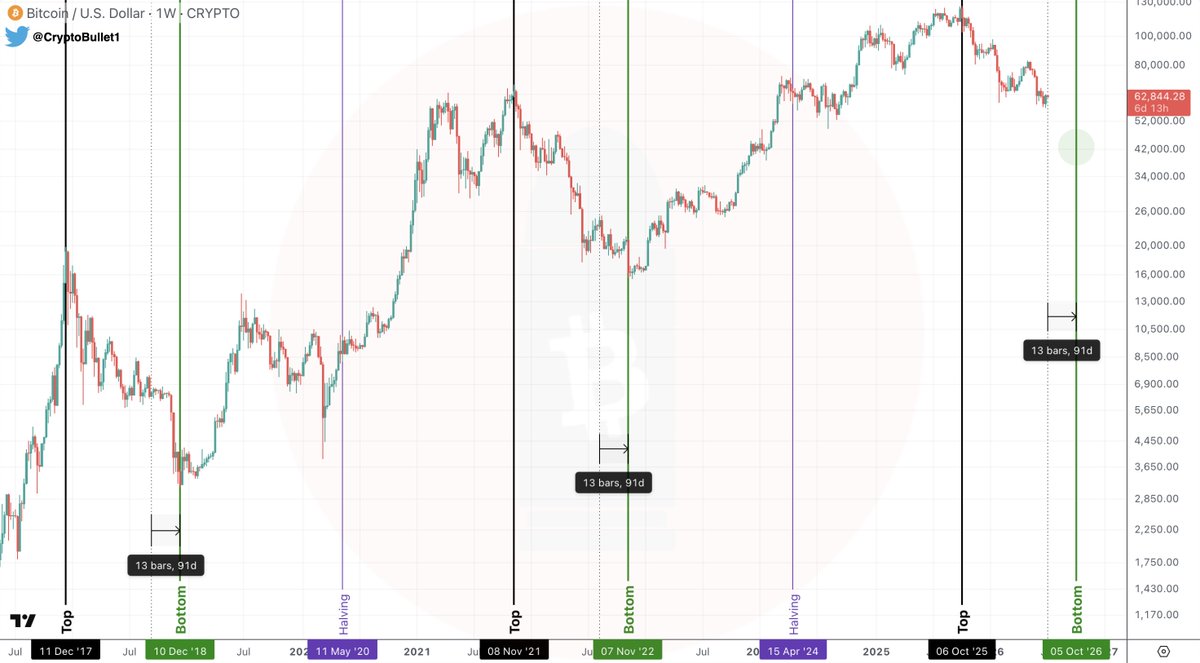
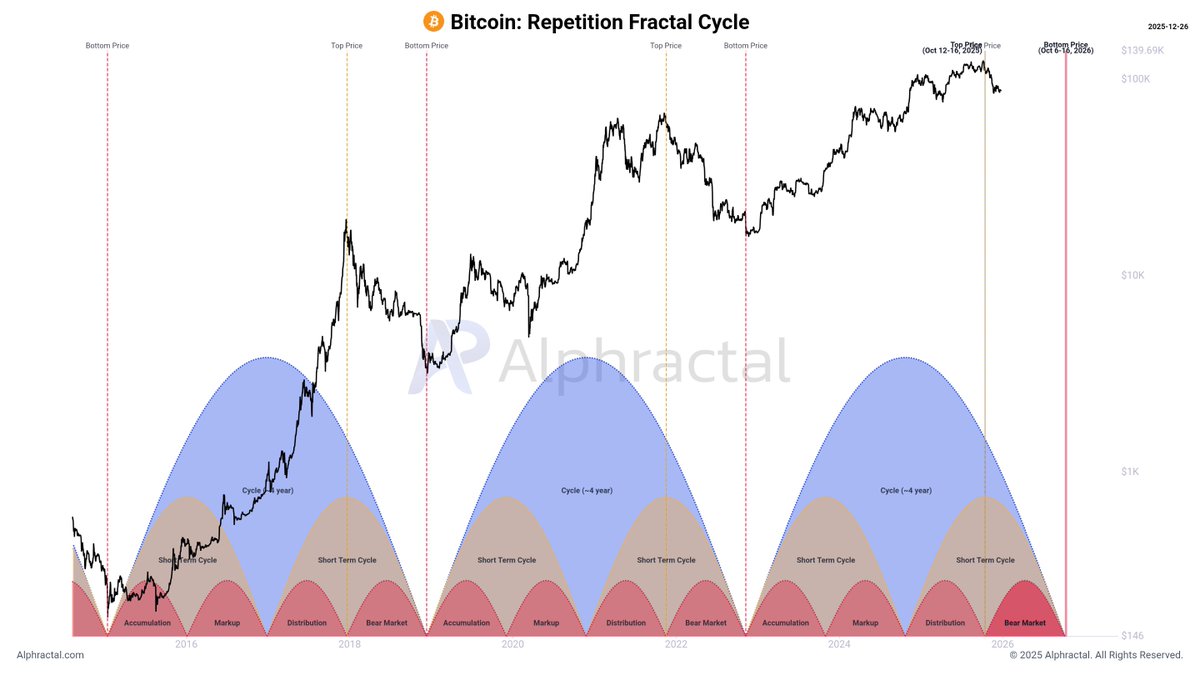
Bitcoin’s fractal suggests the next cycle bottom may form around October 4, 2026.
Based on historical cycle symmetry, the most favorable time window for accumulation would likely be concentrated between:
🗓 October 6, 2026 and October 16, 2026
📉 Estimated price range:
$41,500 – $45,000
⚠️ This is not a fixed rule, nor a deterministic price forecast.
It represents a fractal rhyme of market cycles — something Bitcoin has historically respected more often than ignored.
Markets do not repeat exactly —
but they rhyme with an uncomfortable frequency.
@Alphractal | Bitcoin Cycle Intelligence
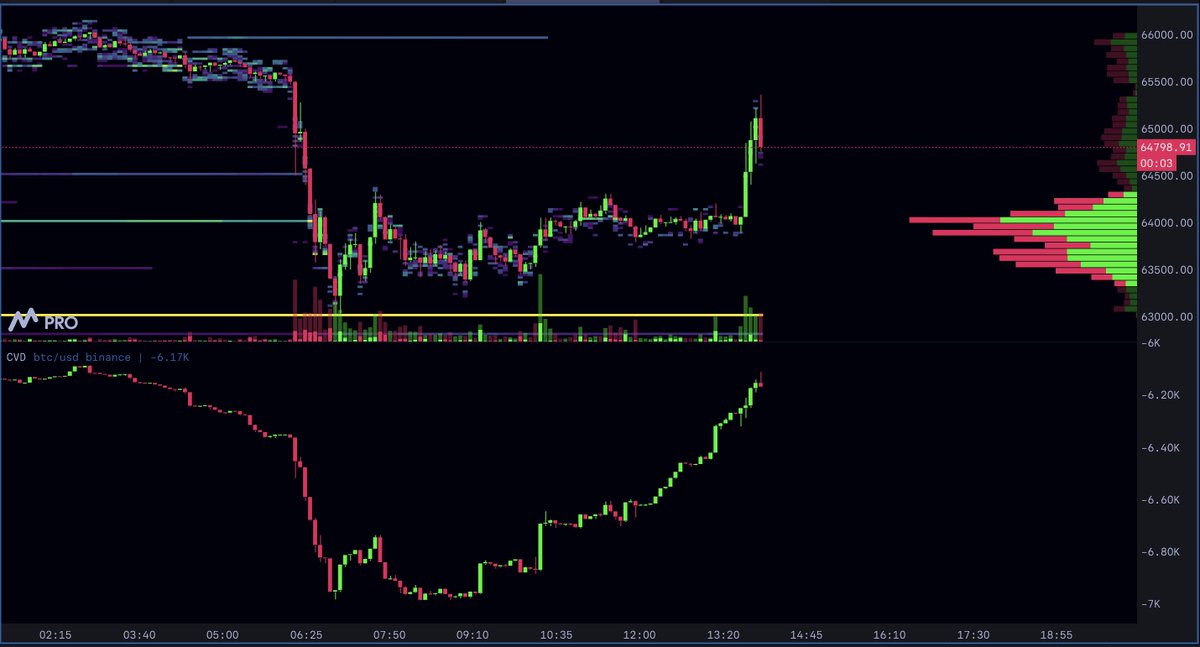
Quick Scalp Strategy: Aggregated Liquidations + Delta Trap
When price flushes into a key level, watch the quality of the move, not just the size.
If you see:
• Heavy liquidations firing
• Strong negative delta (aggressive selling)
• Price stopping or slowing at the level
That’s often forced selling being absorbed, not continuation.
Once liquidation flow fades and price reclaims the level, the trapped sellers become fuel for a bounce.
Entry: After the reclaim / acceptance
Invalidation: Below the exhaustion low
Wait for absorption, not panic - then strike.