GSE RECAP | JUNE 29, 2026 📊
GSE-CI: GH¢14,725.92 -0.28% 🔻
GSE-FI: GH¢8,277.53 +0.27% 🟢
Top Gainer: IIL +6.25% to GH¢0.17 🚀
Top Loser: KASA -5.53% to GH¢1.88 📉
Red vs Green. We post both.
https://t.co/6V93cFXuzZ
#GSE#InvestGhana
MARKET OPEN ALERT 🚨
ETI up +0.88% at open. GHS 2.27 → GHS 2.29.
Pan-African banking, steady.
24 Jun 2026 | 10:00 AM GMT
Track it live on MulaDataHub 👇
https://t.co/6V93cFXuzZ
#GSE#ETI#InvestGhana#MulaDataHub
@Kasaprekogh said +10.01% at open. No warning. No context. Just +0.21.
GHS 2.10 → GHS 2.31. Manufacturing sector not playing today.
23 Jun 2026 | 10:00 AM GMT
Track it live on MulaDataHub 👇
https://t.co/6V93cFXuzZ
Ghana stock market data used to be a whole scavenger hunt. these people said no and built https://t.co/Fhjpz552gv for free
follow @mulatechnology, they cooked!
Here’s Everything that Happened at the World Cup while you were at Sleep.
-Ghana disgraced hatewatching Nigerians by winning Panama.
-Columbia defeated Uzbekistan 3-1 but the scoreline does not tell the true story of the game
Chasing GSE news across 5 sites + Twitter + radio? There’s a better way.
*Market & Business News* on MulaDataHub
1. *Aggregated feed* - GSE updates, company announcements, economic news in one place
2. *No noise* - just Ghana market news that actually moves stocks
3. *Fresh daily* - see what’s impacting prices before the next session
Context is alpha. If you don’t know _why_ MTN dropped, you’re just guessing.
“Which stock is better, MTN or GCB?”
Wrong question. Better question: “Compared on what?”
*Compare Companies* on MulaDataHub answers that
1. *Side-by-side metrics* - Market cap, EPS, DPS, P/E, volume. All in one table, no tab-switching
2. *Overlay charts* - plot 2-4 GSE stocks on the same 1Y/5Y chart. See who actually outperformed
3. *Quick gaps* - spot dividend differences, valuation gaps, volatility differences instantly
4. *Make it visual* - colors, sparklines, clean layout. Data that makes sense in 10 seconds
Investing is about relative decisions. You’re not picking “a good stock”. You’re picking the better stock for your goal.
Stop comparing in your head. Start comparing on screen.
GSE data shouldn’t feel like guesswork.
*Historical Charts + Key Metrics* on MulaDataHub puts context behind every price 📊
1. *Interactive charts* - zoom from 1 day to 5+ years. Spot cycles, not just spikes
2. *Clean visuals* - candlesticks, volume bars, % change. See trends at a glance
3. *Core metrics in one view*: Market cap, EPS, DPS, P/E, trading volume. No more switching tabs
4. *Company history + performance* - understand _why_ a stock moved, not just _that_ it moved
Price tells you what happened today. Charts + metrics tell you what’s been happening for years.
That’s how you stop chasing hype and start investing with context.
Watching the GSE refresh every 5 mins on a broker site? We fixed that.
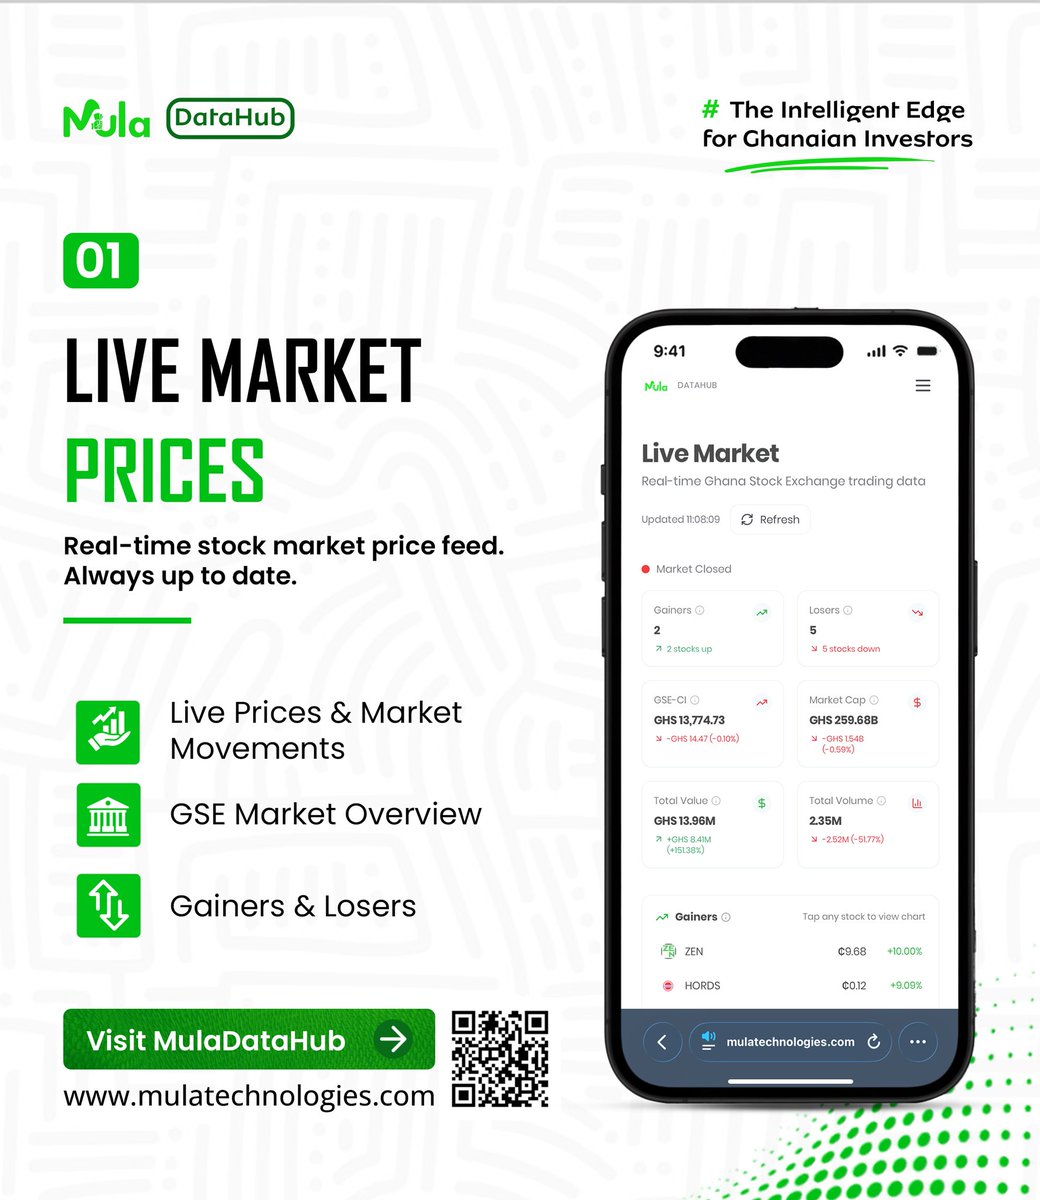
*Live GSE Prices* on MulaDataHub 📈
1. *Real-time quotes* - prices update as trades happen, no delay
2. *Gainers + Losers* - see what’s moving right now at a glance
3. *Volume spikes* - know when big money is entering or exiting
4. *One dashboard* - every listed company, one view, no tabs
If you trade GSE stocks, you know timing is everything. Now you’ve got the timing.
Which GSE stock are you watching live today?
https://t.co/cSgYQ5rG7a