Sports (running, tennis, TDOT teams) and stocks!
Always go back to the heart of who you are. #BeDifferent. We don’t need to chase what everyone else is chasing.
#Run🏃♀️ on a spring day in October #1HRrecovery. Longer than planned=Epsom salts! When you didn't get an expected moment with someone who inspired ~ "And my heart burdened be, & I am still & wait here in the silence, until you come & sit awhile with me." https://t.co/8VBYkn4H0J
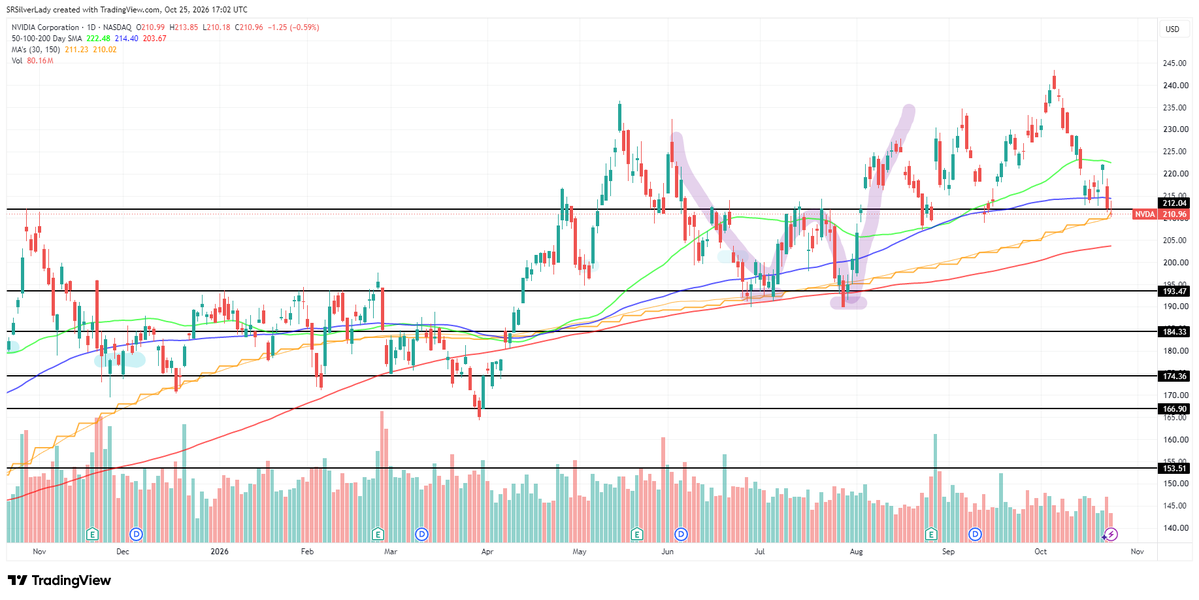
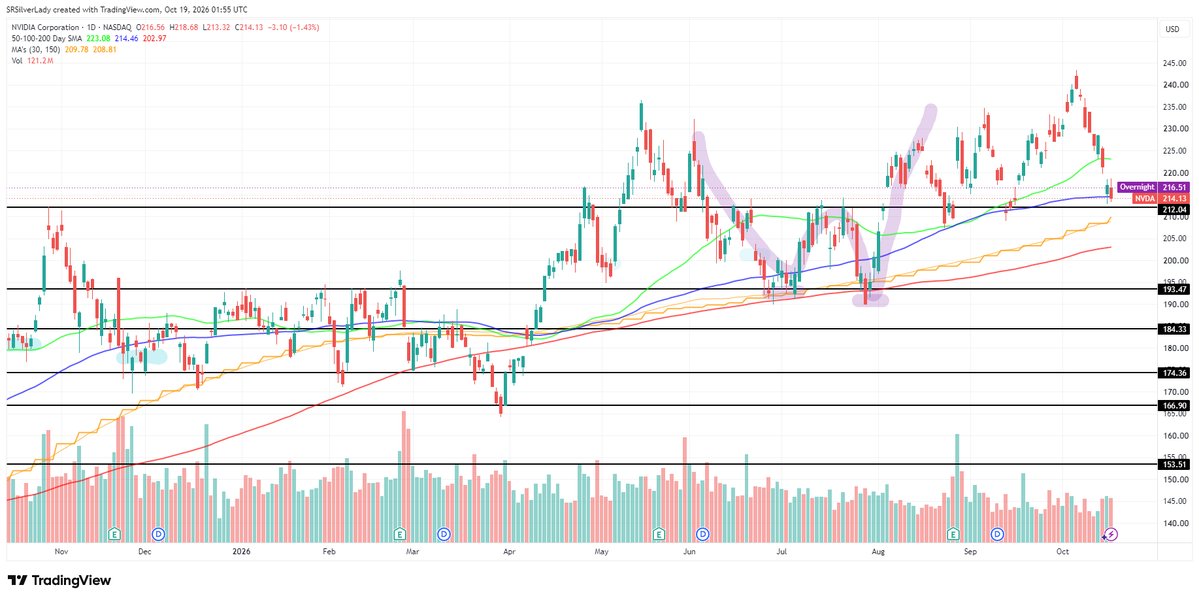
Wkend homework: Not a hot look for #NVDA $NVDA #Nvidia ~ breaking below 212; which was a huge area of support. If ⏬ momentum (bearishness) continues, could slide to its 200MA @ 200. The MAs havn't broken down. 50MA is curved down ever so slightly now...make it or break it time.
Wkend homework: Update #BN $BN #BrookfieldCorporation Looking solid; holding the line. Resting right on support @ 51ish for the past few weeks now. Carved out buying support & a floor. Lowers the risk; Could be shaken down to 42 on the 🐻 bear side. Bull potential: move up to 68.
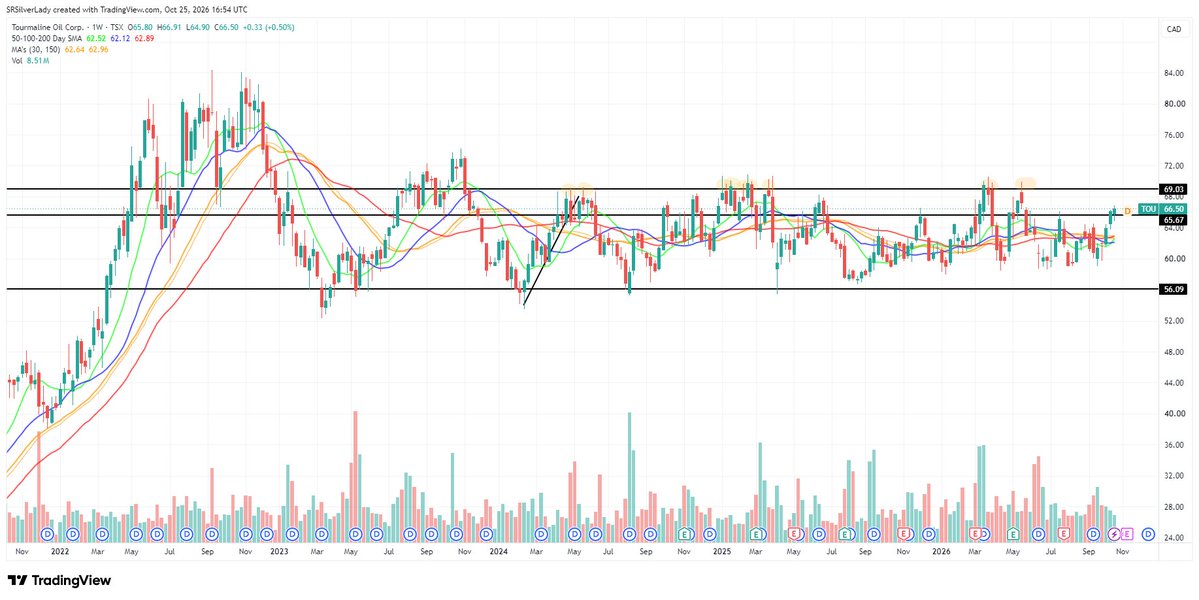
Wkend homework: #TOU $TOU #OilandGas#TourmalineOil 🇨🇦 ~ Bounced off the low end of its trading range & moving back up now to area of resistance around 69. Will it be able to move up past it or will it be rejected again? Need buyers and more volume....what will be the catalyst.
#TOU $TOU #TourmalineOil#oilandgas ~ It's been interesting to watch - this one is stuck in a solid trading channel. Has tried to move above 69ish at least 9/10 times since April 2024. In the middle of the trading range - potential to be a strong breakout either way.
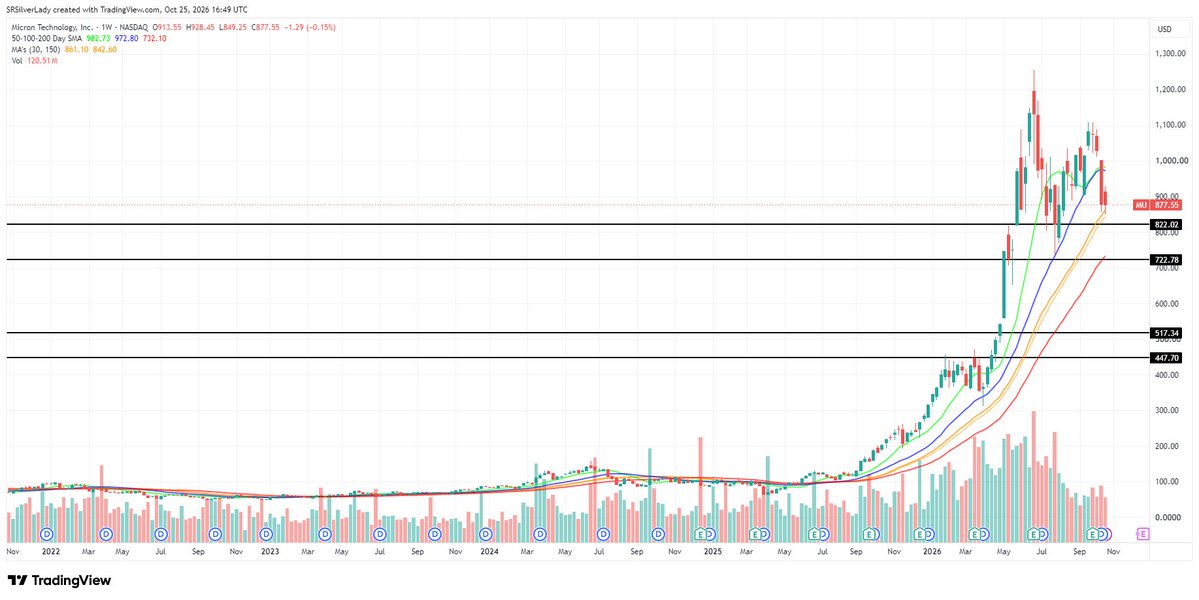
Wkend homework: #MU $MU #Micron ~ Quality & low PE but sky high price? It tried to get back to highs @ 1,200 but could not even form a double top; sellers came in at 1,100. Bull potential to reverse back up off the 30 week average OR on the bear side, move ⏬ to it's 200MA - 725.
Wkend homework: #PEP $PEP #PepsiCo Great few weeks for #DividendKings. Doing what it wants to do; moving ⏫ off the #doublebottom to pivot; SO FAR. Could turn back ⏬. Back ⏫ to the #50MA. Would take time to recover; watching for a move to the neckline @ 160's; then breakout ⏫
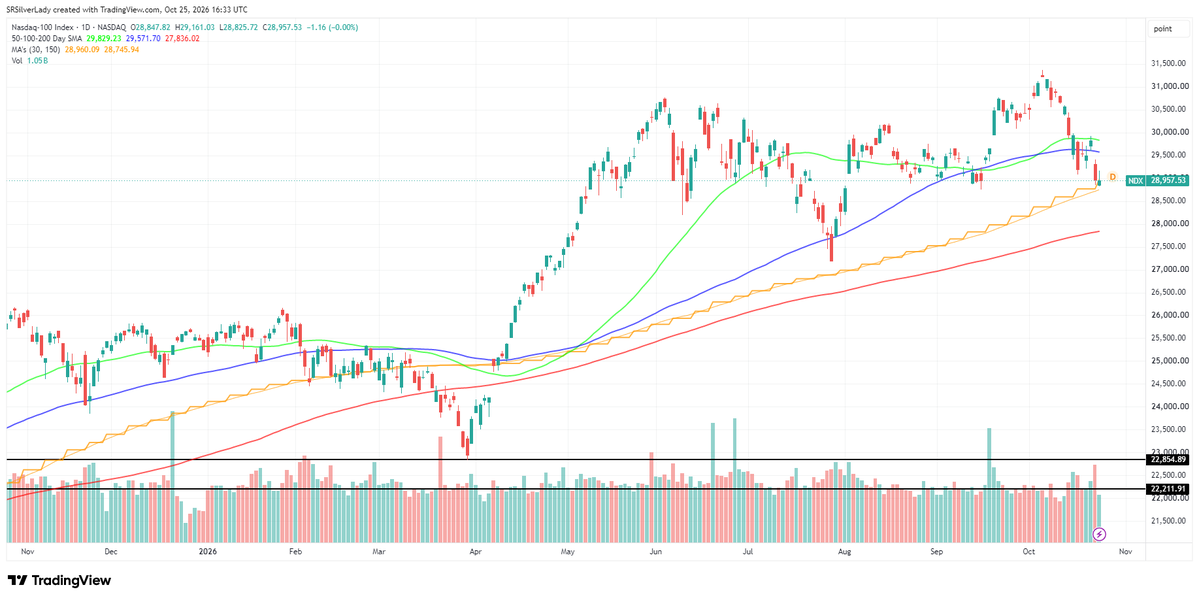
Wkend homework: #NDX $NDX #Nasdaq is only down 7 percent from its highs - not even in correction territory and markets are in fear mode already. Still in October, seasonally weak month: possible for a move down to its 200MA which is another 1000 points lower - another week of 🩸?
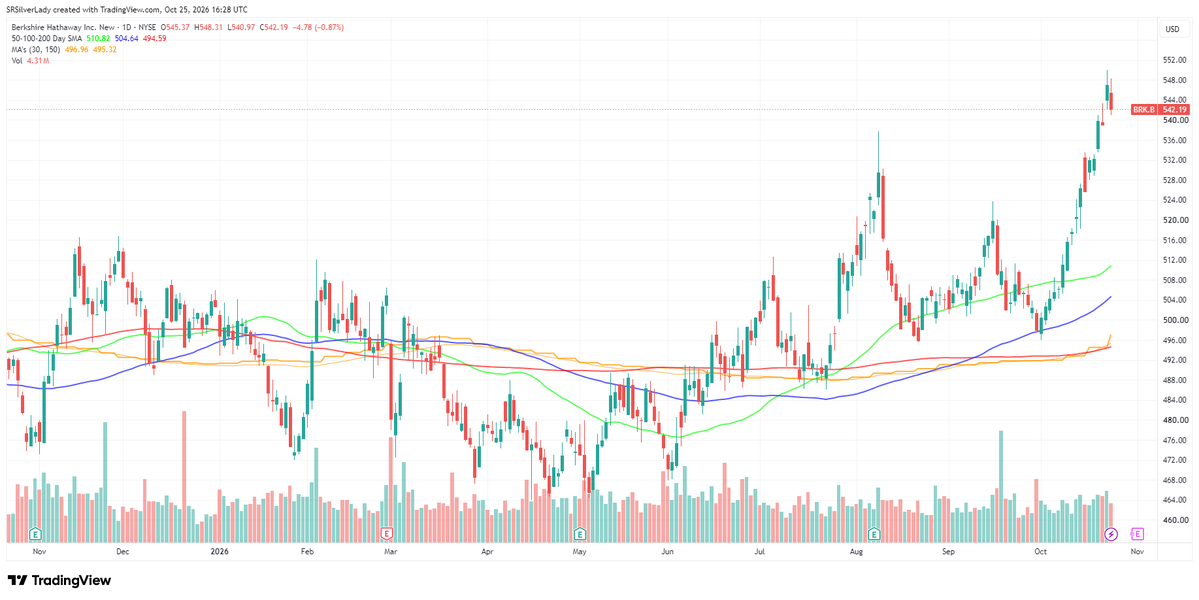
Wkend homework: #BRK $BRK #BerkshireHathaway - With market selling off last week into "extreme fear" - with it's bond/cash position and conservative holdings, BRK moved up - up 8% in October. A great hedge. It went up 10 days in a row in Oct, first time it's done that since 2018.
Wkend homework: #NOW $NOW #ServiceNow ~ Strong MA recovery; early stage uptrend. #50MA moved over the #200MA in Sept for a #GoldenCross- ⏫price then brought the 100MA to move over the 200MA. Earnings come out next week. Strategy: could DCA into momentum ⏫ to maximize profits...
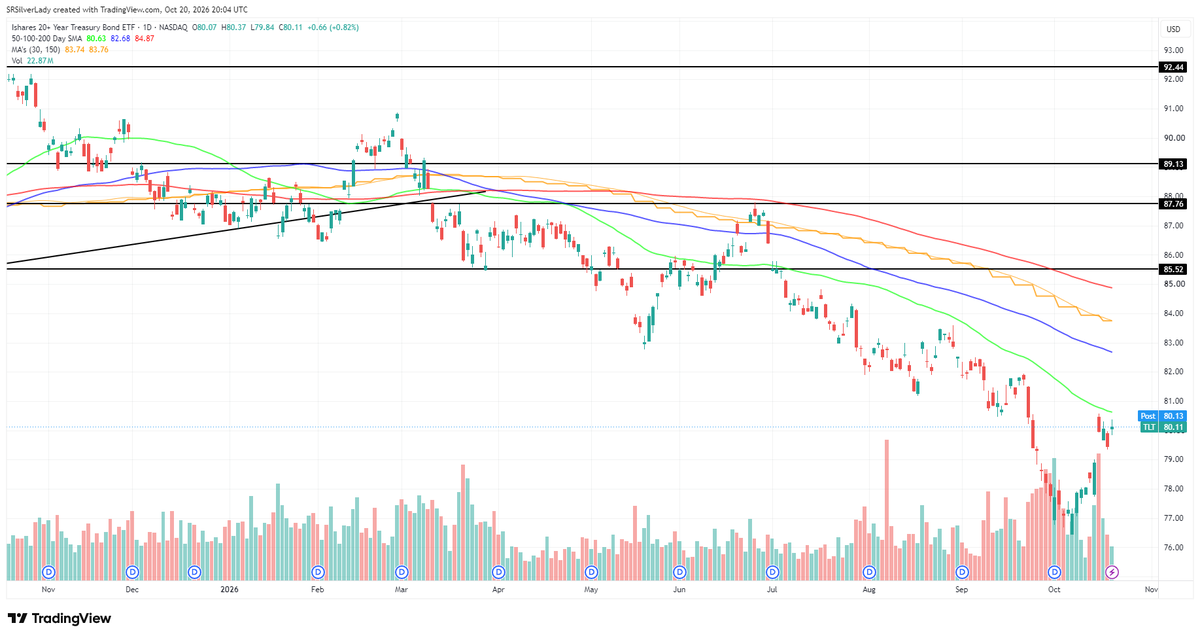
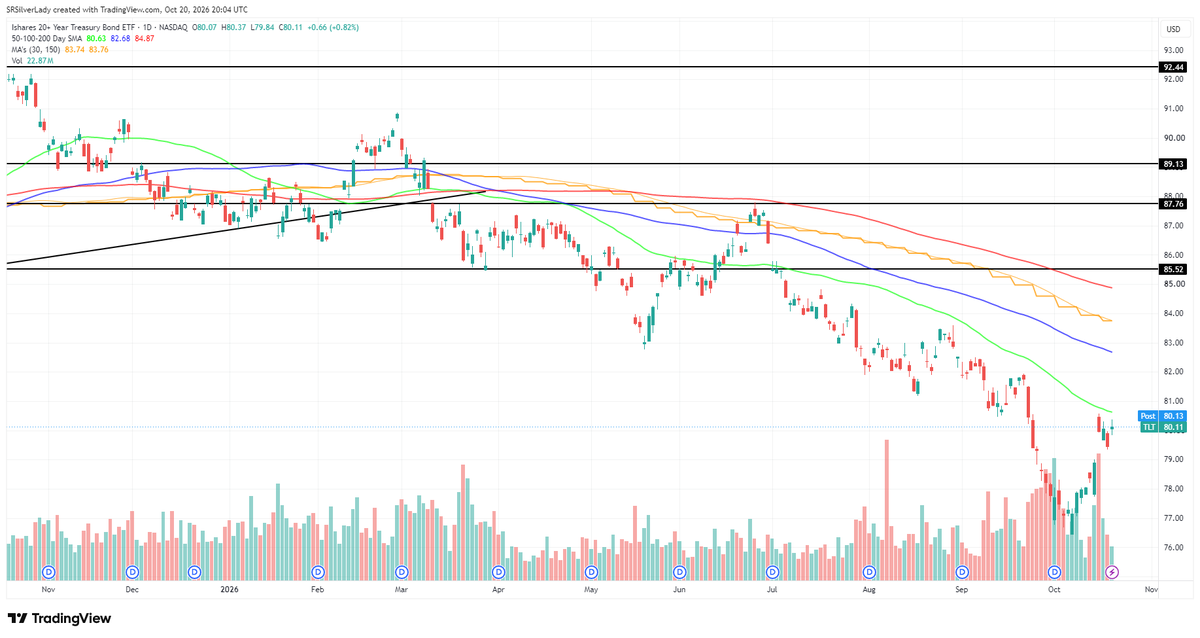
#TLT $TLT #LongTermUSTreasuries ~ With market uncertainty, rising #interestrates & potential for 2027 being a down YR; this is the most hated trade/investment right now #longbonds. Oversold; yet rebounding in October, coming up to the #50MA. Contrarian investment; uncrowded...
This is a pretty balanced take on the #markets. After midterms are done; potential for a Santa Claus rally. However there are headwinds: raising #interestrates too high has a history of causing crashes & we 👀 poor market breadth. Still good to add to hedges and plan for 2027.
Q4 and post-midterm seasonality remain overwhelmingly bullish.
Historically, the fourth quarter has been the strongest quarter of the year for the S&P 500 in terms of consistency of positive returns. Over roughly the past 80 years, Q4 has produced a positive return about 80% of the time, compared with approximately 60%–64% for the other three quarters.
The midterm election cycle adds another powerful seasonal tailwind. Stocks have historically performed particularly well as the uncertainty surrounding midterm elections is removed. Depending on the precise starting period used, recent historical studies put the S&P 500's positive rate during Q4 of midterm years at roughly 83%–85%.
Given the backdrop of strong earnings growth and, at least for now, no clear evidence of recession, history argues that the bulls should continue to receive the benefit of the doubt.
However, seasonality is a tendency—not a guarantee. Fed tightening, deteriorating breadth, rising interest rates and elevated oil prices represent meaningful counterweights. At a minimum, those conditions increase the probability of volatility and make the current environment considerably less straightforward than the historical averages suggest.
Individual stocks have already been correcting beneath the surface of the major indexes. More than 35% of S&P 500 stocks are currently down 20% or more from their 52-week highs, even as the index itself remains relatively close to record territory. In other words, a significant correction has already occurred—it has simply been masked by the strength of a relatively small number of heavily weighted stocks.
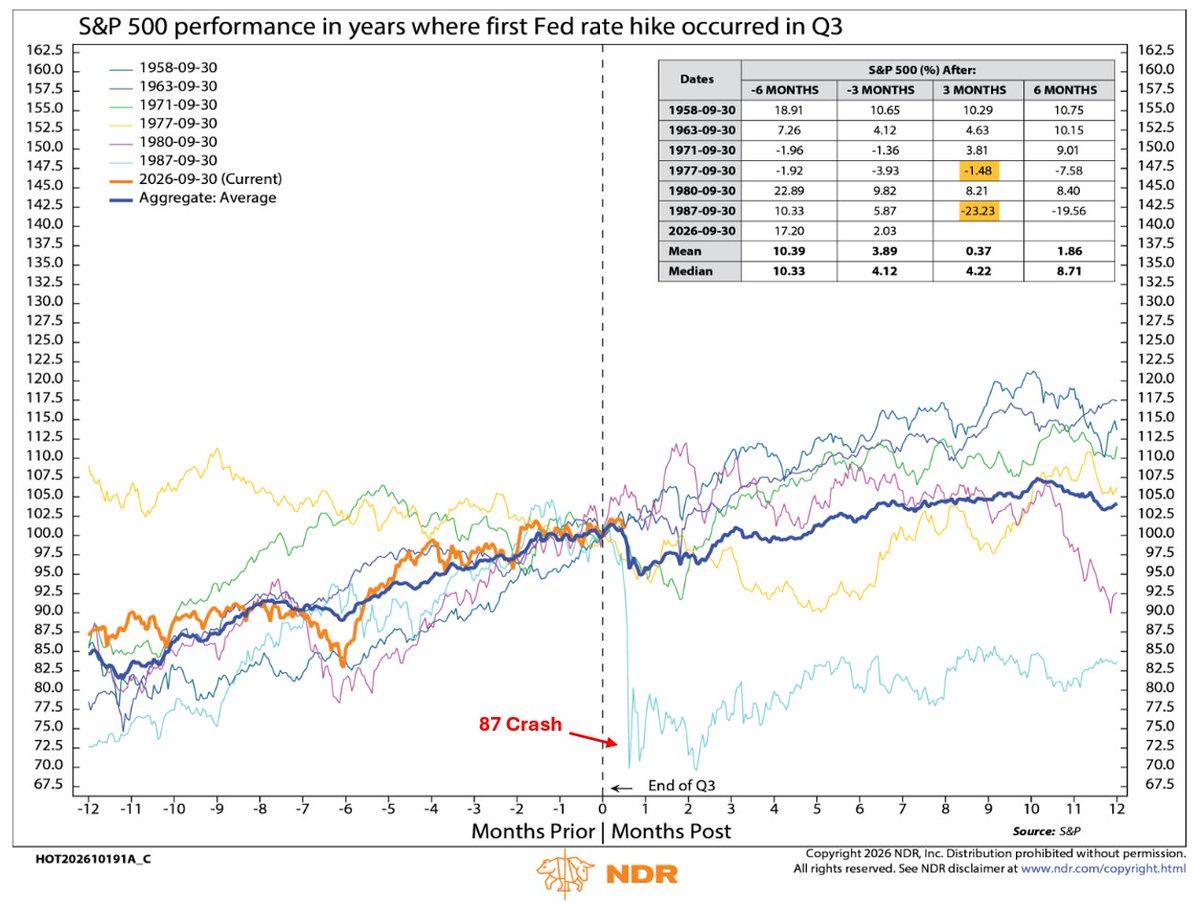
Interestingly, the 87 Crash is one of the historical analogs worth keeping in mind following a Fed tightening. The comparison should not be interpreted as a prediction of another crash, but the monetary-policy parallel is real: the Fed raised the discount rate from 5.5% to 6.0% on September 4, 1987, while market interest rates were already rising sharply.
The seasonal winds are clearly at the market's back. The question is whether tightening financial conditions, weak participation and rising oil become strong enough headwinds to overpower them.
The 10-year Treasury yield spiked 125 basis points in just seven months. We looked at prior cases when the 10-year Treasury yield jumped more than 125 basis points in seven months and found 13 prior cases. Only seven of the 13 cases (54%) had positive returns three months later. https://t.co/JXzFFTmMtn
Wkend homework: #NVDA $NVDA #Nvidia ~ Was @ new highs, then moved ⏬ to a previous level of support around 212 - bounced off this area 3-4 times now. This time however, it's moved below the 50MA and resting on the 100MA. Bears could take it - Strong test here....
Wkend homework: #BN $BN #BrookfieldCorporation ~ hasn't done much during Carney's PM time; tried to move past 68 a few times and was rejected. Looking good to find strong support around 51-52 - consolidating for the past 4 weeks. Potential to move back up to 68 - 30% upside.
Wkend homework: #MSFT $MSFT #Microsoft ~ Nearing all-time highs @550 - an area of #doubletop formation last year. Rejected and sent all the way to the 340's. Big test coming up to see if it can consolidate around the area first, or move beyond it...Three times the charm....
#SundayRunning Got to #run the #TCSHalfMarathon#WaterfrontTorontoHalf this morning! The last mile kicked my butt; happy to pull through under 2 hours (+ few mins to the strava time). Most importantly, I fell in love with running again; enjoyed training. https://t.co/u5Mn0PQMS9
@UltraRunner26 Yes, agree with you too on all fronts. Too much of Micron in there for me, but also makes sense because of it's low PE. I think it could also go down a ton though so it's a big risk for the ETF as you mentioned.
@UltraRunner26 I keep going back to it and it holds a lot of names I want to hold - premise is to hold undervalued stocks. And the performance looks steady to me. I'll be doing some more research on it as I keep coming back to it...https://t.co/tB4CFkJzUg