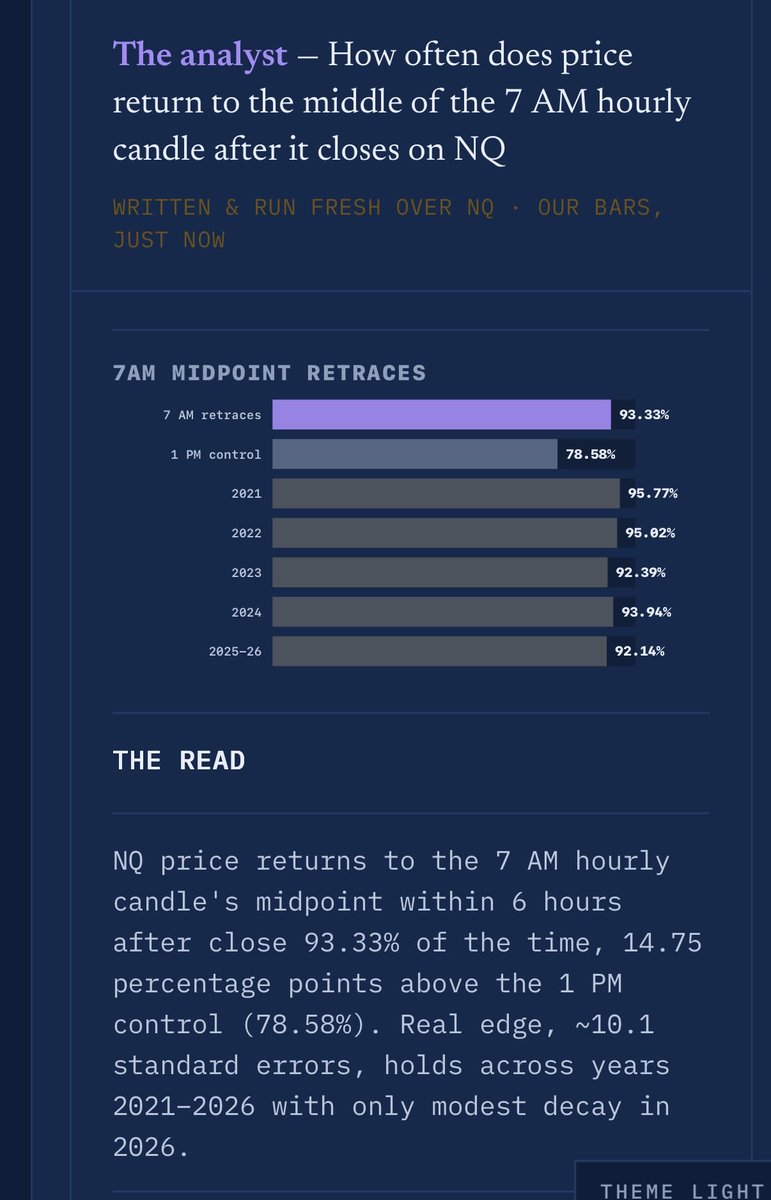
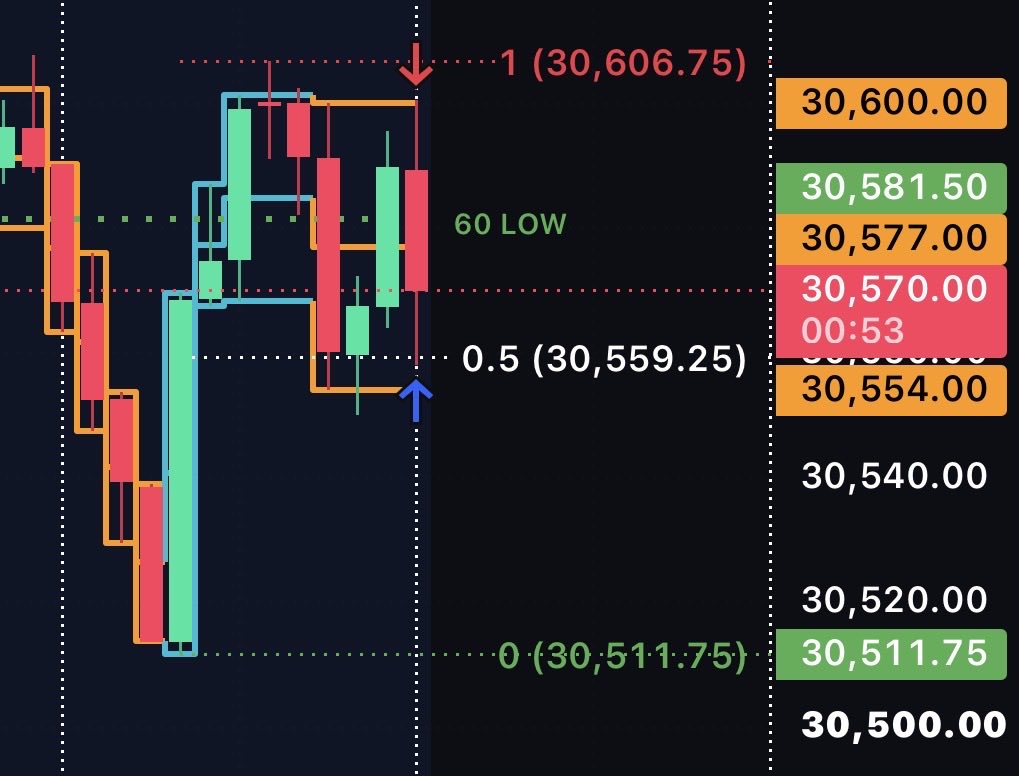
5m bearish range, entered at 600 at the top. Exited 559 at 7am mid which had a 93% chance of being hit each day.
Use code https://t.co/ODNTsHGnfj for 20% and click get access to take trades like this with me and many others that are succeeding every day
@Mc5calpTrades Hey @Mc5calpTrades in the trade writeup u reference a video. Is that in the education section of range prob? If so gonna sign up using your code tonight! Thanks for the insightful posts!
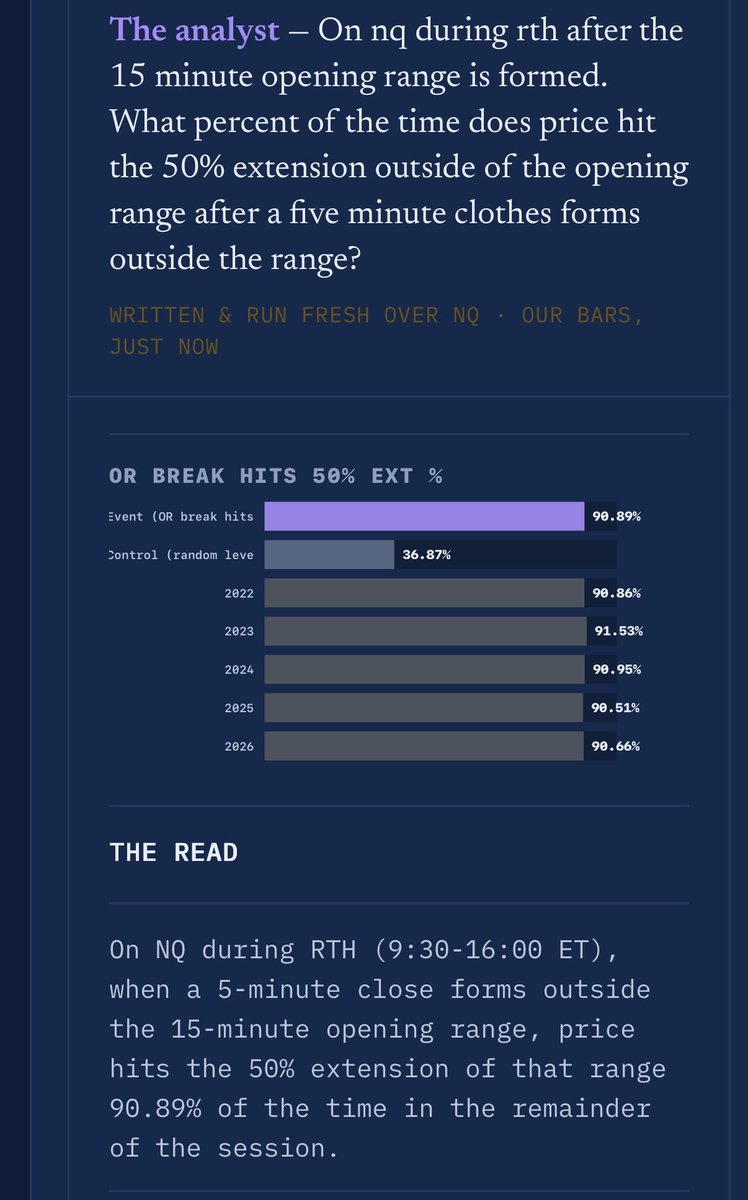
When we get a 5m close outside of 15m orb we have 91% chance to reach 50% extension of orb. Smacked the exit of orb with force for 65 pts 50%, and then the candle close gave me second entry for 35 pts. 4 for 4 175 pts today! LFG!
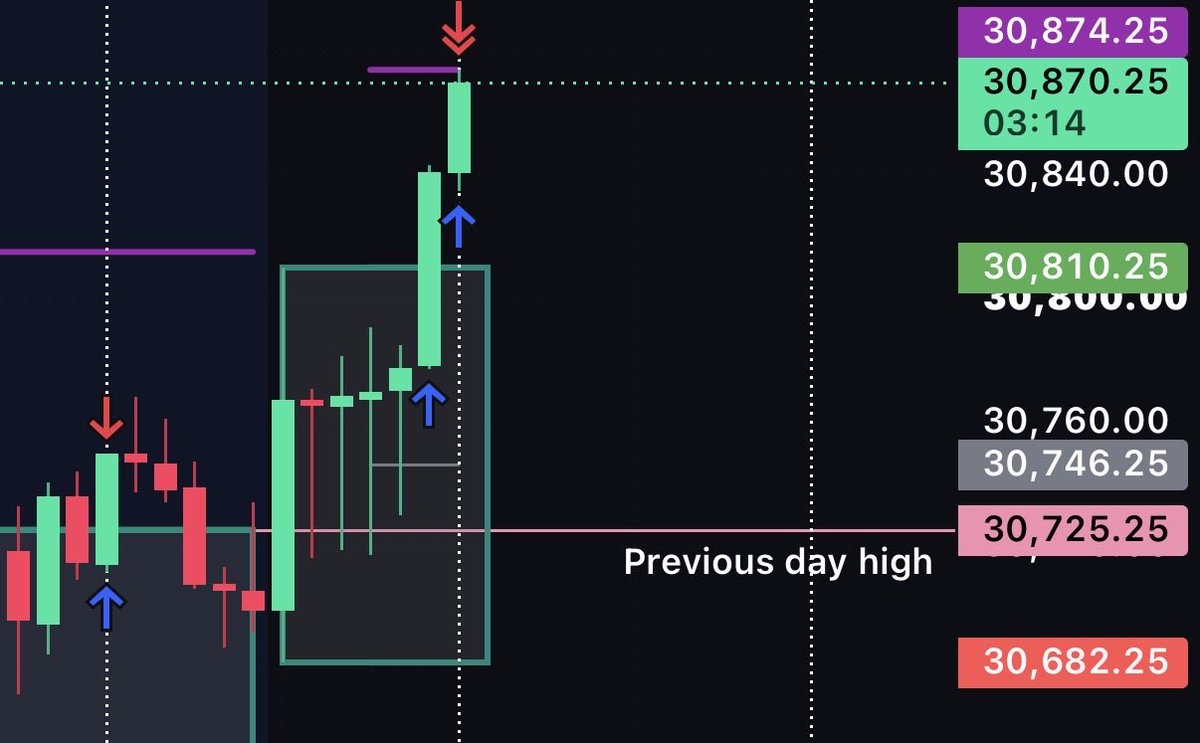
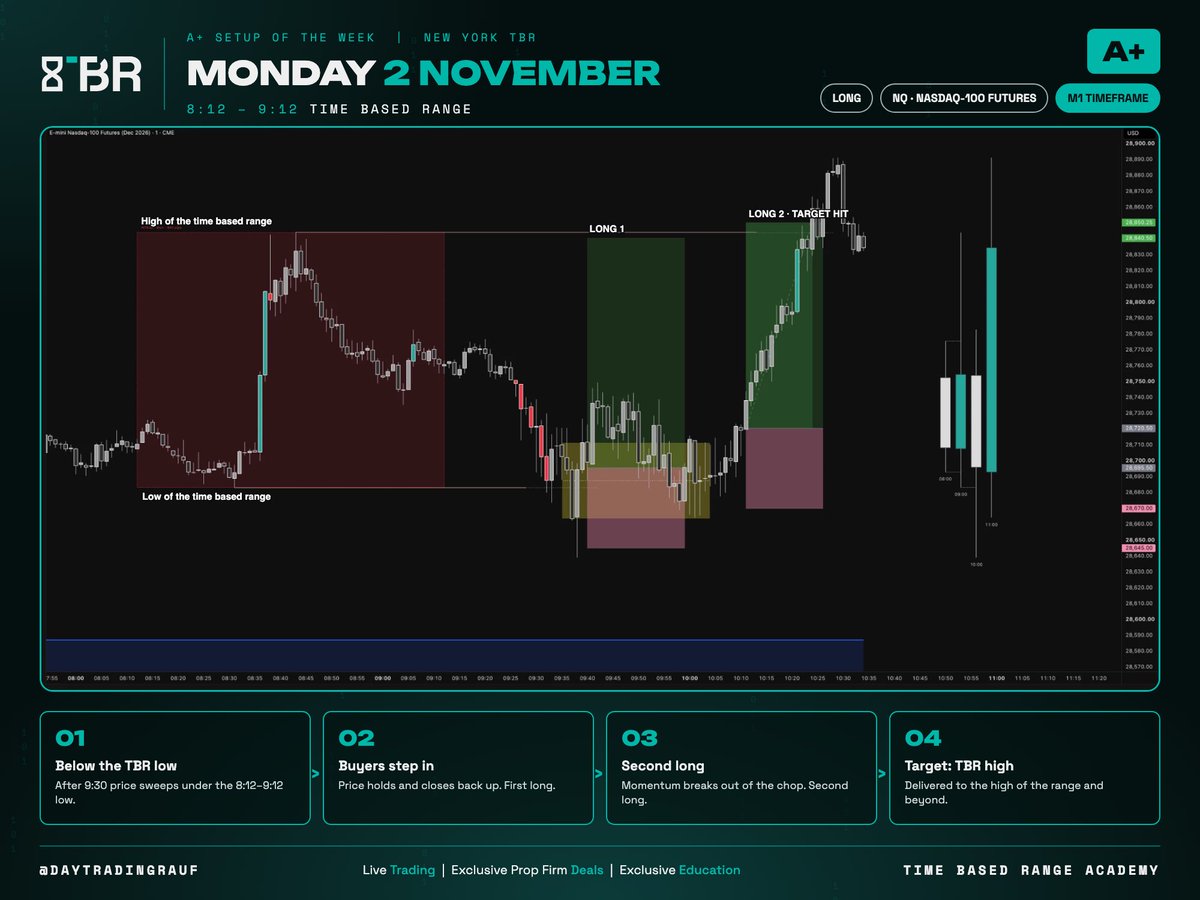
The only things I needed to long NQ on Monday:
(A+ SETUP OF THE WEEK)
☑️ Price swept below the 8:12–9:12 low after 9:30
☑️ Buyers stepped in, first long
☑️ Broke out of the chop, second long
☑️ Delivered to the high of the range and beyond
Same box. Same rules. Every single week.
Bookmark this for next market open.
How I use the RTH gap fill with my time based ranges.
Same day. Two charts.
On the ETH chart you see the overnight and your 8:12 – 9:12 range. The gap is hidden because price trades straight through.
Switch to RTH and the overnight disappears. Now the gap between yesterday's 4pm close and the 9:30 open is obvious.
Gap down:
> wait for the 8:12 – 9:12 low to be taken
> sellers exhausted? wait for buyers to step in
> get on their side
> target: the gap fill
Gap up:
> wait for the 8:12 – 9:12 high to be taken
> buyers exhausted? wait for sellers to step in
> get on their side
> target: the gap fill
Mark the range on ETH. Read the gap on RTH.
Save this one.
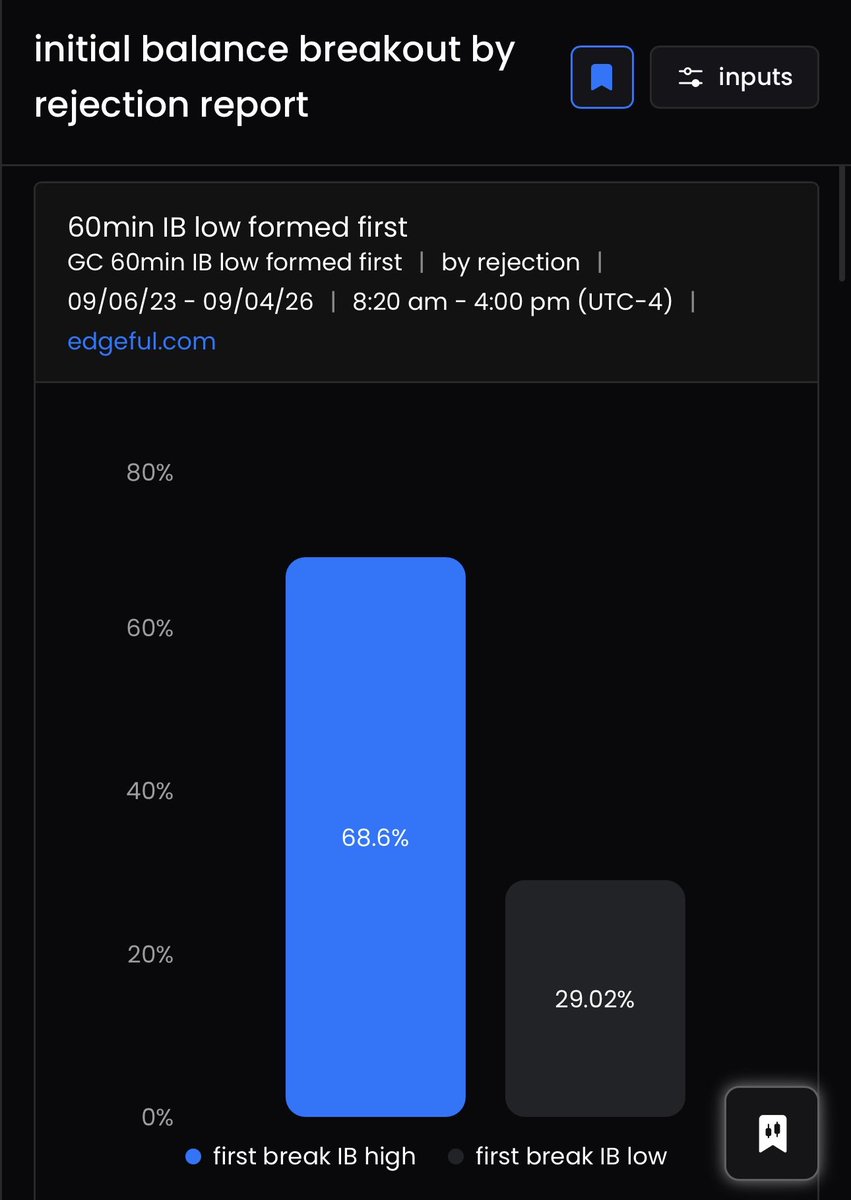
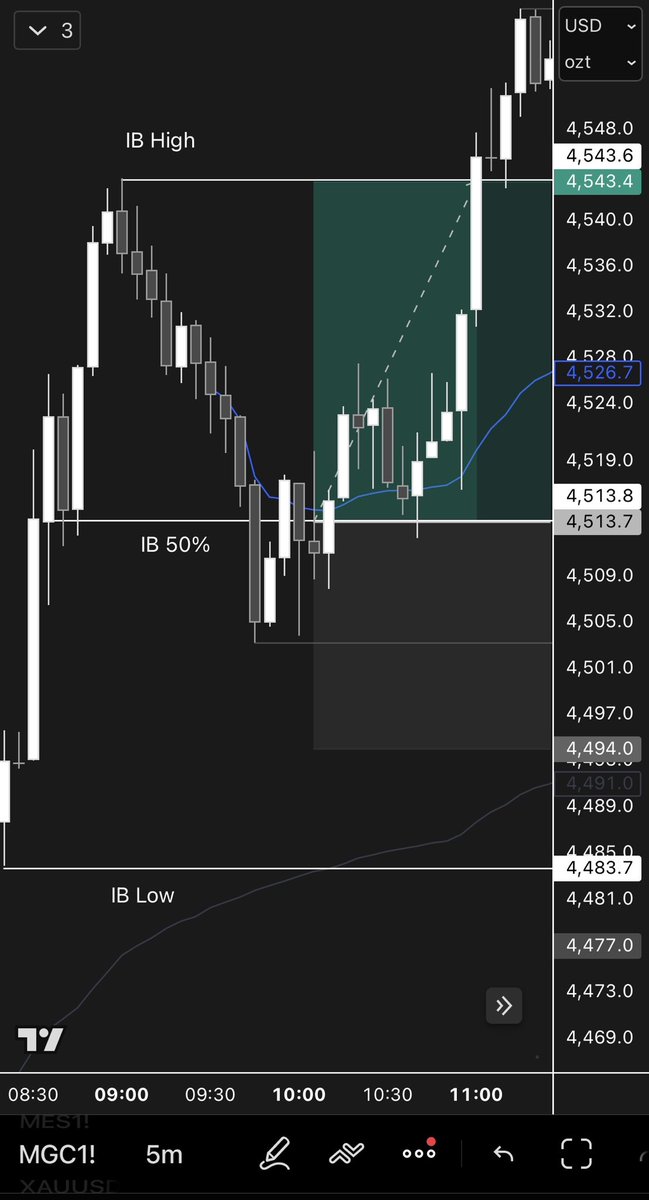
One of the simplest $GC setups I’ve been testing again recently…
The 8:20–9:20am ET Initial Balance:
When the IB low forms first, there’s a 68.6% chance the high breaks first.
Here’s what I look for:
- IB low forms first
- Price holding in the upper 50% of the range
- Price respecting a moving average on pullbacks
- Target the opposing side of the IB
Gold can respect moving averages exceptionally well, especially it’s a trendy day
So combining that with IB data is chefs kiss
Data: @edgeful
I see so many people spend years bouncing between Stage 1 and Stage 2 without making real progress.
Stage 1 is total randomness, and Stage 2 is that frustrating break-even chop where you have a strategy but no consistency. The shift to Stage 3 only happens when you stop gambling and start treating your execution like an actual business.
That mental shift changes everything about how you operate.
I had to stop looking at chatrooms and copy-pasting other people's trades to finally reach consistent profitability.
Real growth came when I took complete ownership of my trade identification and logged every single entry myself. If you are relying on someone else to call out your setups, you will never build a real edge in this market.
You have to own your entire process from start to finish.
I use progressive exposure to scale my position sizing safely based on what the market is giving me.
I do not just throw huge size at a setup because I feel confident. I earn the right to size up by taking feedback from my open positions and stepping up my percentage tiers only when my trades are paying me.
Let the market tell you when it is time to size up.
I ruined my own progress early on by constantly switching systems and forcing my size.
Every time I hit a small drawdown, I would abandon my strategy for a new one before giving it enough time to work. You need to stick to one setup long enough to validate your sample size and prove you actually have a edge.
Stop system hopping every time you take a loss.
I use the full life cycle of Roku to show traders how to ride a Stage 2 winner and avoid a Stage 4 trap.
The massive gains come from buying the proper Stage 2 breakout and holding as the trend stays intact. But once that structural shift happens and it rolls over into Stage 4, staying in will destroy your capital.
You have to recognize when a stock moves from a true leader to a dangerous trap.
I systematically map my entry rules directly to the visual edge I spot on the chart.
Whether I am targeting high volume or strong relative strength, I need to see those exact characteristics before I execute. I translate that visible edge into precise entry tactics so I am never guessing when a setup triggers. It creates a rigid bridge between what my eye sees and how I place the trade.
That visual edge is the only trigger I use to take action.
I refuse to place a stop loss at an arbitrary percentage just because it feels safe.
My stop has to sit right beneath a clean structural pivot or key support level. If the price hits that point, it means my entire thesis for the trade is invalid, not just that the stock fluctuated. That clear logical boundary keeps me in valid moves while strictly capping my downside.
Respecting market structure is the only way I manage my downside.
I review my trades in strict 30-trade blocks to run a proper post-analysis audit.
Looking at my results in a fixed sample size helps me identify systemic discipline breakdowns and gaps in my stop execution. It takes the noise out of a single bad day and highlights the exact patterns where I am deviating from my rules.
The numbers give me a clear roadmap for what I need to fix next.
I refuse to let traders sit there and blame dark pools or market makers when a setup fails.
Institutional track records prove every single day that systematic discipline works, regardless of what is happening behind the scenes. The moment I stopped looking for external scapegoats, I forced myself to take full accountability for my own execution.
My edge is built entirely on my own discipline.
I used the high volume close on CELH alongside whole number support to capture a 119% move.
When a stock prints a massive volume bar, that high volume close becomes my primary line in the sand for managing risk. Combining that level with major psychological whole numbers gives me complete clarity on where institutional buyers are holding the line. It eliminates the guesswork so I can sit tight in a monster trend.
Big volume bars show you the exact price levels institutional money is willing to defend.
I don't fire my full position size all at once when I am scaling into a trade.
When managing larger capital, dumping your whole order at one price creates unnecessary slippage and risk. I build my size across areas of tightness in tranches, which allows me to average in with complete control over my execution.
Tranche buying is how I manage size without destroying my cost basis.
I look for the Undercut & Rally tactic right at the lower boundary of a range.
This setup triggers when price breaks below known support to clear out stops, then quickly reclaims that level. I enter as soon as the stock re-enters the range, letting the shakeout provide momentum as shorts are forced to cover.
It allows me to place a precise stop just under the recent undercut low.
I only buy pullbacks when I see moving averages and key structural support line up at the exact same spot.
Single technical levels fail all the time, so I look for confluence before putting my capital at risk. When a key moving average sits right on top of prior horizontal support, my risk becomes clearly defined.
That intersection is where I get my best risk-to-reward entries.