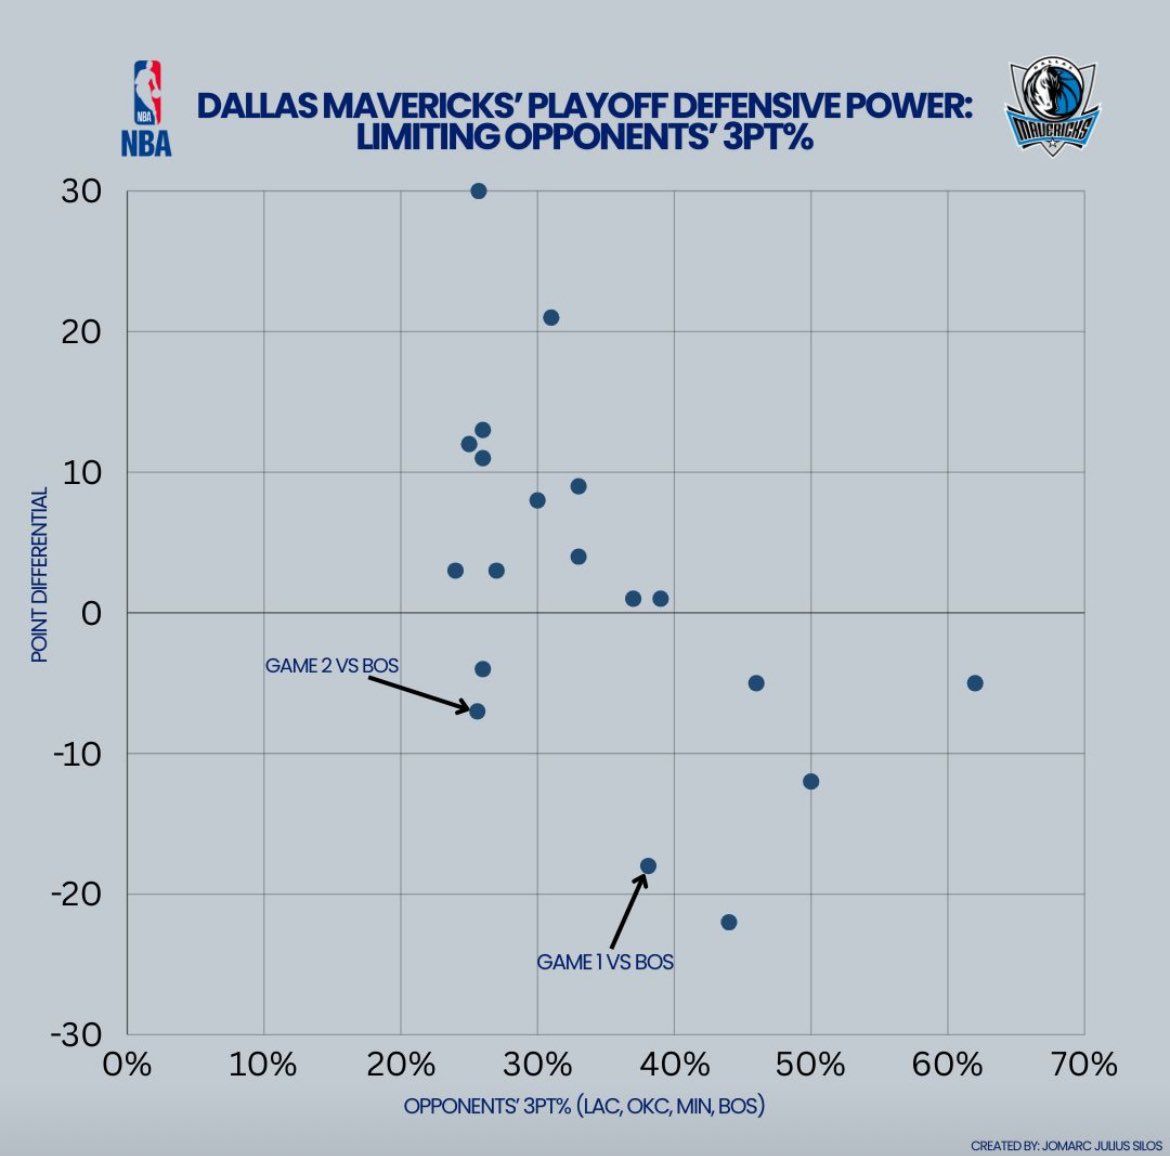
An interesting point is that the Celtics have won both games while shooting below 40% from the arc. Despite their struggles, they are still scoring effectively and efficiently in the paint.
Shoutout to @CrumpledJumper for the inspiration behind this graphic!
I created a scatter plot showing the relationship between the Dallas Mavericks' opponents' 3PT% and the point differential from each game. As you can see, there's a clear trend: Dallas has performed better when they hold their opponents to below 40% from beyond the arc.
2. Since this model currently considers data from the entire season and playoffs, I would like to utilize data purely from the playoffs.
3. Consider more team data, such as assists, turnover rate, and rebounding.
Who do you got in the NBA Finals?
With the NBA Finals approaching, I thought it would be fun to create an Excel project that predicts the winner over 1,000 simulated matchups. For this project, I scraped NBA player and team data (2023-2024) from Basketball Reference.
In the future, I plan to implement a few changes to this model:
1. Eliminate any players that were traded mid-season. (For example, Grant Williams is included in the model below, even though he was traded to the Hornets.)
The @GLeagueWarriors & @Rakuten welcomed our students to connect with the talented women of the #SeaDubs front office to learn about marketing, partnerships, community/public relations, and ticket sales.
THANK YOU Santa Cruz Warriors & Rakuten for this unforgettable experience!
Calling all 11th/12th graders and 1st/2nd year college students 📢
Passionate about basketball and technology? We are accepting applications for this winter’s Core Program.
Click the LINK IN BIO.
Program begins JANUARY 29th.
Deadline to apply is 1/23/24!
Here are some words about the Core Program from TEAM Alumni, Kyle Abliar!
Passionate about basketball and technology? We are accepting applications for our Core Program.
To learn more and apply, click the LINK IN BIO.
Program begins 01/29/24
Deadline to apply is 1/23/24
I used Python (pandas, seaborn, matplotlib, and numpy) to create a shot chart function that can be used to help prepare their teams! In the example below, it shows shots of LeBron James vs. the LA Clippers. The yellow Xs represent makes, while the blue Os represent misses!
I am excited to share a new basketball live stat tracking tool that I have developed using MyVideoAnalyser. This Highlight Window allows you to select a team and see their players listed in the top right window, track live stats for both teams, and generate a four factor report!
Why do I have to put what kinda of designer I am?
Why put myself in a box?
You don’t have to say what type of athlete you are on here
Not very American 😂😂😂
@elonmusk@Twitter