8) Additional Important Concepts
• Buy/Sell Program
https://t.co/gkO98Zp3jA
• Market Structure (3 Step Process) https://t.co/7pcZGLdYz1
• EQ/Middle of FVGs and how to use them
https://t.co/0dZy7poTar
• Optimal Set Ups https://t.co/3GAlcESfT5
• High Probability Reversals https://t.co/YvPvN4v5NO
• Opposite Poles Sorted Posts (SR flips behind FVG)
https://t.co/CDejHbeQXx
• Opposite Poles Zone
https://t.co/SPQYKfe797
• SFP Swing Failure Pattern
https://t.co/DTh2KGcr0f
• Other currency pairs as additional confluence
https://t.co/ou0S0Dz1uQ
• Clean Target adds confluence
https://t.co/4TFoJlv88R
• Gaps
https://t.co/EfNZYeXUxR
• News Confirmation
https://t.co/qNnz17aHHU
• Parallel Channels/Fractal 3 Drives Pattern
https://t.co/mIp1Sr3A3T
• MT Spot Trading Strategy
https://t.co/zacQWmcrvU
• Alt-season Signals
https://t.co/Pywf8l3oh6
• Patterns + Trendlines + Moving Averages
https://t.co/v0Q8OBP5kK
9) Sorted Moneytaur Decoding Posts
https://t.co/F5tJuzAwS9
10) Best Moneytaur Post Compilation
• MT Spoon feeding Posts (Top 5) https://t.co/l2jXwcM4KV
11) Q&A https://t.co/qj16T6Nvsa
12) Older Summaries
• Oldest Guide
https://t.co/LnMdpMLAuW
• Most recent one
https://t.co/UTGaUyT9Si
13) Terminology
https://t.co/JdmRQoB17r
I’m truly grateful for every follow, repost, like, and bookmark.
The time and energy I’ve poured into this means a lot to me, and your support makes it all worth it.
Thank you! If this helped you, a quick bookmark + repost helps more people find it.
Got questions? Drop them below — happy to expand or clarify anything.
⚠️ Liquidity Cheatsheet ⚠️
The Algos that run the markets are programmed
"To go after liquidity levels, to respect fibs, to close imbalances, (...)" -@Moneytaur_
I will explain how to find those liquidity levels:
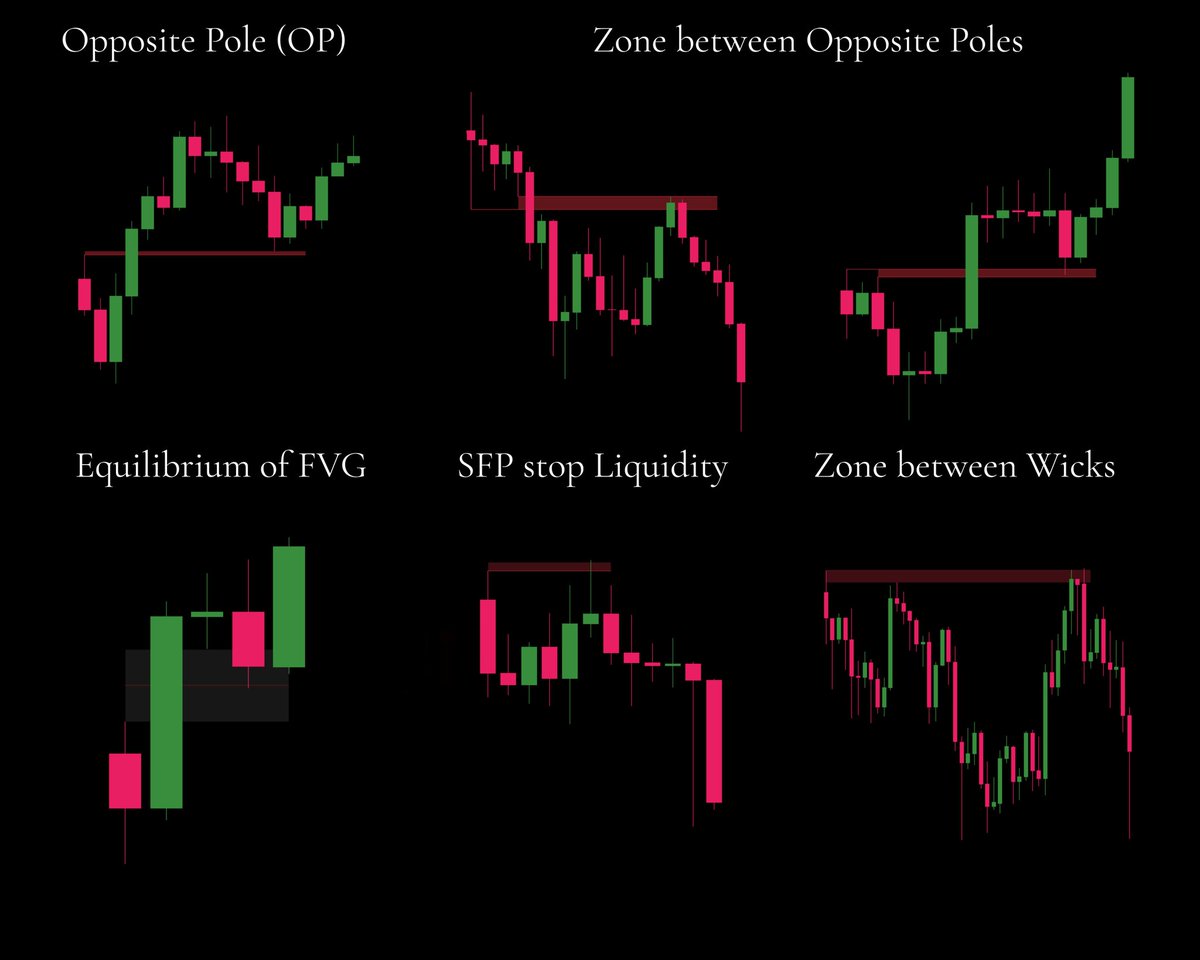
🔹Image 1: Liquidity Blocks
Order Block (OB) = Candle + Larger Candle (opposite color)
Breaker Block (BB) = Order Block fully hidden behind a FVG (see Image 2 for FVG explanation).
The more hidden it is (behind more FVGs), the more powerful it becomes. And the higher the timeframe, the more powerful it is.
Partial BB: If the Order Block was wicked into, narrow it down to the unwicked portion. It’s only valid if the equilibrium (EQ=0,5 fib) of the OB wasn’t taken.
Undivided FVGs are weaker, but they can still be used.
Melted Breaker Blocks (BBs) are the weakest.
A Breaker is stronger when price moves quickly through it. For example, a 1D Breaker Block (BB) with a 12H wick inside isn’t fully untouched as it would appear on the 1D timeframe.
But if the Breaker Block is ignored even on lower time frames through FVGs, it becomes much stronger because its liquidity remains fully intact.
That’s also why refinement works, it reveals the untouched areas on lower timeframes.
For better entries, you want to see a Break of Structure and a retracement into those liquidity levels.
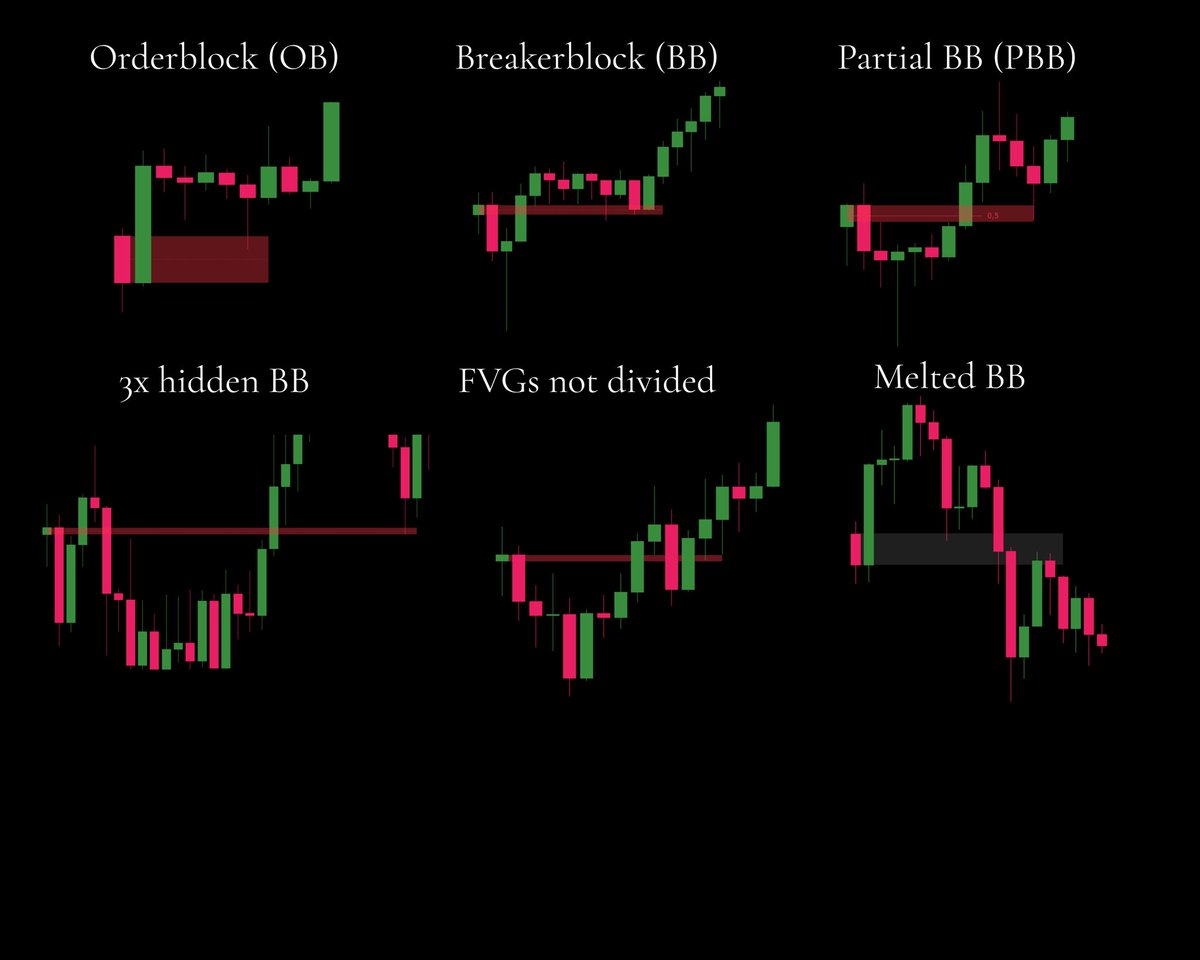
🔹Image 2: Wicks
FVG = Grey Zone
3-candle pattern: One large candle between two candles with wicks. The zone between those wicks is the Fair Value Gap.
The EQ of an FVG can act as an important confluence since algorithms often use it.
Opposite Poles are wicks located behind an FVG. You can use a single pole and the zone above/below it, or the area between two poles.
Wicks (Swing High/Low):
The majority of stops are usually located above swing highs or below swing lows. These stops provide liquidity before market makers reverse price. (SFP=Swing Failure Pattern)
The zone between wicks marks an area where price action could execute an SFP on the nearby swing high or low.
An SFP of the major swing high is possible, though price might front-run the most obvious wick.
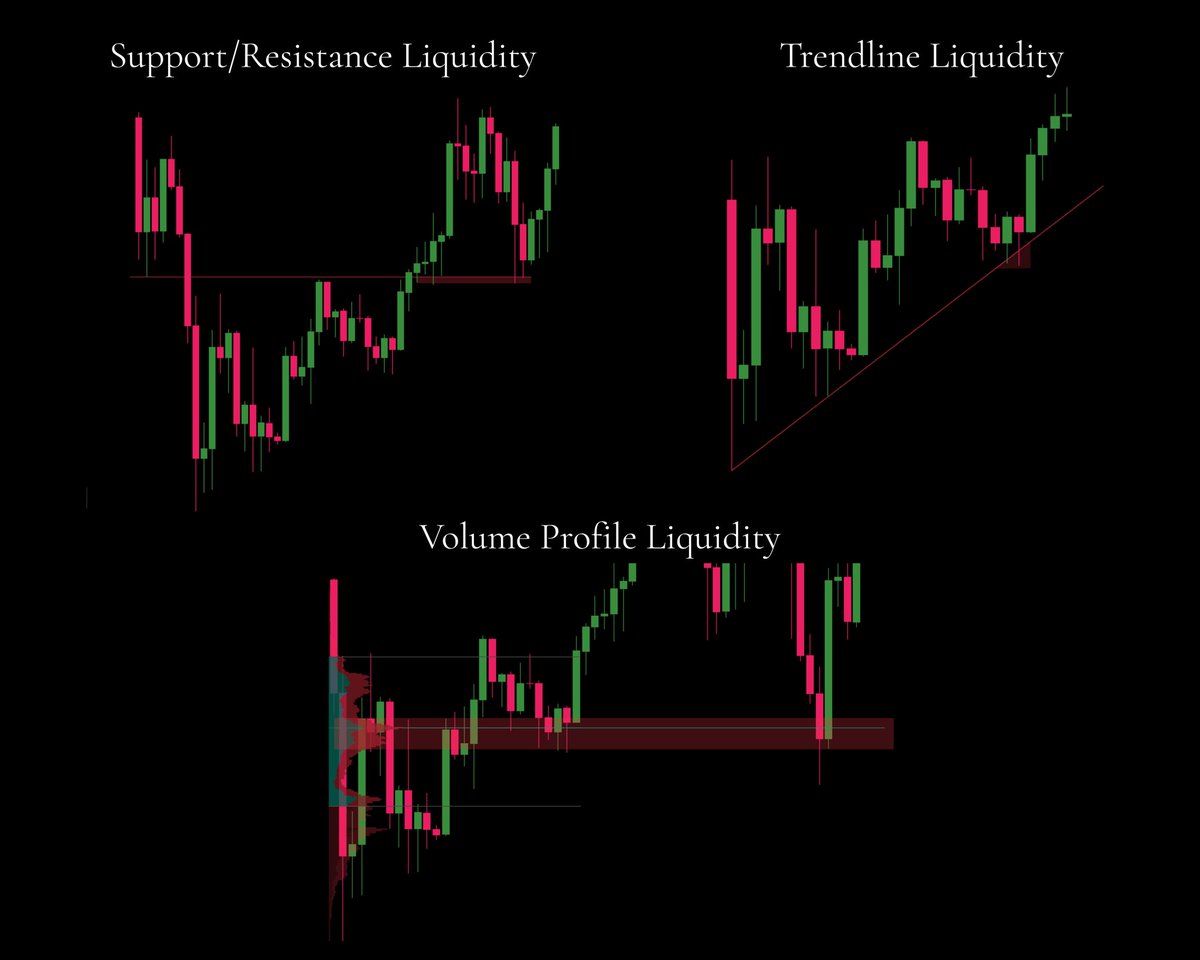
🔹Image 3: S&R, TL, VP
Support and Resistance offer liquidity because retail traders commonly use these levels.
Market makers identify liquidity or stop clusters below support and above resistance, similar to how they view trendlines.
The Volume Profile shows where most positions were opened. These areas often contain breakeven stops or intentions to exit at breakeven, making them zones that provide counterparty Liquidity for MMs.
Value Area Highs (VAH) and Value Area Lows (VAL) are also important levels.
If price fails to trade outside these levels, aka as a failed auction, it often returns back into the value area.
"Once you see it, you can’t unsee it." -MT
🧵EDUCATIONAL POSTS
I’ve put together a focused collection of all of my educational content on technical analysis, everything I use from order blocks and refining entries to order flow and execution.
Whether you’re starting from zero or sharpening an existing approach, a few focused months here can compound into years of better decisions.
📌 Bookmark this post — it’s designed as your ongoing reference.
More breakdowns like this on @OverlordEins — a repost helps more people see it.
Table of Contents:
1. Order blocks/Breaker blocks
2. Refining across timeframes
3. Fibonacci Guides
4. Wyckoff/Ranges/Market Structure
5. Trade Execution
6. Order flow + Why the concepts work
7. Strategy Summary/Cheat sheet for revision
8. Additional Concepts(MS, Confluence, FVGs etc)
9. Sorted @Moneytaur_ Decoding Posts
10. Best Moneytaur Post Compilation
11. Q&A
12. Older Summaries
13. Terminology
1) Order blocks(OB)/Breaker blocks(BB)
• Beginner guide
https://t.co/4Hziwp8vvU
• OB/BB Video Explanation (+FVGs)
https://t.co/RjkbCFfexD
• Order block Strength Criteria https://t.co/5ULpfh9fcD
• Order block Search Shortcut using only one TF
https://t.co/WyxvT9wC5l
• Order block Sorted Posts https://t.co/daYHtv5dUw
• OB strength wick to body ratio
https://t.co/aRz2p1Q1hJ
=>Reason: Why we refine entries
https://t.co/EgdQKe9xH9
2) Refining: Narrow down the entry to maximize RR
• Beginner Guide
https://t.co/v6MT4p8Pcx
• Refining Guide Part 2
https://t.co/agHUA6NtFO
• Advanced FVG Timeframe refining
https://t.co/dVu7lCf560
• Refining Breakers into OB within the FVG
https://t.co/ZE0em1UVco
• New Partial Breaker variation
https://t.co/3vB65W6ViN
• Advanced Refining explanation
https://t.co/9VE33PYcWn
• Refining using Gaps
https://t.co/WGWSd0W5gF
• Refining Wicks
https://t.co/LiAGdNz0Rm
• Laddering of TFs
https://t.co/7IrMzcB2kz
• Refining CME Gaps
https://t.co/bukJXlzEsN
3) Fibonacci Guides
• Fibonacci Guide Part 1
https://t.co/fehW4QtA8w
• Fibonacci Guide Part 2
https://t.co/xYsswppkzJ
4) Wyckoff/Ranges/Market Structure
• Simplified Wyckoff/Ranges
https://t.co/i1cW15ia4G
• Wyckoff + Market Structure Concepts
https://t.co/otvRo3NJ9b
5) Trade Execution
• Entry Checklist
https://t.co/uNBji4xkb2
• Entry using Candle Closes/VSA Intro
https://t.co/Nnk3mCMJ32
• Signs to look for before entering
https://t.co/IBvvZ8I6rL
• Trendline method for entries
https://t.co/deBPZiNTsL
• Sorted Execution Posts
https://t.co/gVyiZBFdSl
• Candle Range Theory
https://t.co/g9vrrIVIP6
• Stop Placement
https://t.co/SjlLp3amk1
• Take Profit Rules
https://t.co/0mLOSrKHJ0
6) Order flow + Why the concepts work
• Full Order flow Guide
https://t.co/8DtfKBpzmI
• What is Liquidity and why does price even move
https://t.co/6NmyIV1VAB
• Order flow Trade Example
https://t.co/aSBNXaEHwu
• MT Volume Spread Analysis (VSA) explanation
https://t.co/zMvh4K47Eu
• How to use Volume Profile https://t.co/2CxZhgeKT9
• Order flow notes on a video
https://t.co/mwVgnFK7dm
The Mechanics behind the Market
Why do Order blocks work?
• TPO explanation of candle patterns like OB/BBs
https://t.co/8rFhnBztnX
• Order blocks through the lens of a footprint chart.
https://t.co/QUOPZUT9pS
• OB explanation from an Order flow perspective https://t.co/eXMuWvPc51
• How MMs Engineer Liquidity
https://t.co/XFBixnmjHR
7) Strategy Summary/Cheat sheet for revision
• Strategy Summary https://t.co/AJGpJ90cWO
• Liquidity Cheat sheet https://t.co/6j7o64ZW5y
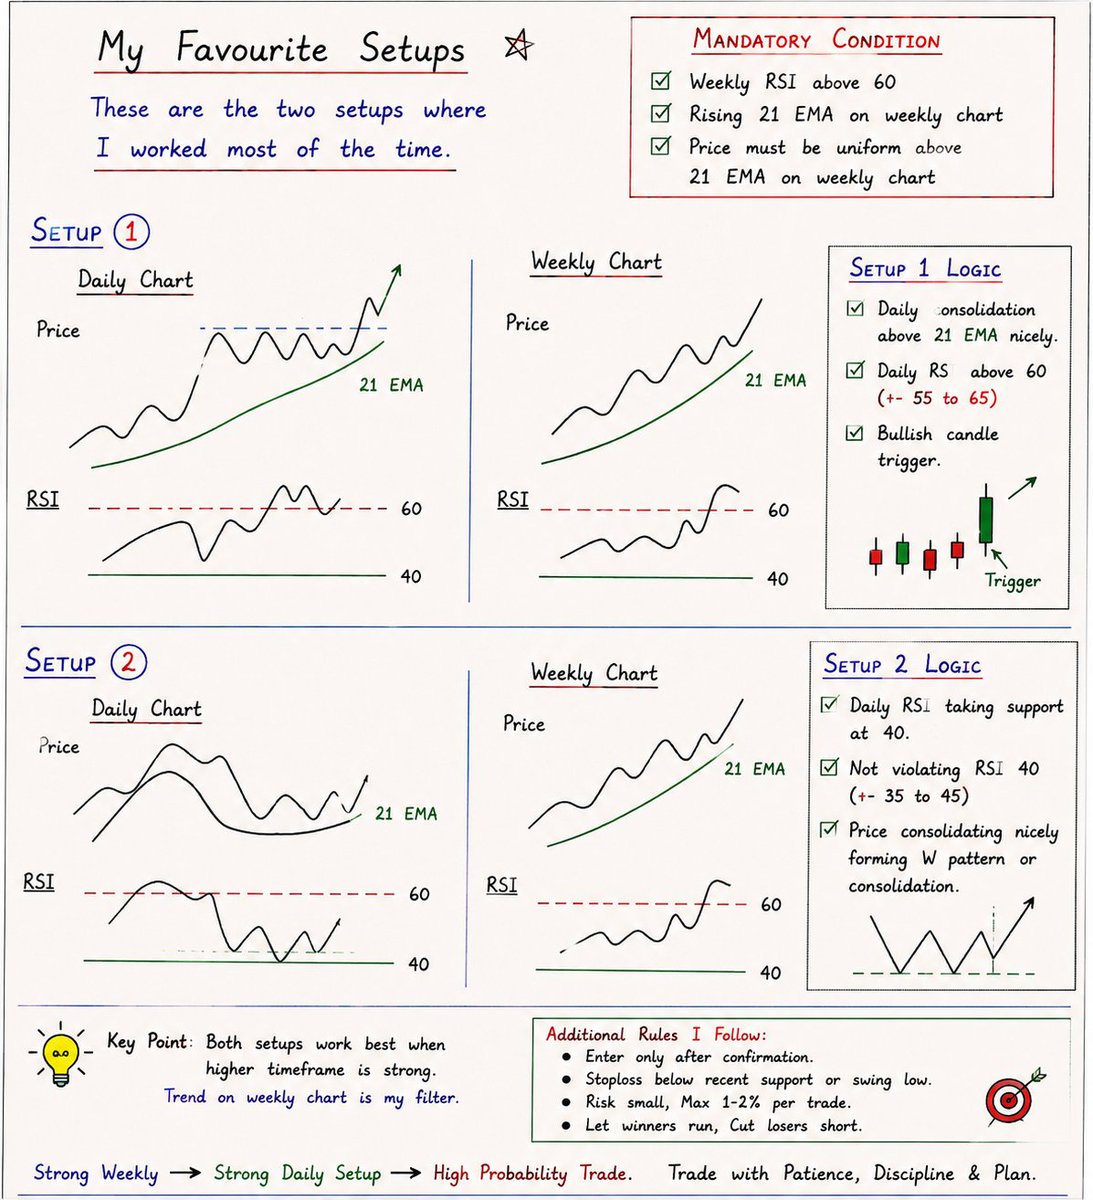
After 7 years in the market, I've simplified my trading into just TWO setups.
No fancy indicators.
No complicated systems.
Just:
✅ Strong weekly trend (my filter)
✅ High-probability daily setup (my trigger)
My non-negotiables:
• Weekly RSI > 60
• Rising 21 EMA on the weekly chart
• Price above the 21 EMA on the weekly chart
Then I wait for either:
Setup 1: Tight daily consolidation above the 21 EMA with RSI around 60.
Setup 2: Daily RSI finding support near 40 while price forms a clean W pattern or consolidation.
That's it.
Simple processes create repeatable results.
🔖 Save this if you're trying to simplify your trading.
Follow @ChartMantra_ for practical swing trading, price action, and daily handwritten trading notes.
$BTC 📈
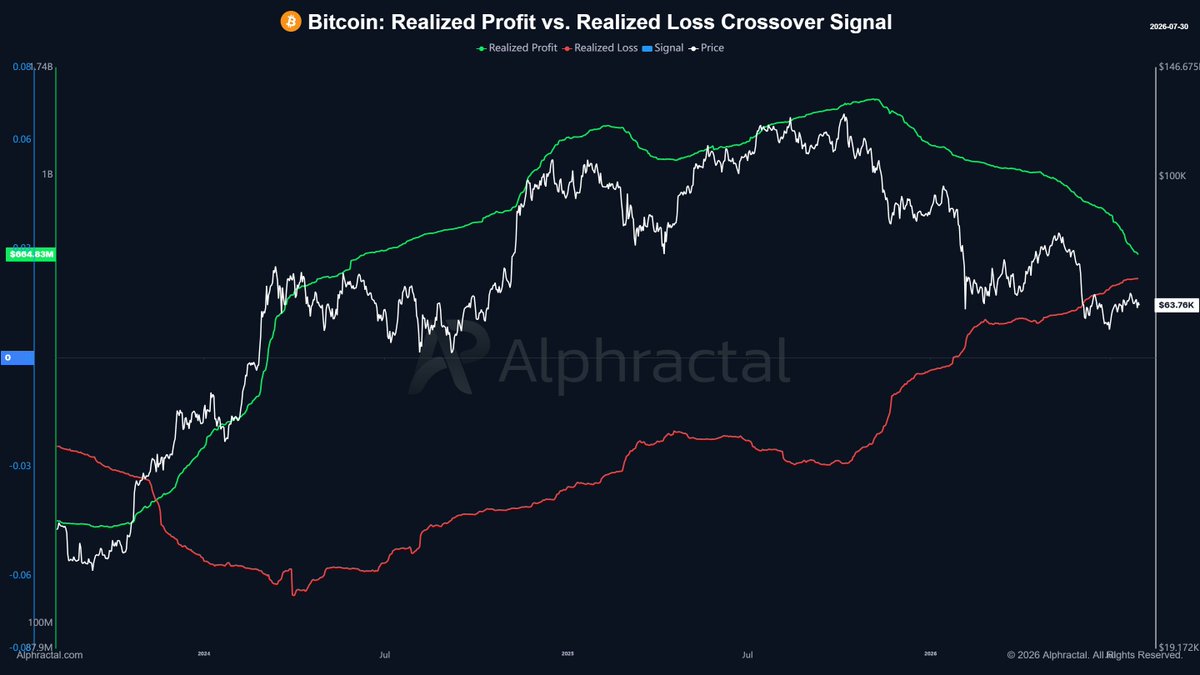
The number of aggressive longs that caught this low is crazy.
We saw an extreme build-up in Open Interest across venues right at the lows, driven mainly by aggressive new longs entering the market, without any spot support so far!
That makes the current low extremely weak, with plenty of stops and fresh liquidity resting underneath it. There is a very high chance those longs will not survive for long.
Ideally, we get a push into $63,400 (mVWAP): From there, I’ll watch the reaction and look for confirmation to short back toward the current low.
https://t.co/WLzAJBcAzO
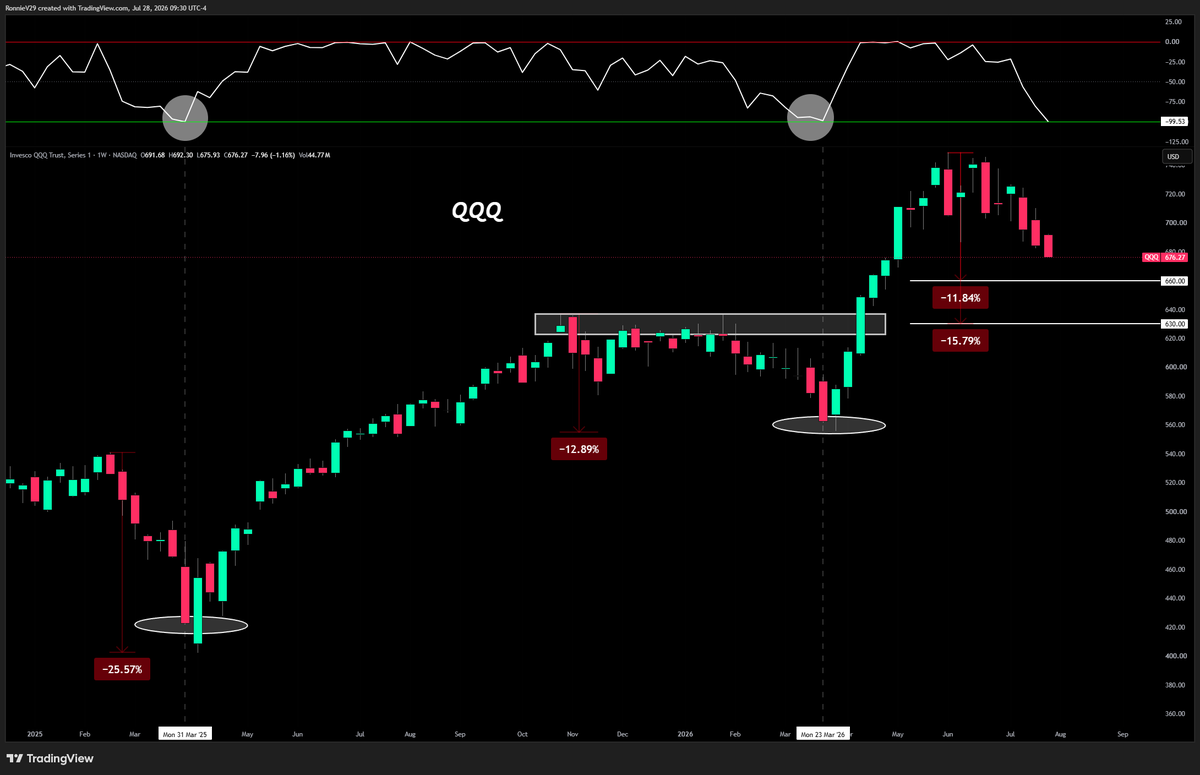
Flush then Bottom on $QQQ within 2 weeks.
Historically, when the W%R gets to the green barrier we bottom within two weeks on the weekly charts.
As long as this isn't the start of a bear market.
Level 1 Bottom: $660
Level 2 Bottom: $630
W%R doesn't close until end of week.
Warned you before:
2025 Tariffgeddon Correction.
2026 Iran Correction.
2026 $QQQ Correction.
And each time…
The Williams %R helped identify when panic was reaching an extreme.
It isn’t magic. It won’t call every top or bottom.
But over time, it’s become one of the most valuable tools I’ve found for separating fear from opportunity.
That’s exactly why I continue teaching it.
My job isn’t to predict every correction.
My job is to help you navigate them without letting emotion make the decisions.
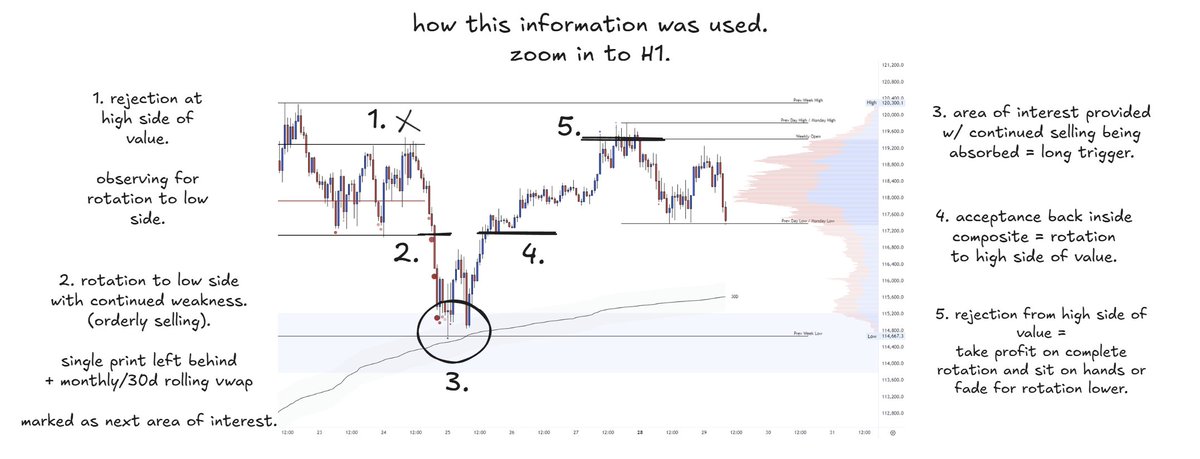
BTC
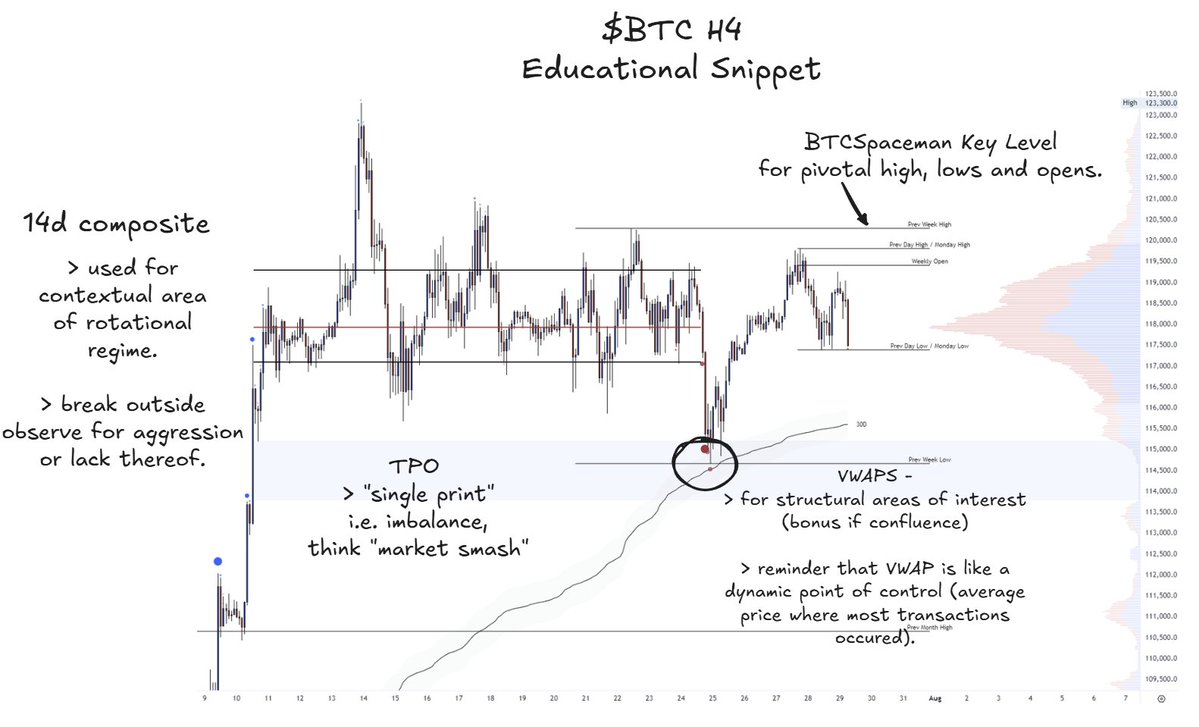
> Using context, TPO, VWAPs & key areas
(found this in the archives, check out the price axis, good times. still relevant)
more of these breakdowns (real-time examples)?
Want to Know If the Bottom Is In? Read this.
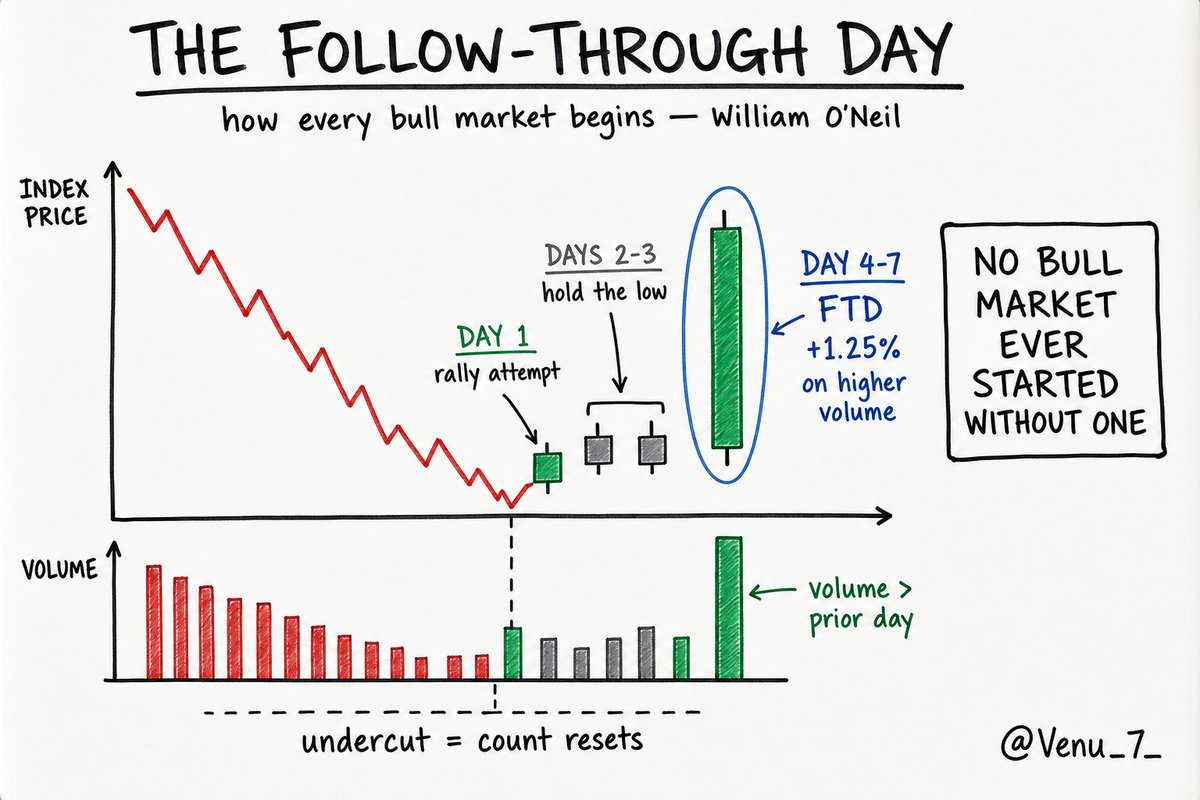
Since $QQQ just printed a gap-up candle, the next thing I'll be watching is the Follow-Through Day (FTD).
One of William O'Neil's most important rules for confirming a market bottom.
How it works:
- Market is in a correction. The first day an index closes higher = Day 1 of a rally attempt.
- Days 2-3 don't need to be up. The rally stays alive as long as Day 1's low holds.
- Then on Day 4-7, watch for one major index (S&P 500 or Nasdaq) to gain 1.25%+ on volume higher than the day before.
That's the follow-through day. Downtrend over. Confirmed uptrend.
The rules that matter:
- Not every FTD works - many fail
- But no bull market has EVER started without one.
- Undercut Day 1's low -> the count resets
- FTDs after Day 10 carry lower success rates
What to actually do on an FTD:
Don't go all in. Buy starter positions in leading stocks breaking out of sound bases. If the rally is real, they work - and you add. If it fails, you're barely exposed.
O'Neil's whole point: you don't predict bottoms. You confirm them.
Corrections are for building the watchlist. The FTD tells you when to use it.
@Bobby_1111888 Hi there, I'm new here and I've been enjoying reading through your posts. I love your positivity ! Can I just ask what the bottom indicator is on your chart. I've figured out the others, but the one at the bottom has me stumped? Many thanks
In my opinion, there's one more major leg up remaining for Bitcoin and the greater cryptocurrency market. There's one piece missing to this 17-year masterpiece, and it's the regulatory, government, and institutional adoption leg—the true crypto blow-off top.
Those of you who follow the four-year cycle know that the lifespan of assets in secular uptrends is between 16 and 20 years, with the final four years of the secular bull market often printing a left-translated peak. At 17 years of age, Bitcoin currently sits right in the sweet spot of that window. My thesis is that this is what's at play here, and I'm expecting a major left-translated peak for Bitcoin next year, alongside global liquidity expansion and a dovish/easing Federal Reserve. This catches the majority offside, in my opinion, and the technicals support the thesis.
As Bitcoin trades near its prior cycle all-time highs, Ethereum is trading closer to its 2017 highs. The smart money knows and sees that ETH has a lot of ground to cover and will start to position itself for that move. At current prices, a blow-off for BTC would yield roughly a 3-4x, while ETH could easily appreciate 10-15x from its most recent low of ~$1,505.
The smart money also knows that Ethereum’s fundamentals are looking stronger than ever as its price trades weaker than ever, with market sentiment at rock bottom. They're positioning themselves for the move that narrows that gap.
Additionally, Ethereum has yet to experience its Bitcoin DAT/Saylor moment either, but that's loading with Tom Lee’s BMNR product.
Wall Street will use Ethereum as its primary driver to recreate the Bitcoin 2017 moment that they all missed when its price rose from approximately 1k to 20k in less than 12 months. Same trade, ten years later, but this time for Wall Street using, yep, you guessed it, Ethereum.
This is why I've been so bullish on Ethereum.
The macro charts are preemptively showing that a big move is loading for ETH, and this is my thesis on what may end up causing it.
Bitcoin > Ethereum > Large cap crypto infrastructure > Established applications > Small cap protocols > Microcaps/memecoins
In my opinion, the outlined money flow diagram above is still valid because the money hasn’t really exited Bitcoin yet, for the most part, but that's about to change.
Thanks for reading this and for still being around, because I truly believe that if you’re still here, you’re going to do well.
Cheers! ⚒️
$BTC Market Profile 📈
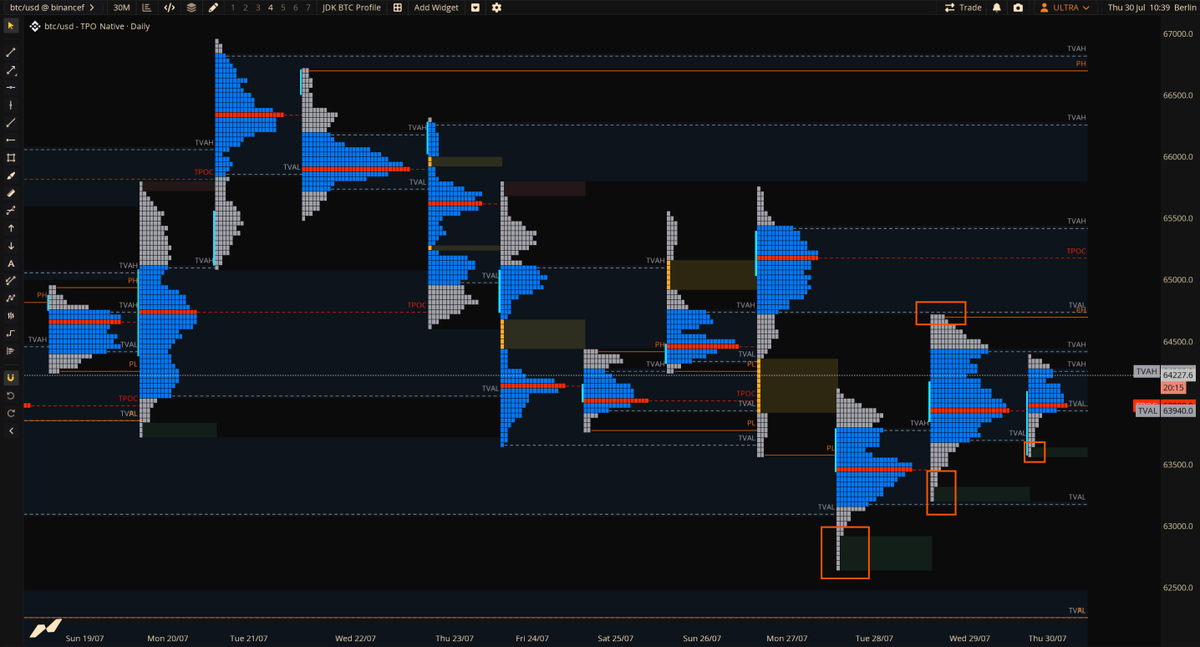
Before we get into it, here’s a quick explainer:
Each vertical profile represents one trading day, and every block shows a 30-minute period spent at that price. A new letter is added every 30 minutes, allowing us to see where BTC spent the most time trading throughout the session.
Wider areas represent acceptance and fair value, while thinner areas and tails indicate rejection or rapid movement through a price level. VAH and VAL mark the upper and lower boundaries of the day’s value area.
��� Current Read:
BTC is currently rotational within the previous day’s value: Price has rejected the prior day’s Value Area Low and is now testing the Value Area High near $64,500.
Yesterday also left a poor high, meaning the upside auction appears unfinished. If BTC gains acceptance above $64,500, a sweep of that poor high becomes increasingly likely.
What happens after that will be key:
If buyers show strength and begin building value above the previous day’s range, it would support a more meaningful bullish shift - rotation back to 65,500 USD seems likely next in this case.
However if price is quickly rejected and leaves a clear selling tail, it would suggest the upside auction has exhausted and increase the probability of continuation lower (my current base case)
The last two sessions have rejected lower prices while value has started forming slightly higher. That is constructive, but the heavy overlap between value areas still points to balance and rotation rather than a strong reversal and rejection of lower prices.
The key is not simply whether BTC trades above $64,500, but whether the market can gain acceptance and build value there - this will be key to monitor for today!
My remarks:
I see a good chance that BTC sweeps yesterday’s poor high today into ~65K. From there, the reaction matters more than the sweep itself. I would only consider a short if we see a clear rejection, a defined selling tail, and ideally trapped longs confirmed on the footprint. If price gains acceptance above the poor high and starts building value higher, there is no short setup. No confirmation, no trade!
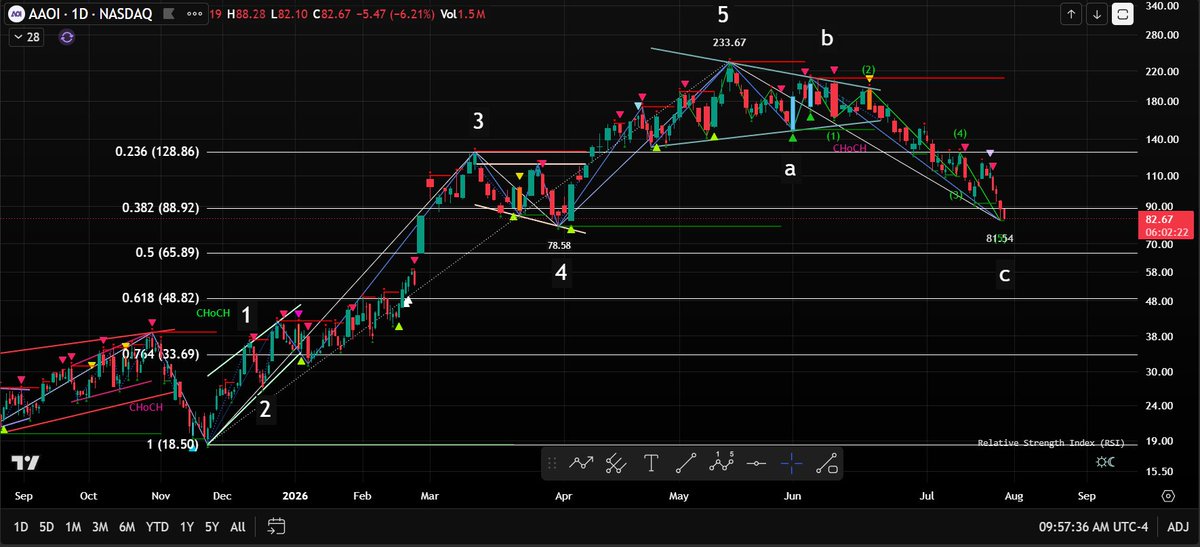
A critical decision point for $AAOI immediately above the prior $78.58 Wave 4 low. On a logarithmic Fibonacci scale, price has moved through the corrected 38.2% retracement at $88.69; log 61.8% level is $48.74. The decline from the $209.64 B wave high can already be counted as five waves, so a violent countertrend rally seems to me logical, but we cannot confirm the low is in while $AAOI continues making lower lows. A break of $78.58 would first expose the $71.40–$72.72 C-wave extension area, followed by $69.28–$65.75. The $48.74–$52 region becomes the deeper target if those $AAOI supports fail.
I suspect we get a large rally followed by another major decline, meaning this is likely a WXY not a terminal C of the entire correction. Our first extension target would be $71.40–$72.72, then $69.28: linear 76.4% retracement $65.75: logarithmic 50% retracement. Here is the full ladder down:
$81.02
$78.58
$72.72–$71.41
$69.28
$65.75
$52.00–$48.74
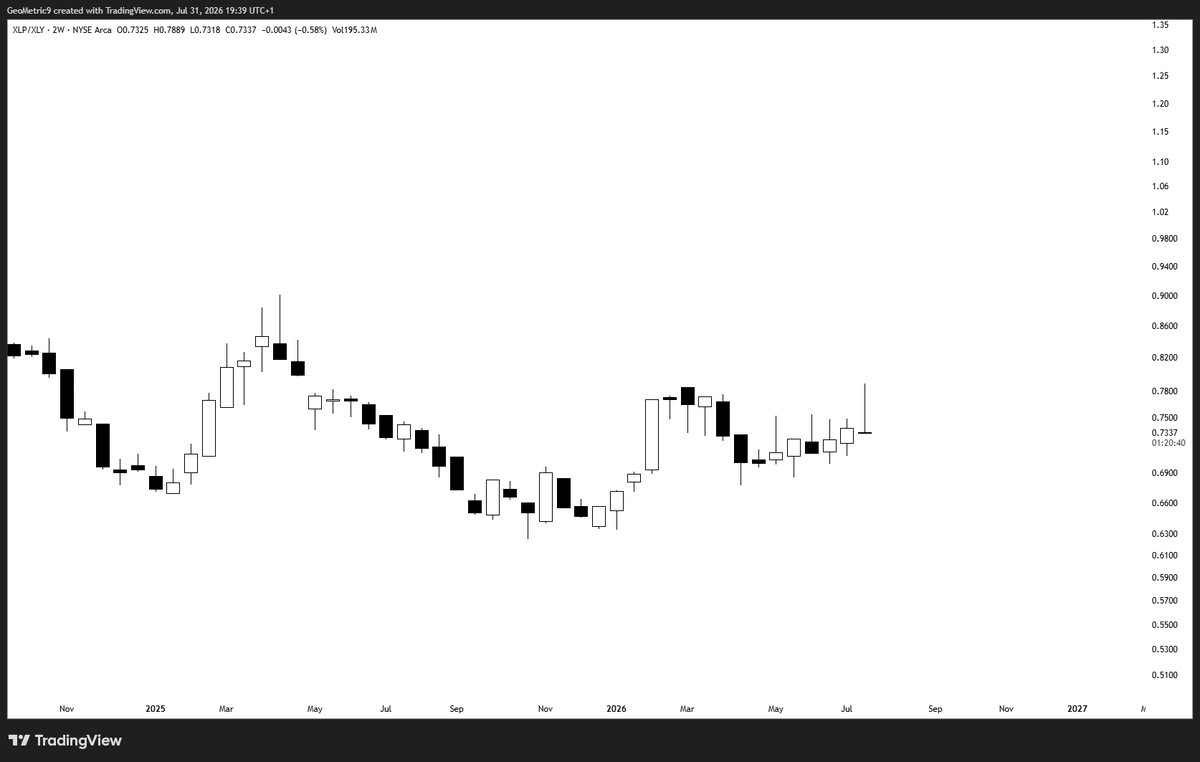
This is the percentage of $SPX stocks trading above their 50 day moving average.
Since 2024, every rally has occurred on declining participation.
The market is attempting to break that trend for the first time in over 2 years.