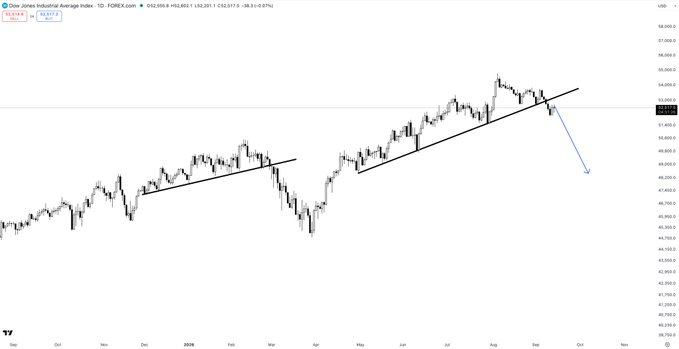
A 🧵 pulling together the 'before and after' for just some of my most accurate calls.
These charts are why you should follow me. There are many, many more in progress...
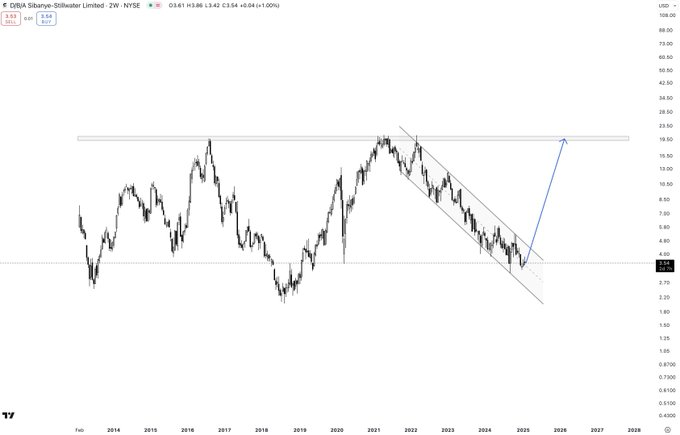
First up is
$SBSW
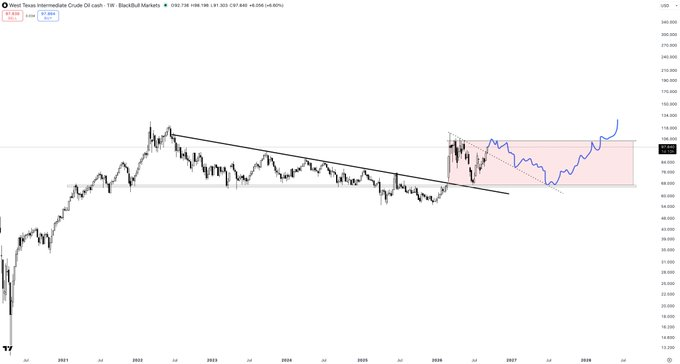
$USOIL
Cramer is bullish oil, which tells me we are nearing a top.
Something like this chimes with my market thesis. Correction in stocks as oil heads for a top. Some sort of resolution in Iran and stocks go bananas in a euphoric move as oil pulls back. Then inflation returns.
$MAGS
Hmm...
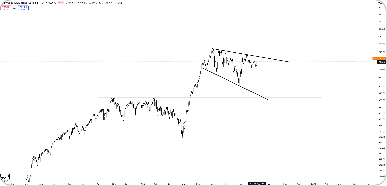
Potentially an early sign that a bigger correction could be on the way?
Bigger picture is bullish, but still open-minded on short-term correction. Invalidated if we get back above those highs.
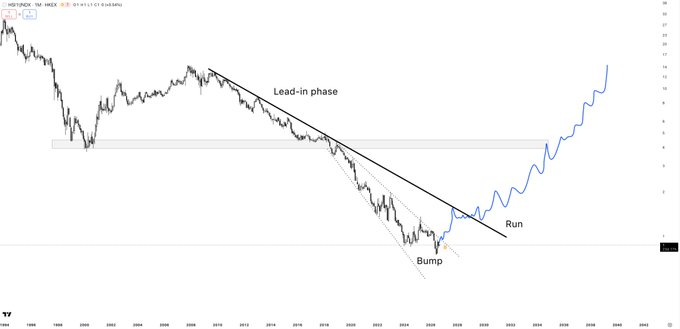
$HSI vs. $NDX
Since the GFC, US markets have soaked up a huge amount of global capital. The HSI has lost 95% of its value against the Nasdaq.
I believe we are in the early stages of a major shift in the opposite direction. This chart tell us that the next decade is China's.
$DELL
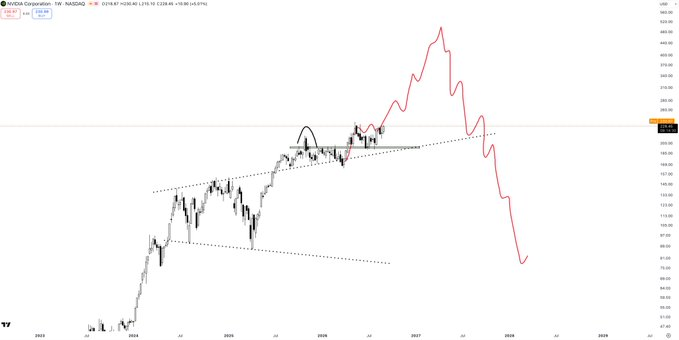
Hard to say exactly how high some of these stocks go before the parabolas break, but when they do eventually top, it'll be brutal journey back down.
Let's enjoy it for now!
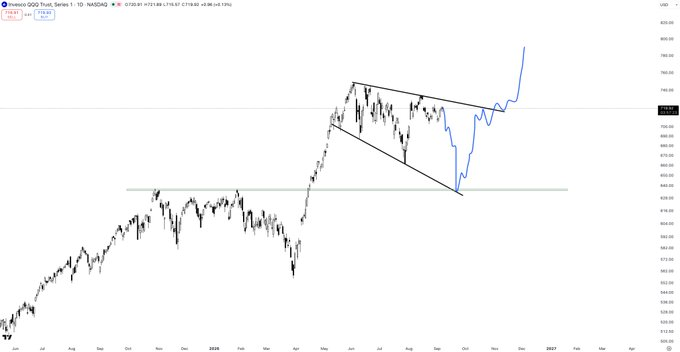
$QQQ
$NDQ
Short-term dip or big breakout on the horizon?
Here's 13 minutes on why it doesn't really matter. In my view, the Nasdaq is still heading to $50k and the next 12 months are an incredible opportunity.
$WTI
$USOIL
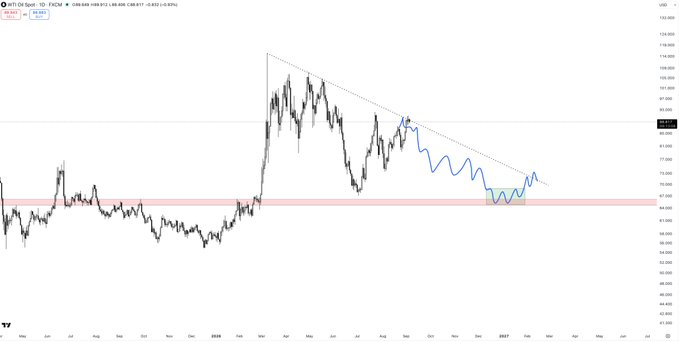
Finally hit the downtrend, just as everyone on here becomes super bullish. Looks like a rejection so far, and I'm still expecting a retest of the $65 zone.
Consolidation for oil is good for equities.
$MAGS
Another reason why I'm leaning towards a breakout rather than a correction on QQQ.
That $69 level has held as resistance all summer. Price has finally broken throug.