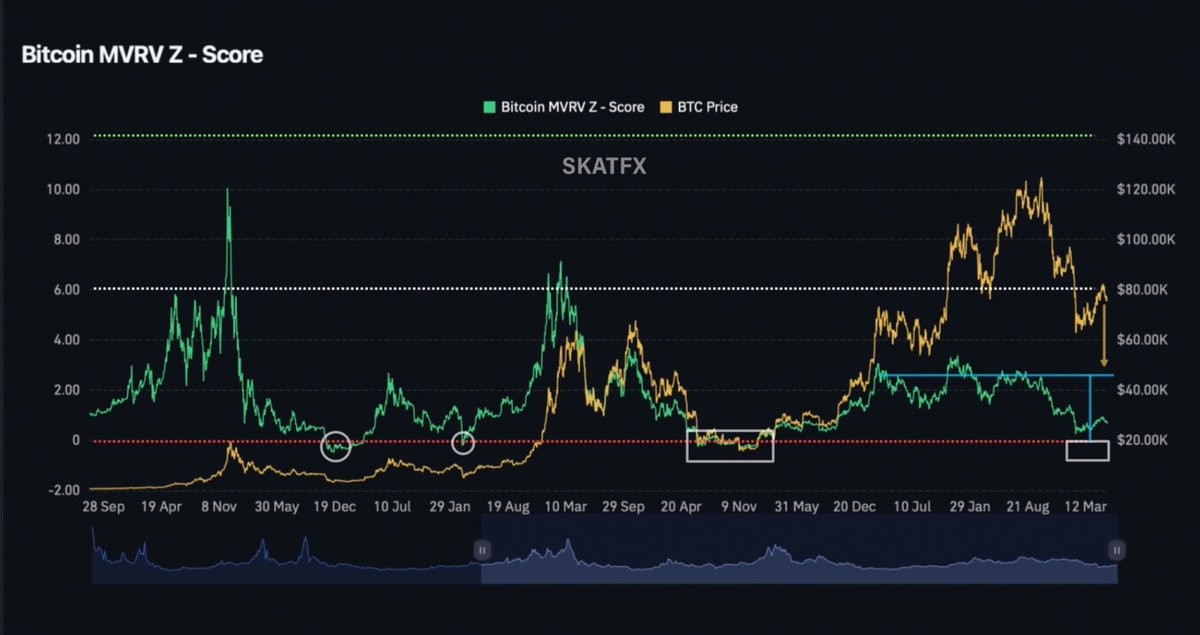
Historically, Bitcoin’s biggest bull runs began after the MVRV Z-Score dropped below 0 during bear markets.
If $BTC falls toward the $38K–$48K range, the indicator could enter that zone again, potentially setting up the next major bull run.
BlackRock deposited 7,048 $BTC($517M) into #CoinbasePrime over the past hour.
This is #BlackRock's largest single-day net $BTC outflow ever.
Another dump coming? 👀
Means something for Dr.Copper & silver
EV growth is shifting metal demand, but the key is not adoption, it’s net demand. Copper benefits from grid + electrification, silver from EVs + solar cycle.
This year seems to be a good year for copper
Gold volatility is now ~2.3x the S&P 500, a level last seen before 2008.
Historically, this shows stress in how risk is being priced across assets, not just strength in gold.
If this regime holds, equities carry a heavier load to keep broader risk assets supported.
If you invested $1000 in each asset at the beginning of 2025, this is your money now:
Silver — $2650
Gold — $1600
Copper — $1430
NVIDIA — $1400
NASDAQ — $1210
S&P 500 — $1140
Bitcoin — $950
Ethereum — $895
$XAGUSD $XAUUSD $XCUUSD $NVDA $NQ $BTC $ETH $SP
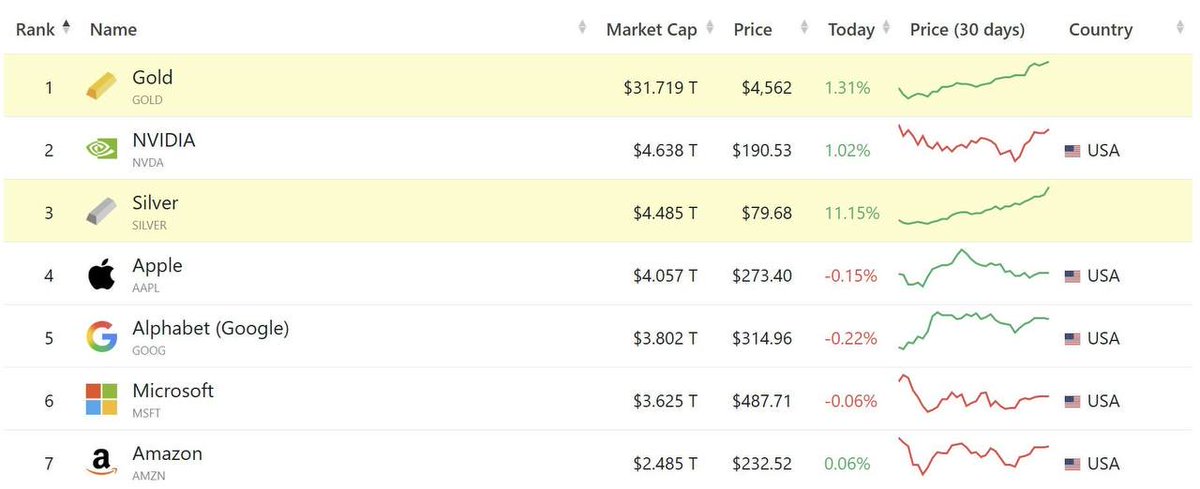
Silver’s market cap jumped by about $500B in a few days, and it’s getting much closer to $NVIDIA. If the trend continues, silver could soon become the 2nd most valuable asset (after gold).
$XAGUSD
Bitcoin $BTC Macro View
Both the Rainbow Chart and the monthly structure are pointing to the same area.
Historically, Bitcoin cycle bottoms form where:
• Long-term valuation reaches deep discount
• Monthly demand structure resets
That confluence currently sits around $60K–$64K.
Not a prediction.
A high-probability zone.
Zoom out.
Cycles are built on the monthly chart.
—
@Bitirium | Deeper macro & on-chain insights