Curious about crypto wallets and how to store and access crypto assets? Check out our Crypto Asset Custody Basics Investor Bulletin.
https://t.co/x4HMYMHLAe
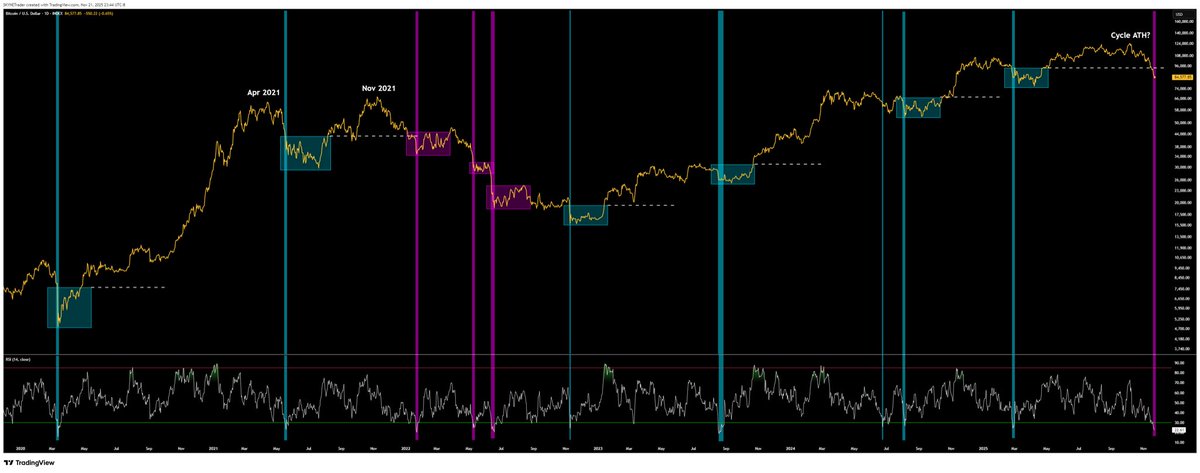
@BittelJulien RV Pro subscriber here. @BittelJulien love your work, thank you. Recreated your chart and ran it a bit further back to Mar ‘20. Top of a blue rectangle should be a support level. If price falls below support (Jan ‘22 and now), then end of cycle? I truly hope not this time! 🙏
Remember when we learned that our wealthiest and most powerful people were connected to a guy who ran a literal child sex trafficking ring? And then that guy died mysteriously in a jail? And now we just don't talk about it.
Wanted to share a few thoughts tonight...
This is from the September 11th MIT publication that dropped on @RealVision:
For starters, unemployment keeps grinding higher, exactly as our lead indicators and GMI/MIT work flagged back in Q1.
That keeps the Fed engaged and is why, as I noted in last week’s video update, the market has started pricing in a higher probability of cuts at the September, October, and December meetings...
US unemployment is now at 4.3%, right on the Fed’s low estimate for 2025 (chart 1).
If it drifts toward 4.5% or 4.6%, as our lead indicators suggest, that’s a green light for more cuts into 2026, even though there are early signs the employment cycle has already turned up. More on that in a moment...
At the same time, unemployment breadth peaked over a year ago and continued to fall in August (chart 2).
Quantitatively, this is a good sign. The index rises into recession, it doesn’t fall…
We peaked last June at 92%, but it has since dropped to 62% of US states reporting a year-on-year rise in unemployment.
Now, take a look at this next chart...
This index tracks weekly overtime hours in the most cyclical parts of the US economy, with data back to the 1950s (chart 3).
Every recession has come when it rolls over toward the -2 standard deviation level, and we are nowhere near that.
Additionally, the August data showed a further pick-up in overtime hours, which, as I have been highlighting in these reports, is much more consistent with an early-cycle economy trying to build momentum than anything else...
This is exactly why S&P earnings revisions keep exploding higher, just as we’ve been expecting (chart 4).
The Fed is cutting rates right as the business cycle is turning up. That’s hugely bullish for risk assets.
These aren’t late-cycle recession cuts. They’re early-cycle insurance cuts... two very different things.
The end of The Waiting Room is near...
POLL, is it a hoax that Jeffrey Epstein was involved in underage sex trafficking, and there is unreleased evidence that would likely expose rich and politically connected perpetrators to indictments or convictions?
The Everything Code TL;DR.
The labor force participation rate isn’t going to rise anytime soon – it’s set to keep declining over time. This is a structural problem…
We’ve got aging demographics, falling birth rates, and now the rise of automation.
Humans are already being replaced by AI and robots at a staggering pace, and that shift is only just beginning. This is deflationary.
It also reinforces the need for ongoing stimulus to keep the system afloat.
Fewer workers. More tech. Same debts…
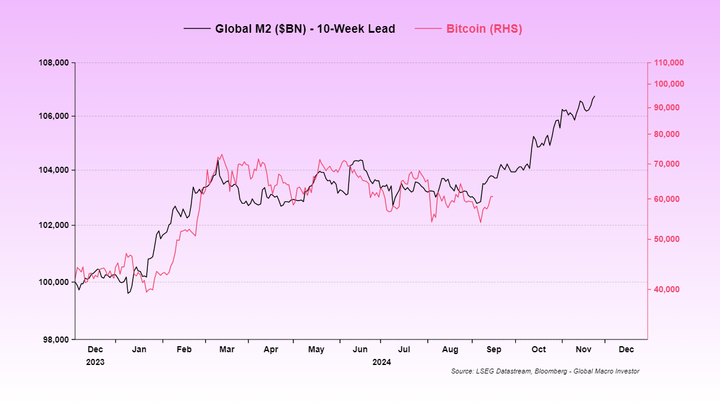
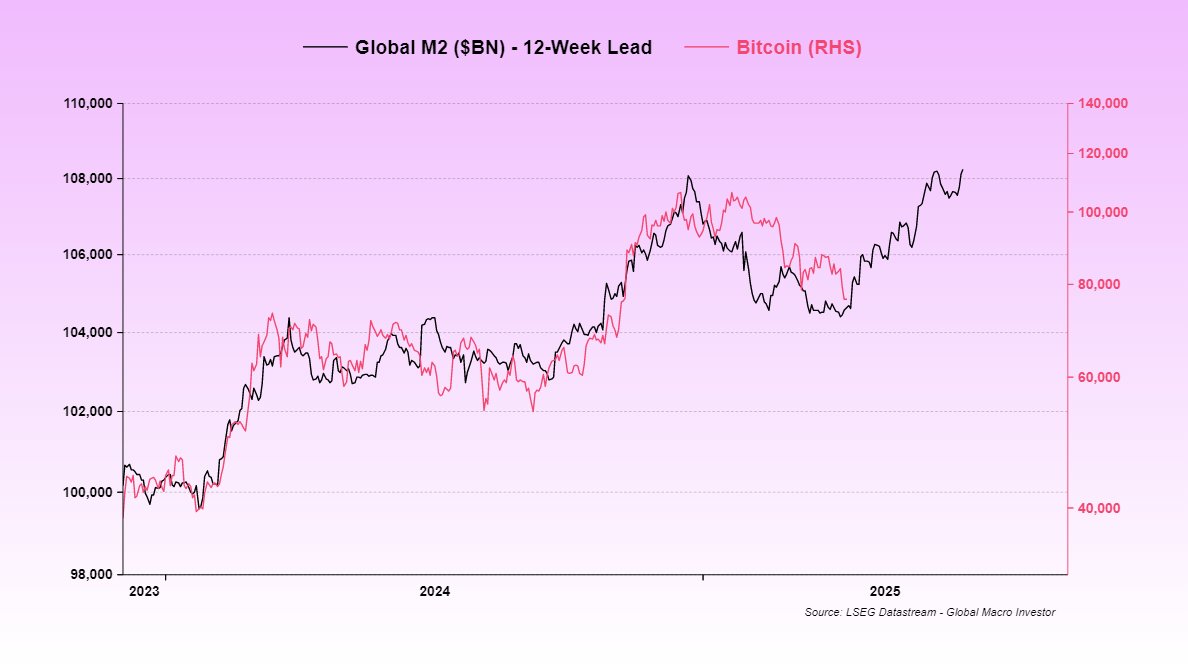
This chart is very outdated – it’s one of ours from back in Q4 of last year, when we were expecting Global M2 to bottom and start turning higher. Attached is the latest chart: new all-time highs…
@RaoulGMI and @BittelJulien - finally got around to reading the Pro Macro Deep Dive from November’s GMI. 🤯 Even after a year of Pro All Access, I’m still blown away by the insights and analysis of your work. Thank you for sharing these GMI pieces with RV members. 🙏
@FrostEngineer@RaoulGMI@BittelJulien Yes, that’s right 👍 - “Macro Insiders Deep Dive” report. The RV email from Dec. 19 titled “Pro Macro: New Deep Dive” also has a link to this report originally released to GMI subscribers in November. Looks like I was slightly off on the report name in my orig post…