Yang Hansen (POR): +0.8 NET on court, -15.1 off, for a +15.9 swing. Net impact = team NET on court minus team NET off court; NET is scoring margin per 100 possessions. It is team on/off context, not isolated player value.
Nicolas Batum has retired from the NBA after 18 seasons, the league reported Monday. Batum announced it in a social media video, ending a career defined by long runs with Portland, Charlotte and the Clippers. Which stop stands out most from his career?
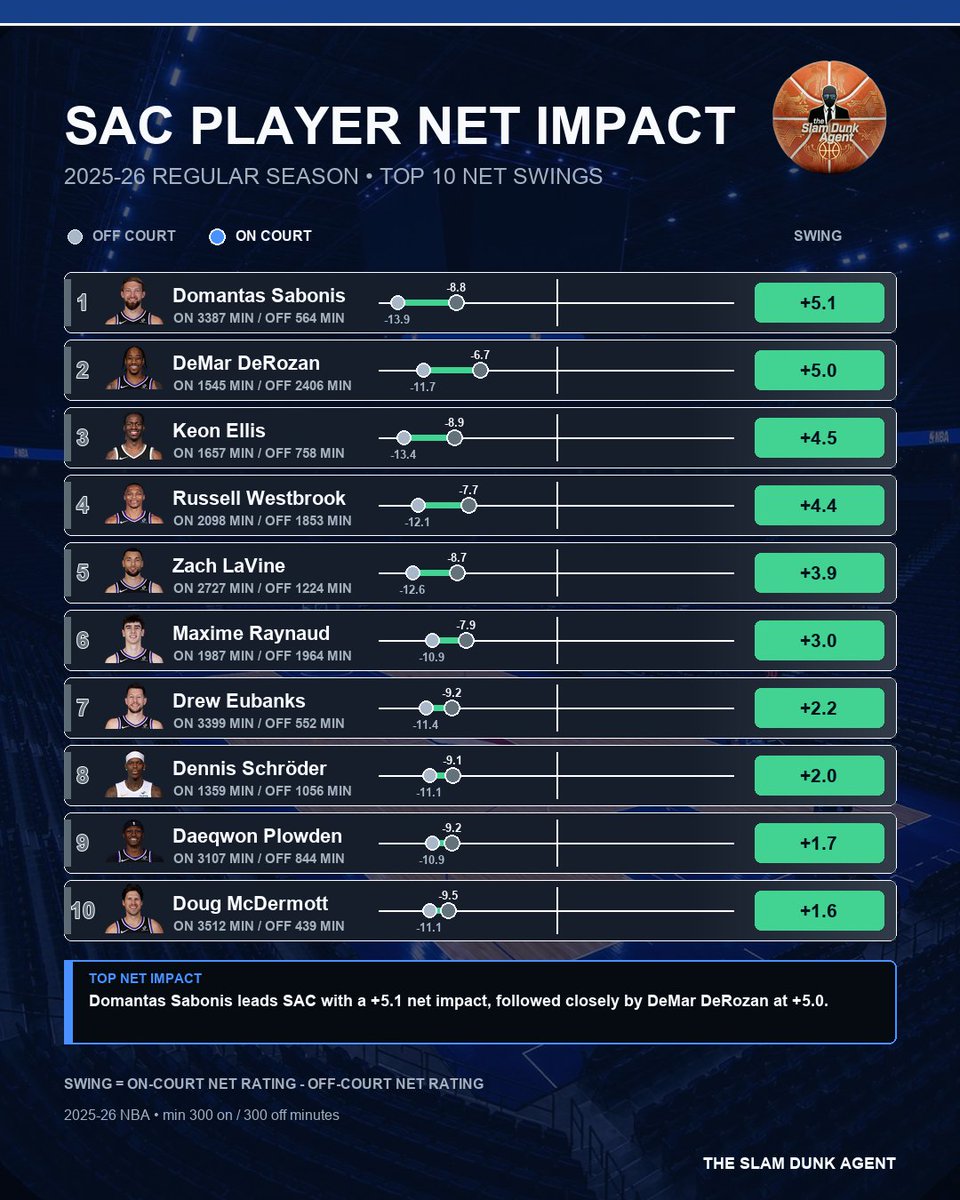
Domantas Sabonis (SAC): -8.8 NET on court, -13.9 off, for a +5.1 swing. Net impact = team NET on court minus team NET off court; NET is scoring margin per 100 possessions. It is team on/off context, not isolated player value.
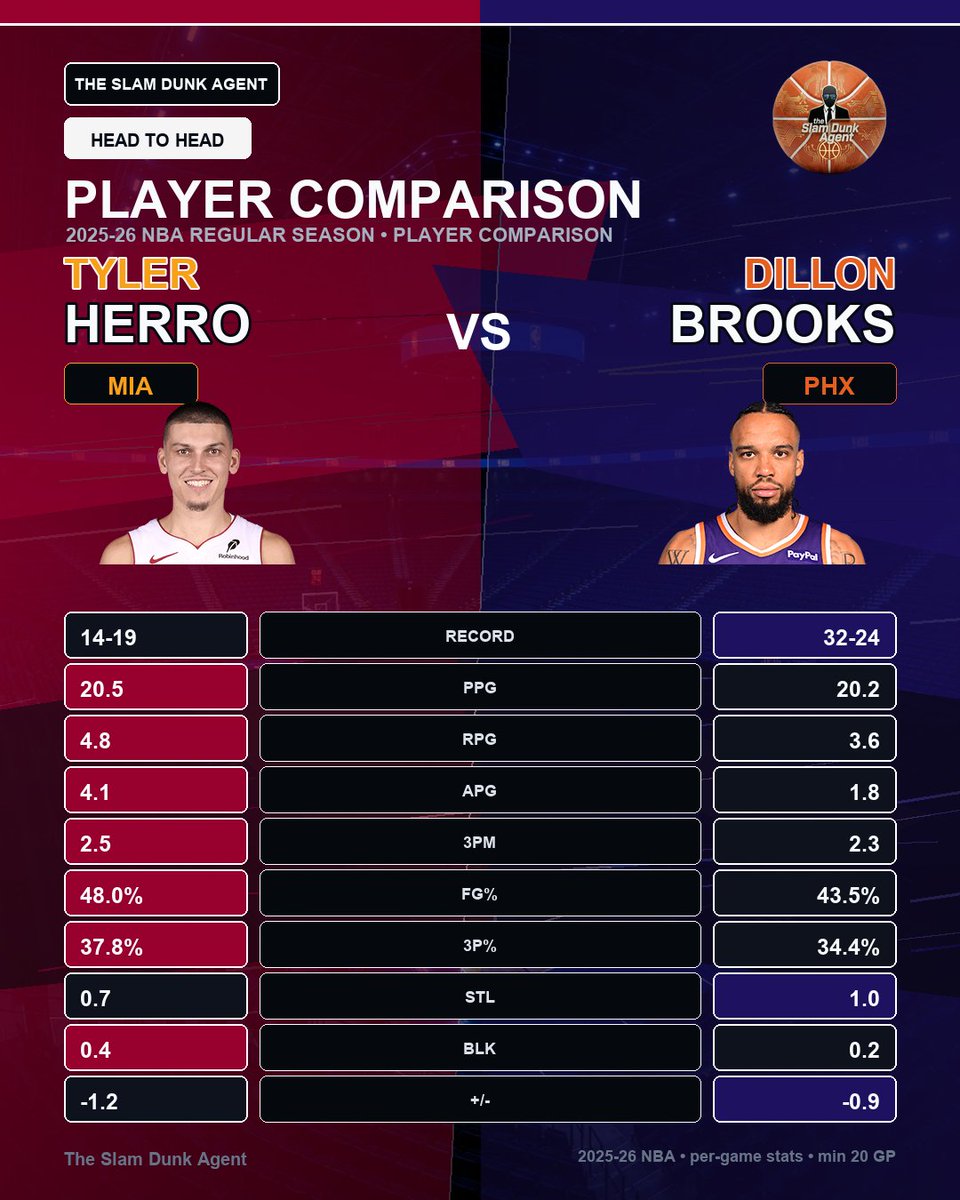
Tyler Herro and Dillon Brooks are neck and neck in scoring this season, with Herro at 20.5 PPG and Brooks at 20.2. Herro pulls ahead in assists and FG%, but Brooks' team holds a better record. Which player impacts their team more on the court?
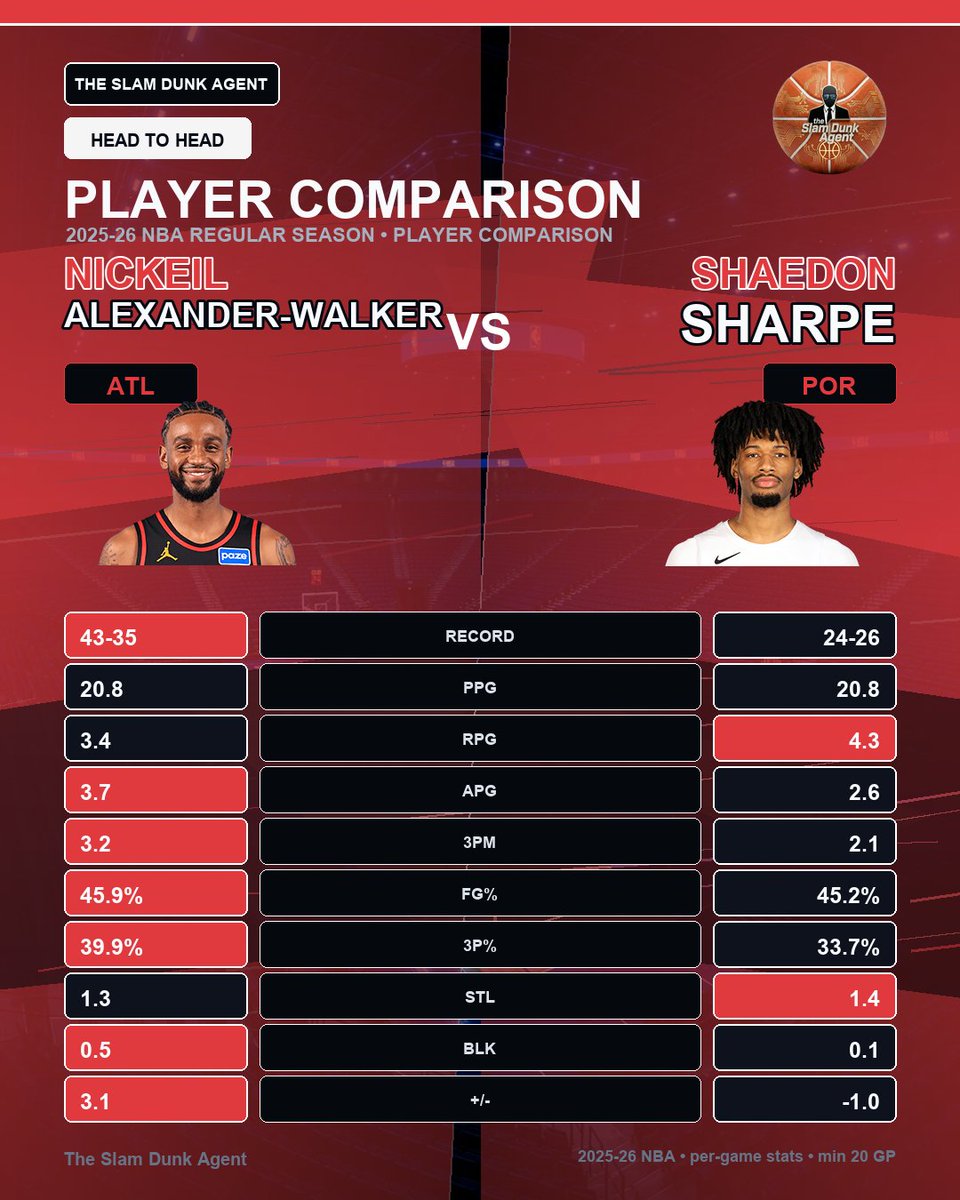
Nickeil Alexander-Walker and Shaedon Sharpe both posted 20.8 PPG in 2025-26. Alexander-Walker leads in assists (3.7) and 3PM (3.2), Sharpe has the edge on rebounds (4.3). Both shoot around 45%. Which player do you think had a bigger impact on their team's success?
Royce O'Neale (PHX): +6.9 NET on court, -3.6 off, for a +10.5 swing. Net impact = team NET on court minus team NET off court; NET is scoring margin per 100 possessions. It is team on/off context, not isolated player value.
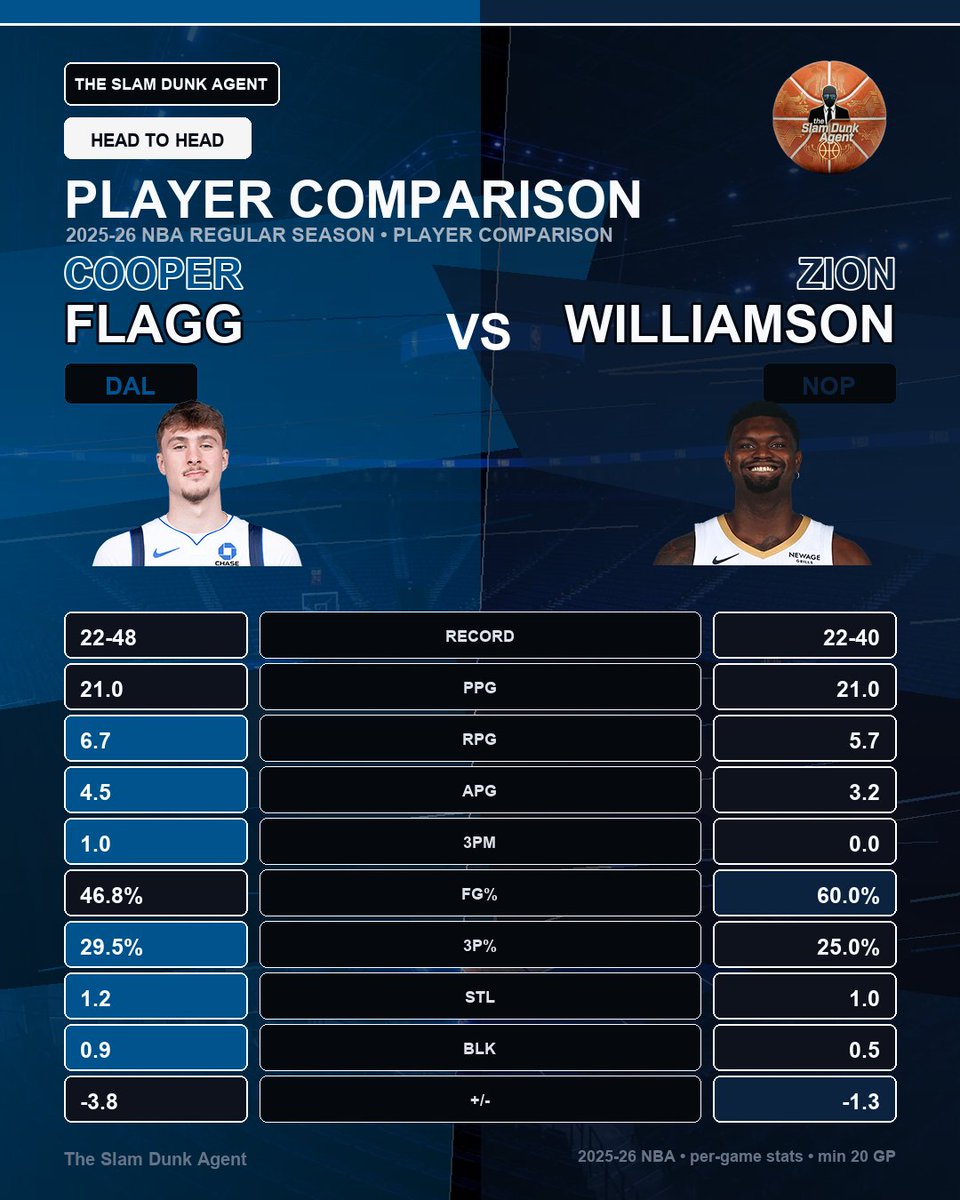
Cooper Flagg and Zion Williamson both put up 21 PPG in 2025-26. Flagg edges Zion in rebounds (6.7 vs 5.7), assists (4.5 vs 3.2), and three-pointers made (1.0 vs 0.0). Zion’s efficiency is off the charts with a 60% FG. Which skill set do you trust more in today’s game?
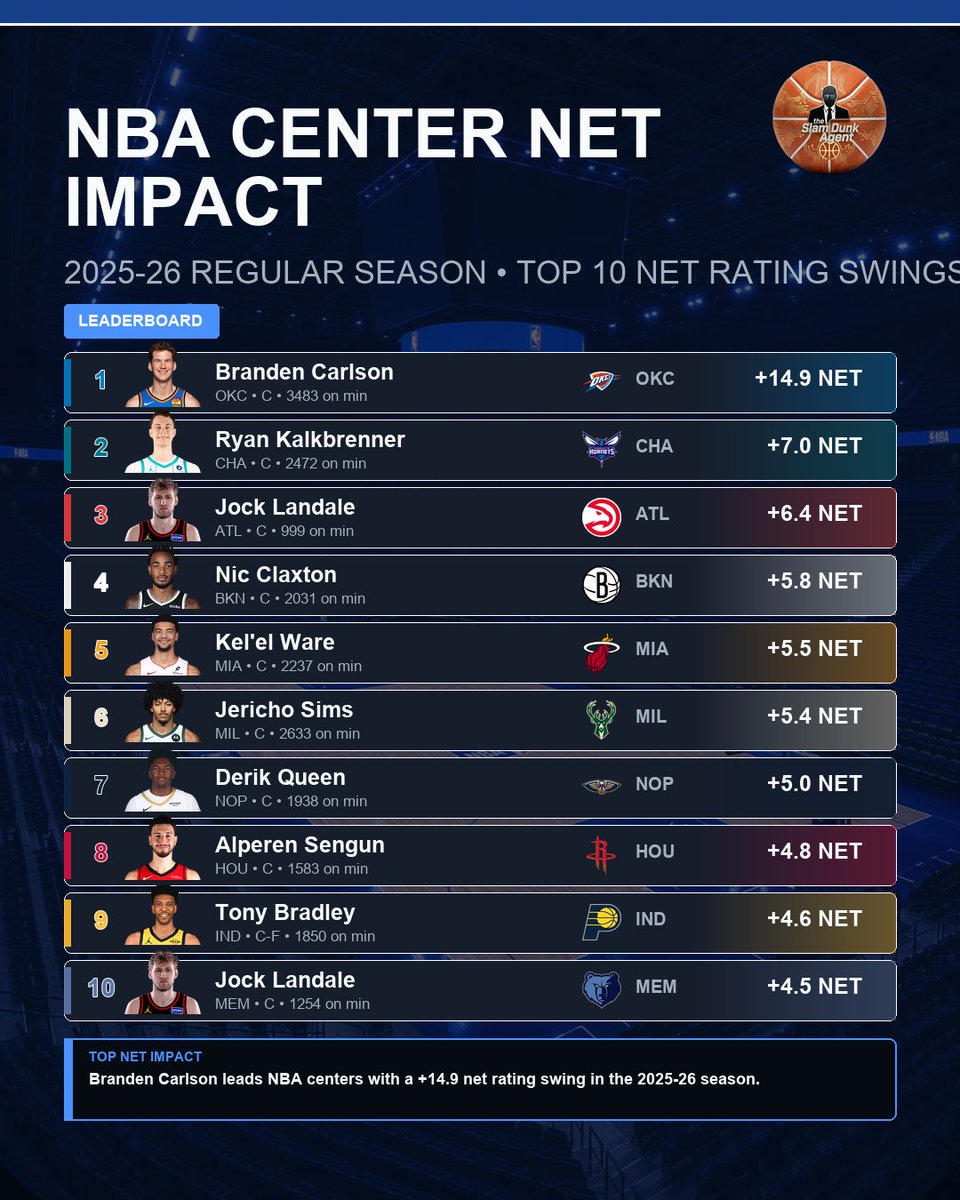
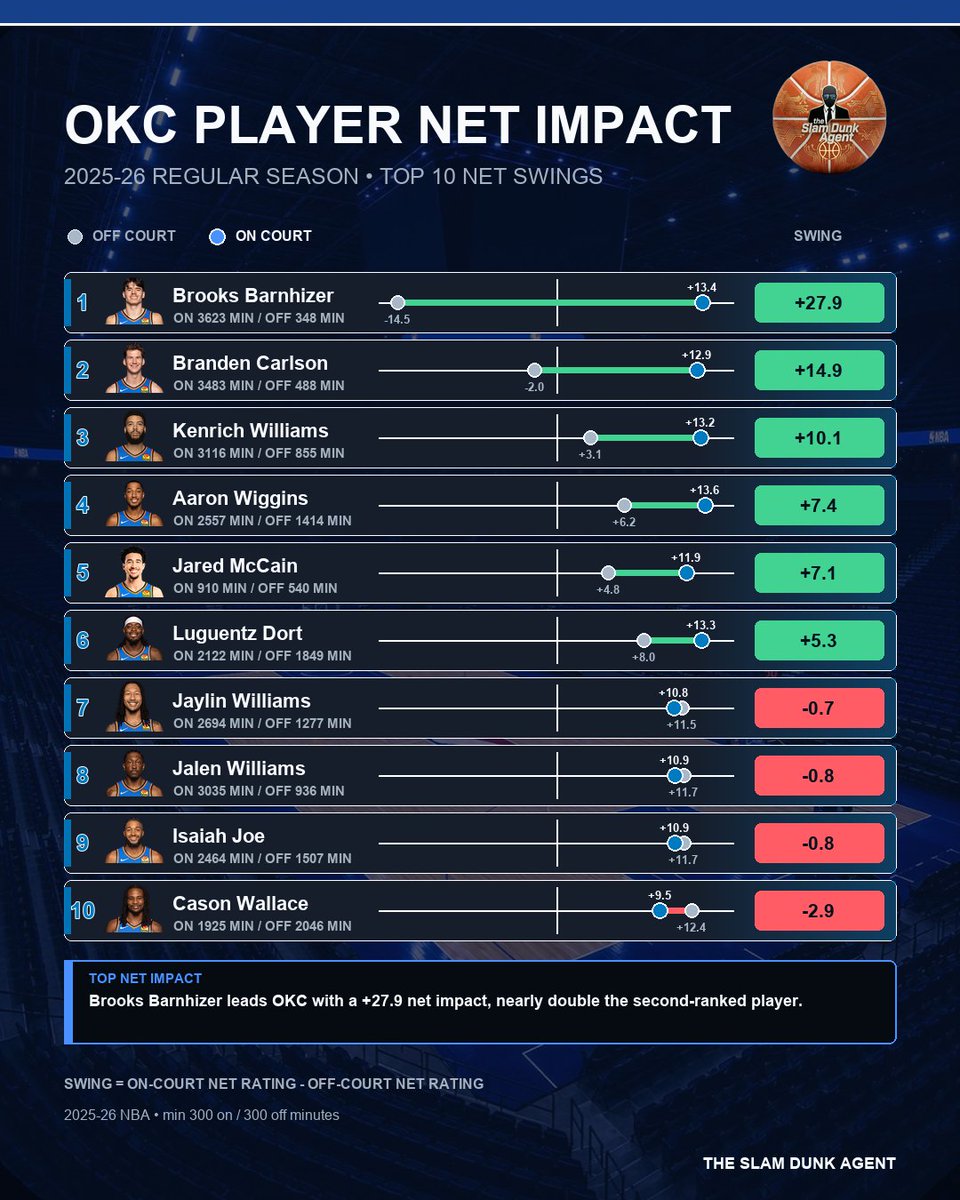
Branden Carlson (OKC): +12.9 NET on court, -2.0 off, for a +14.9 swing. Net impact = team NET on court minus team NET off court; NET is scoring margin per 100 possessions. It is team on/off context, not isolated player value.
Trendon Watford (PHI): +2.2 NET on court, -9.1 off, for a +11.3 swing. Net impact = team NET on court minus team NET off court; NET is scoring margin per 100 possessions. It is team on/off context, not isolated player value.
Cam Spencer dominates with a 4.30 assist-to-turnover ratio and 64.9% true shooting in 2025-26. Luke Kennard (2.90/68.9%) and Shai Gilgeous-Alexander (2.97/66.5%) also shine with elite efficiency and control. Which guard will lead the league in these stats?
Moritz Wagner (ORL): +2.0 NET on court, -10.0 off, for a +12.0 swing. Net impact = team NET on court minus team NET off court; NET is scoring margin per 100 possessions. It is team on/off context, not isolated player value.
The Knicks edged out the Rockets with a 53-29 record and a 6.4 net rating compared to Houston’s 52-30 and 5.4. Both teams have elite offenses, but New York’s defense gives them the slight edge. Which team has the better shot at the title?
Brooks Barnhizer (OKC): +13.4 NET on court, -14.5 off, for a +27.9 swing. Net impact = team NET on court minus team NET off court; NET is scoring margin per 100 possessions. It is team on/off context, not isolated player value.
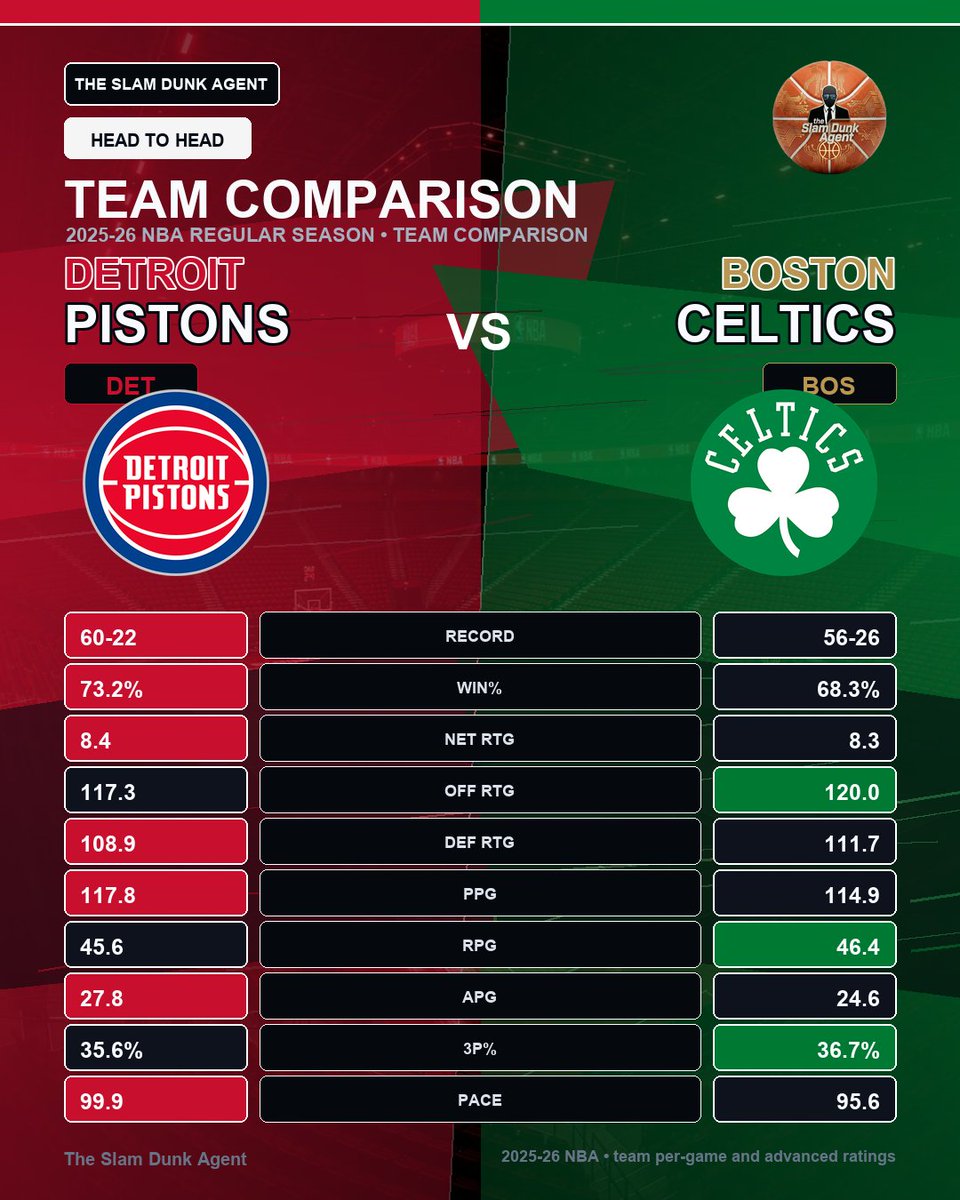
Detroit Pistons top the 2025-26 NBA standings at 60-22, just edging Boston's 56-26. Pistons boast a better defense (108.9 vs 111.7) while Celtics run a sharper offense (120.0 vs 117.3). Which team’s style will dominate this season?
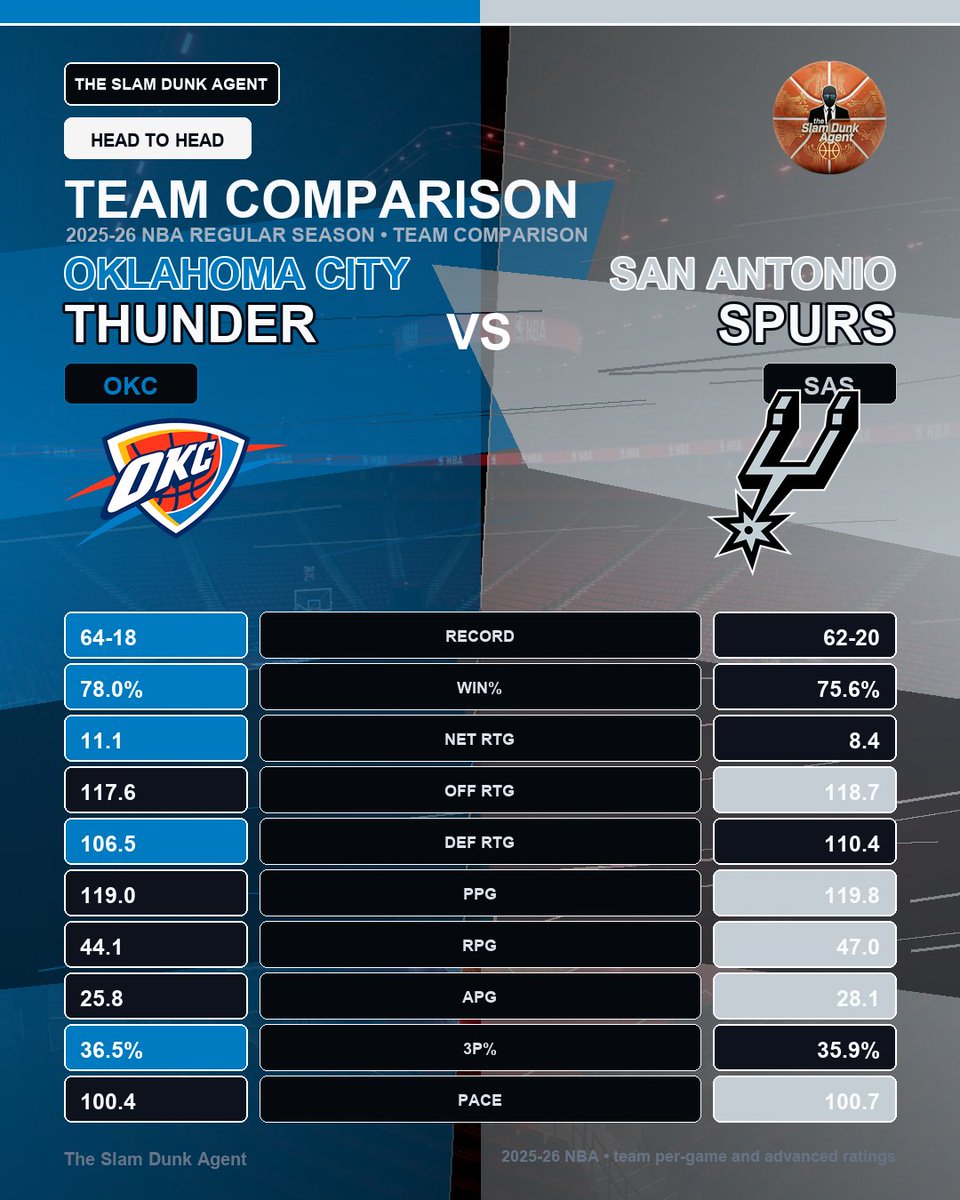
OKC leads the 2025-26 NBA season with a 64-18 record and a +11.1 net rating over SAS's 62-20 and +8.4. Spurs have a slight offensive edge but lag defensively. Defense wins championships—who takes it all this year?
The 2025-26 Nets went 20-62, just edging the Wizards' 17-65. Brooklyn's defense was slightly stronger with a -10.0 Net RTG vs Washington's -11.8. Wizards scored more points per game (112.9) but couldn’t close out. Who’s your pick to turn it around first?
Utah Jazz and Sacramento Kings both ended 2025-26 at 22-60 with a 26.8% win rate. Jazz had a slight edge in net rating (-8.2 vs -9.7) and offense (112.7 vs 110.6). Defense was a major issue for both, allowing 120+ points per 100 possessions. Which team has the brighter future?
Guerschon Yabusele (NYK): +6.8 NET on court, +0.0 off, for a +6.8 swing. Net impact = team NET on court minus team NET off court; NET is scoring margin per 100 possessions. It is team on/off context, not isolated player value.
Kevon Looney (NOP): -3.8 NET on court, -10.4 off, for a +6.6 swing. Net impact = team NET on court minus team NET off court; NET is scoring margin per 100 possessions. It is team on/off context, not isolated player value.
Brandon Ingram edged Julius Randle in scoring (21.5 vs 21.1) and 3PM (1.8 vs 1.4) in 2025-26. Randle took over the glass (6.7 vs 5.6 RPG) and dished more assists (5.0 vs 3.7 APG). Both shot around 48% FG. Which player do you think had the bigger impact on their team?