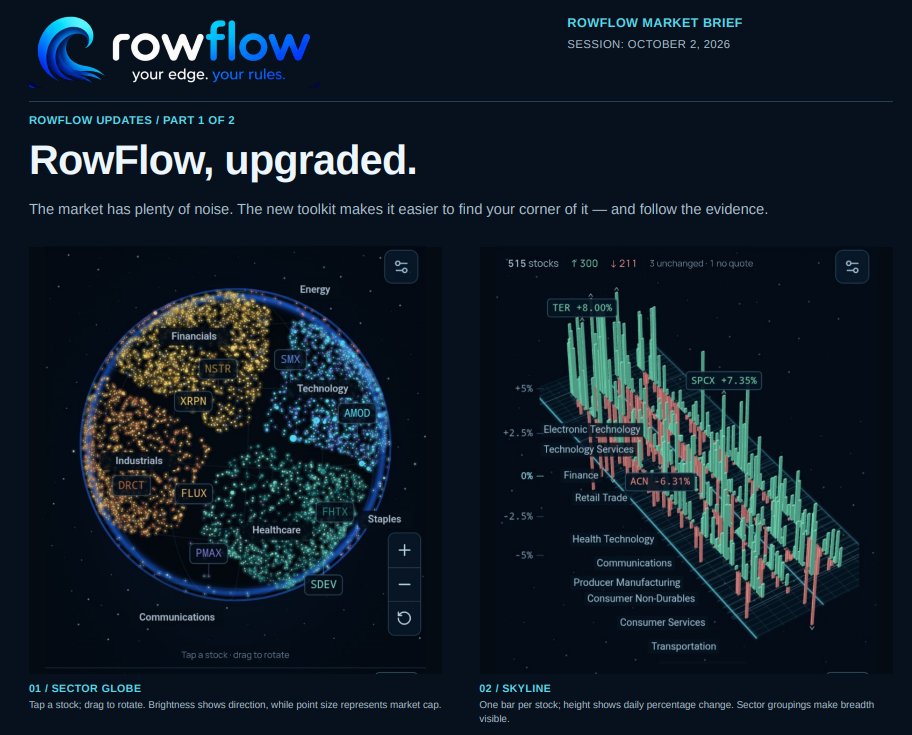
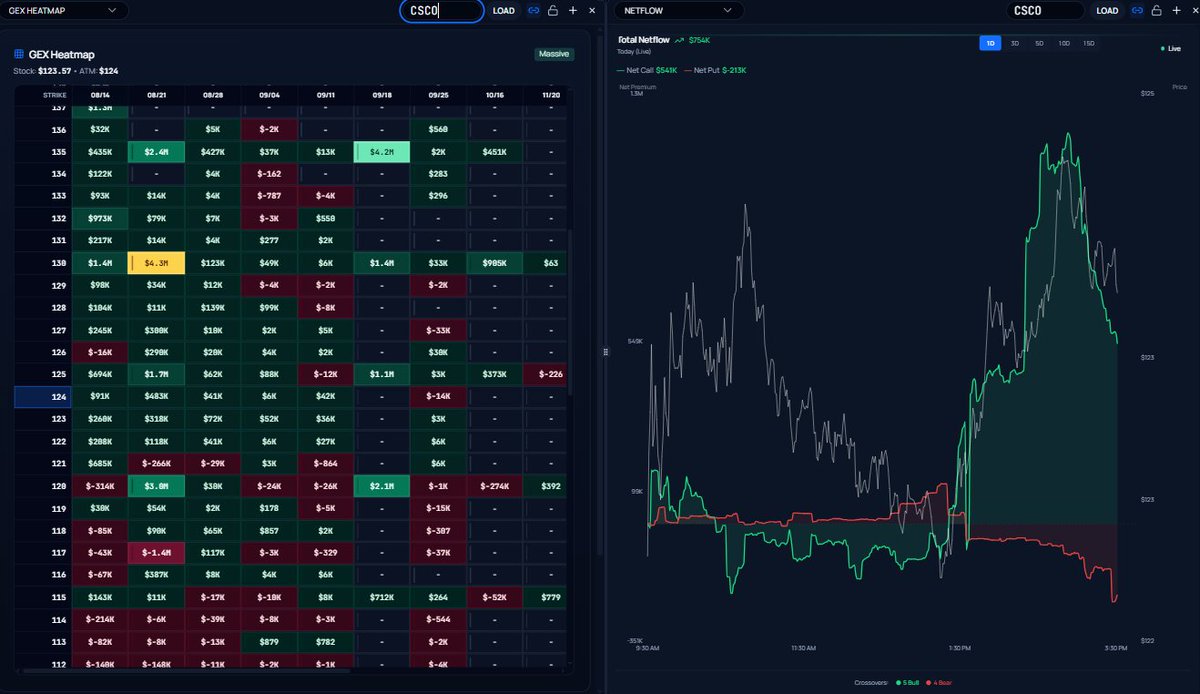
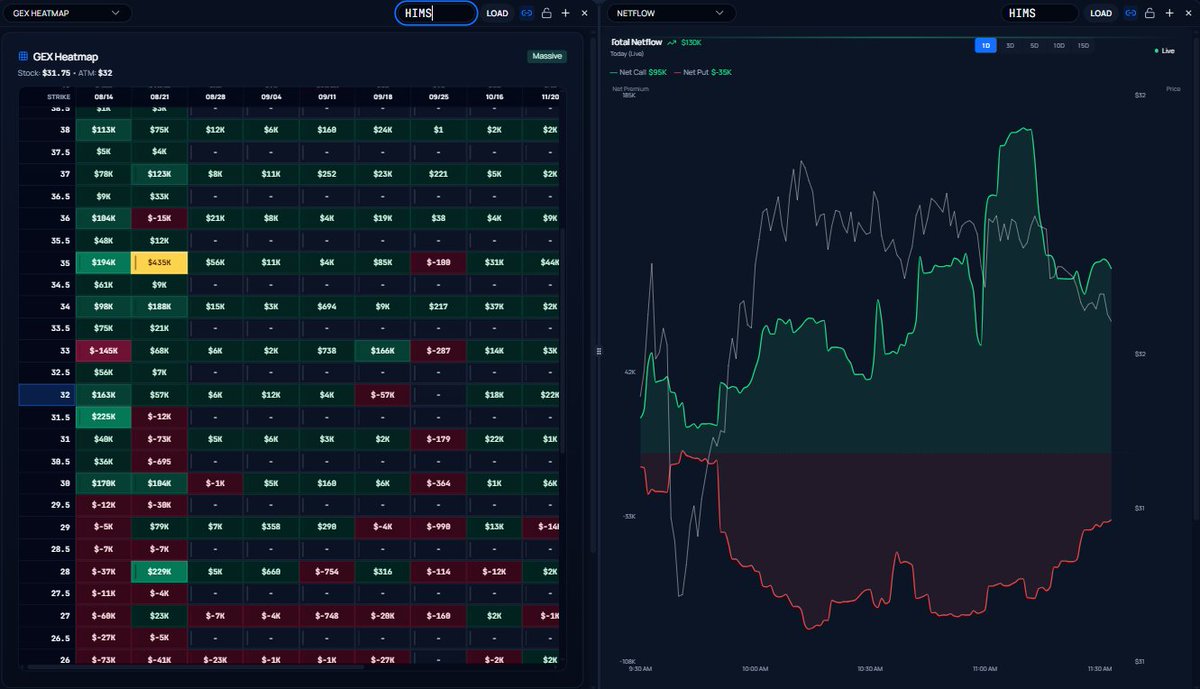
RowFlow, upgraded.
The market has plenty of noise. The new toolkit makes it easier to find your corner of it — and follow the evidence.
New in the dashboard:
• Heatmap, Sector Globe, and Skyline - leadership, laggards, and breadth in one view
• Ticker Deep Dive - trend, netflow, and exposure behind every alert
• Options Scope - unusual activity with sweep/block context, not just a flag
• Watchlists - your universe, your rules, your alerts
Your edge. Your rules.
https://t.co/AHNzmJxjXX
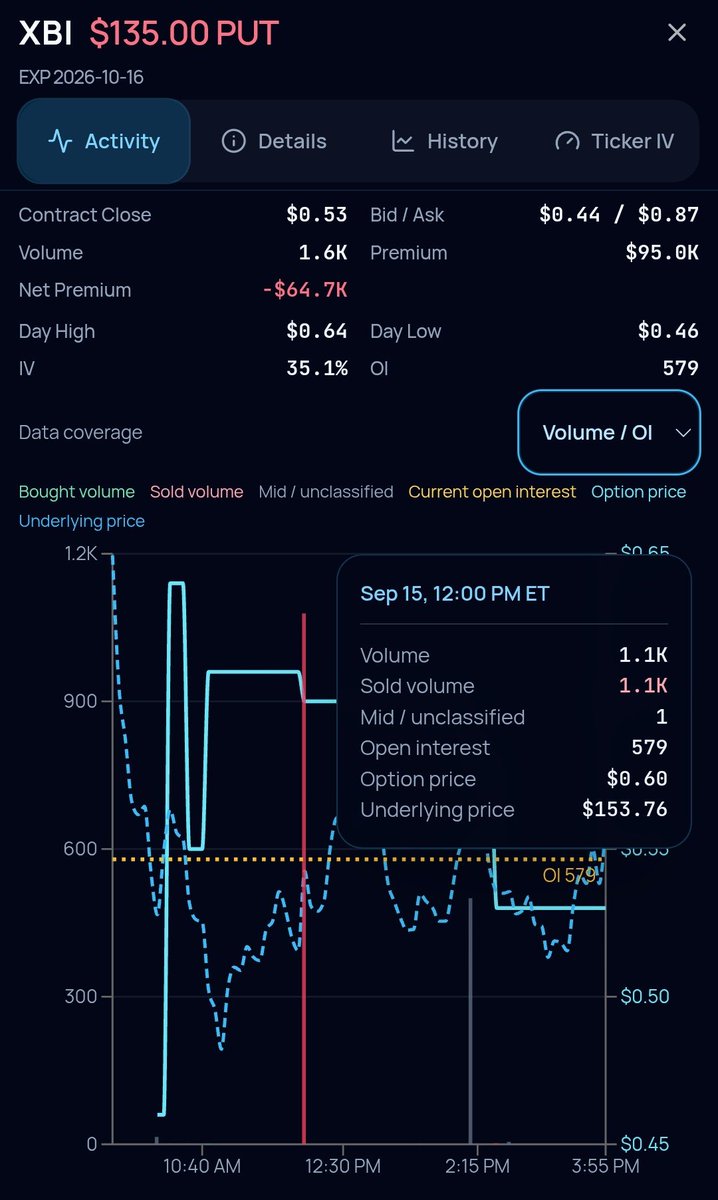
UOA spotted in $XBI 👀
Someone sold 1.1K Oct. 16 monthly $135 puts at $0.60. The strike sits 12% below spot, about 1.4x the 30-day expected move.
Someone is bullish biotech, or perhaps just willing to own it lower.
Bold time to be short volatility ahead of the Fed. 👀
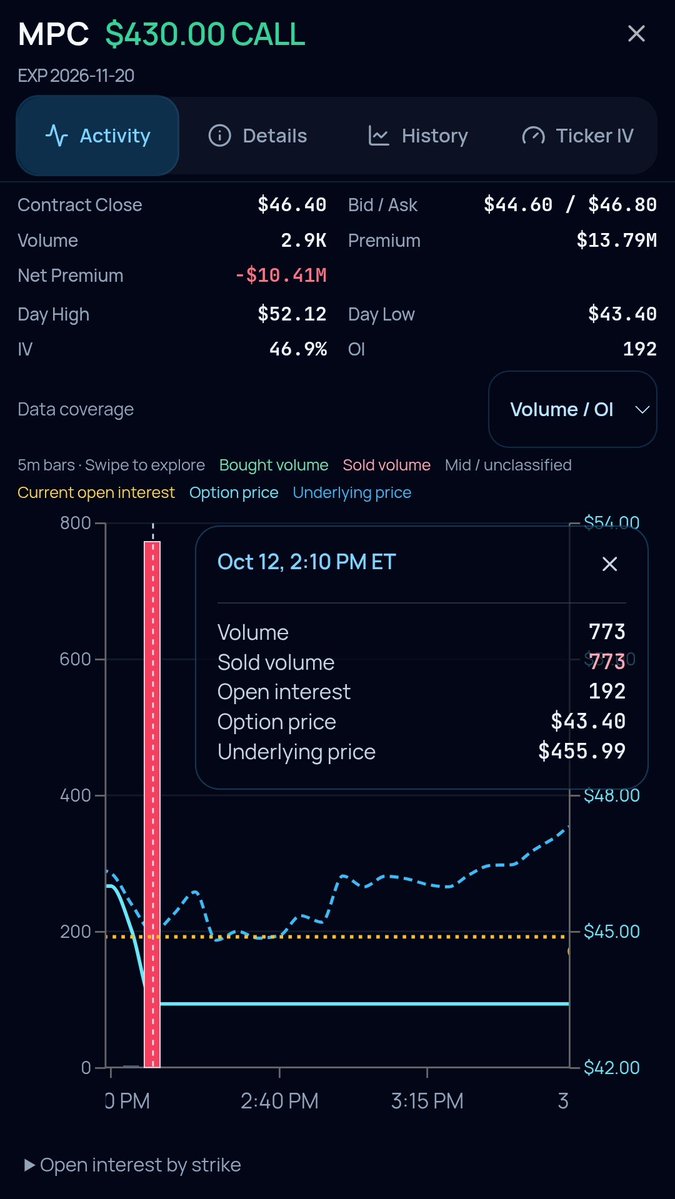
Open interest vs volume:
Volume = contracts traded today.
Open interest = contracts still held open.
Rising price + rising OI = new money committing.
Rising price + falling OI = shorts covering. Different story.
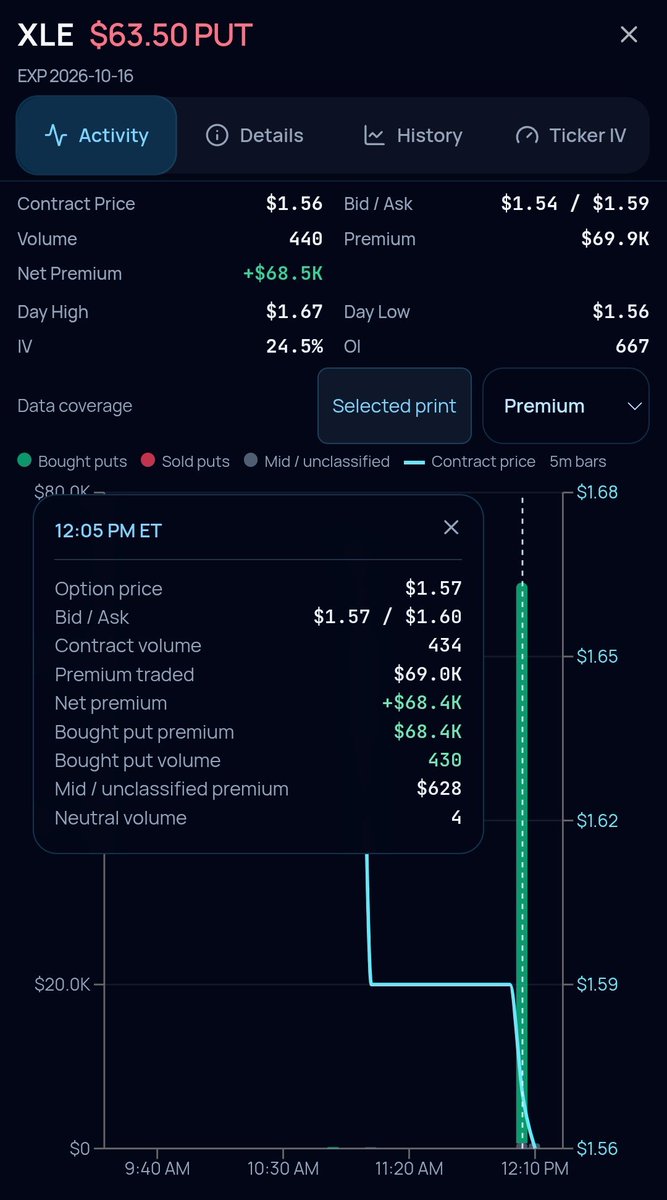
Net Flow is the most misread signal in options.
Most people see green and think "bullish."
That's how you get faked out.
Here's what it's actually telling you 🧵