@TradesJayGann Hey Jay, long time no chat
I keep seeing 7/15+- for various reasons
Somewhat related, this year has really cemented the importance of 30-60-90 in my mind that Tesla and Gann talked about--although, not the only thing that's relevant of course
Care to chat privately for a bit?
@grok@danrheath@Jampzey That new ATH would be exactly 100 years after DJIA September 3rd, 1929 market top
Seems unlikely to me, but would be wild if true 🫣
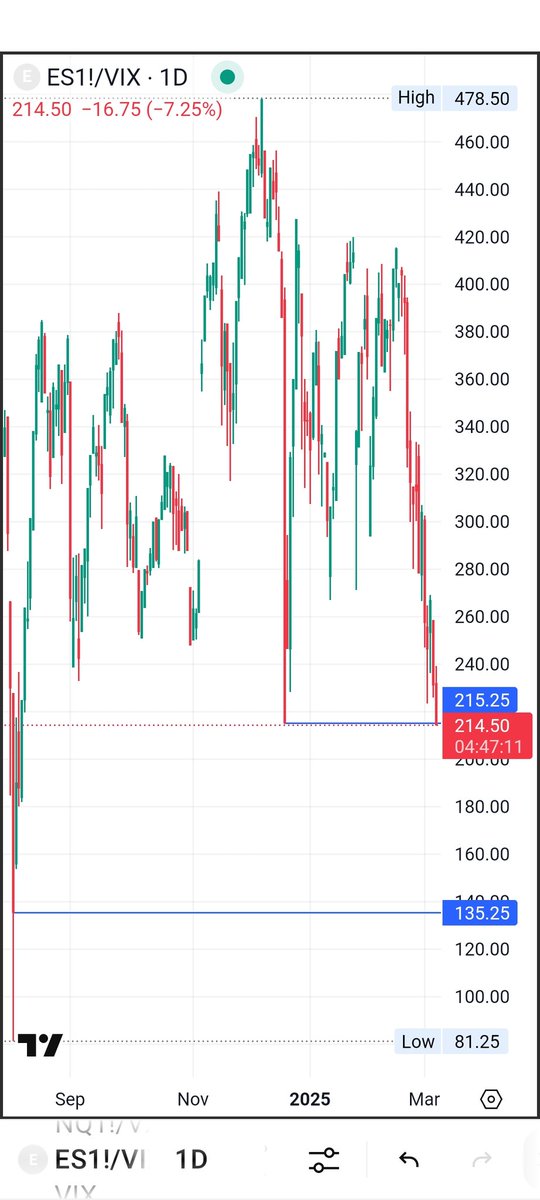
ES / $VIX ratio
Finally filled 12/18 candle close/gap
Look for divergences around these low levels for a bounce...
$SPX $SPY $NDX $QQQ $RTY $RUT $IWM $DJI $DIA $VVIX
A positive January followed by a negative February has happened for the 17th time in $SPX. On average, the index closes the year 9.5% higher from the end of Feb, with a probability of gain of 75%:
The most potent equation one can learn is to calculate the future cost of current decisions
Where discipline pays dividends and shortcuts compound into regret
Remember this and watch your life change in 36 days
#MondayMathematics 🧠
Anyone notice we've got some of the same turning dates as 2019-2020 period?
Last year important low 8/5 as in 2019
This year important high 2/19 as in 2020
First green candle after 2/19 highs: 2/28
Line chart from period of 2019-2020 over today even provides other pivots 🤔🤯
How's this for random?
08/05/2024
$SPY falls -3.00% and the entire OHLC bar is below its lower BB.
08/05/2019
$SPY falls -3.01% and the entire OHLC bar is below its lower BB.
You can't make this stuff up.
@bdubalerts Interesting about 163 weeks from 2022 top
SPY 613 2/19/25 high also cardinal cross and same digital root as 163...
There's always these mathematical relationships, but hard to know if major high or low without the benefit of hindsight
1.The median February low compared to January’s close across all years is -2.49%.
2.The 20th percentile of February’s low compared to January’s close, when January’s gain was between 2% and 4%, is -2.51%.
3.This puts 5889 $SPX as a key level for February’s low.
Please RT.
$SPY: What happens the year after being up more than 20% two years in a row, not bad, Gann says 5 is a big year of the decade, year of Ascension, altho it doesn't always work out
I nominate this from @Smartpredictor for _Best Cycles Post of 2024_
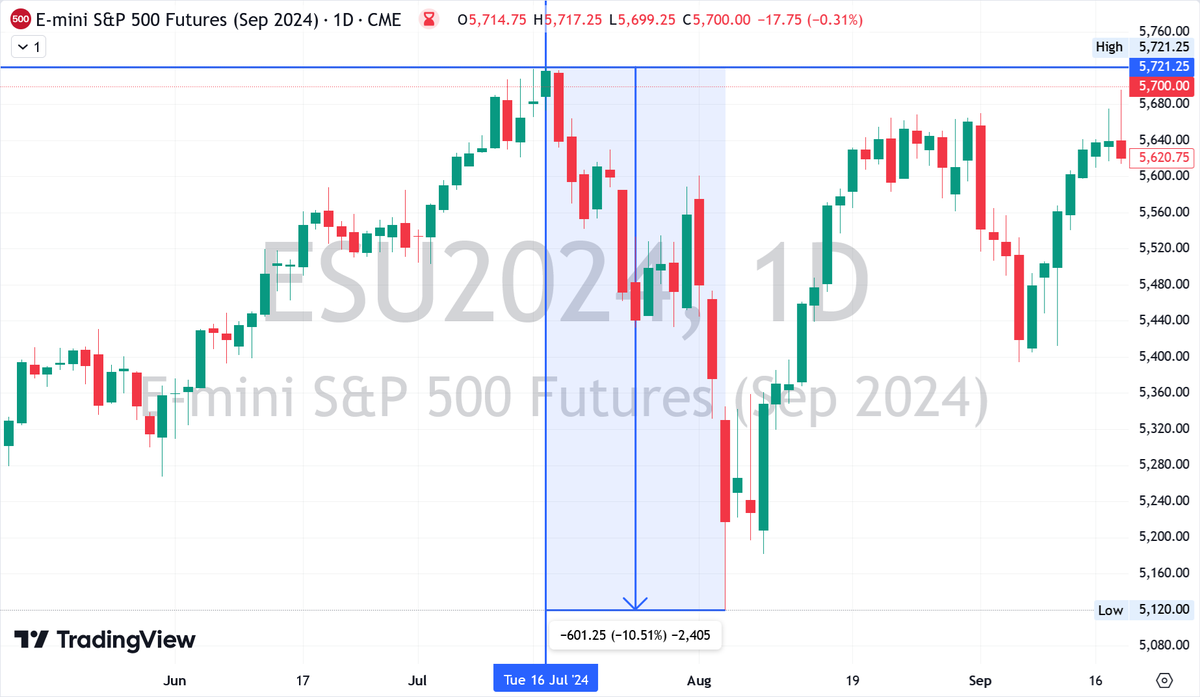
"massive top at 7/16/24 with decline starting with 7/17/24 bar in ES Futures" ✅
Publicly & for free on day of 7/16 high
"We are likely to begin a massive retrace" ✅✅
Biggest decline of the year at -10.51%
$spx has likely put in a massive top at 7/16/24 with decline starting with 7/17/24 bar in ES Futures. Very strong geometry with 2000. 2007, 2009, 2023.
Refer to the previous major pivot call here when I called the Oct 27th, 2023 bottom. We are likely to begin a massive retrace of that low now.
DYOR. NTA.
@CallMeShylo Of all SPX CFDs, I'm paying attention to SPREADEX the most. Levels are on friggin point
Inspirational... there are various methods to figuring out resistance in ATH, but Shylo remains the best at calling them out ALL THE TIME
H/t sir
@CallMeShylo Of all SPX CFDs, I'm paying attention to SPREADEX the most. Levels are on friggin point
Inspirational... there are various methods to figuring out resistance in ATH, but Shylo remains the best at calling them out ALL THE TIME
H/t sir
@CallMeShylo Yes, important age LEVELS you highlighted there
Part of me doesn't want to get too old, but maybe I'll appreciate the wisdom that comes along with aging
@CallMeShylo I've been told/ shown 13 has esoteric and occult significance
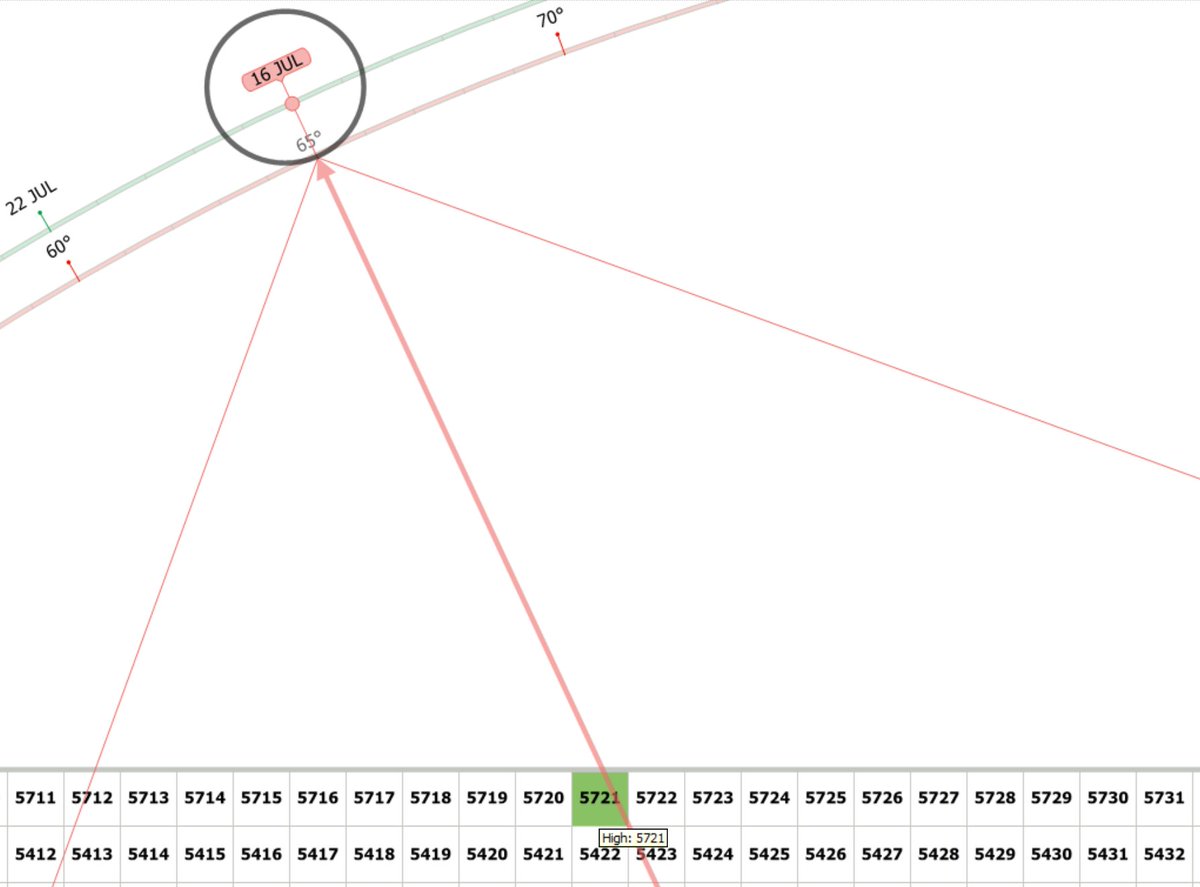
As time-symmetry graphic shows, 4/19/24 was in a sense equivalent to 10/20/1987
493 (SPY 4/19 low) is on the same angle as 1616, square 216
A reason we are seeing resistance at 585-586 🌀👁️
https://t.co/z5pyNJrrAC
@CallMeShylo I've been told/ shown 13 has esoteric and occult significance
As time-symmetry graphic shows, 4/19/24 was in a sense equivalent to 10/20/1987
493 (SPY 4/19 low) is on the same angle as 1616, square 216
A reason we are seeing resistance at 585-586 🌀👁️
https://t.co/z5pyNJrrAC
The Greal Seal, also, acts as a Luni-Solar Calendar. There is 13 Moon Cycles each YEAR or LUNAR MONTHS, which symbolize the 13 Stars. On the There are 13 steps in the pyramid which has the All-Seeing Eye above the Unfinished Pyramid which symbolizes the SUN, it is a ZODIAC WHEEL.
Historically, various capital markets have exhibited unusual volatility during the period
centered around September 21-22.
In fact, unlike most solar calendar based “cycle” dates which are man made constructs such as the well known “January Effect” or the “Year end rally” or the “Sell in May and go away” idea, or the “Off-presidential year bottom cycle” etc, the “September
21-22 WD Gann date” is based on natural phenomena, as are the “Montgomery Cycle Dates”.
This year, what may prove to be the most important Federal Reserve Open Market Committee
meeting of our lifetime, occurred on September 17 and 18. Most often, the September 21-22
cycle generates the start of accelerated downside action.
Looking back in history, we find the Gould-Fiske Gold Corner panic top for gold on September
21,1869.
On September 21, 1873, the New York Stock Exchange temporarily closed its doors due to a
banking panic.
The Dow peaked on September 19, 1902, churned for 121 days gaining just +1.16%, then
declined -37.65%.
In 1906 the Dow peaked on September 19, tested its high on October 11 (+0.61%), then
declined -45%.
The Dow Utilities, a leading stock group in the 1920’s, was the last index to peak before the great 1929 crash. It peaked on September 21, 1929.
The British Pound devalued -28% overnight on September 21, 1931.
From its September 17, 1941 high, the S&P declined -28.65% to the April 1942 low.
The S&P peaked on September 21, 1976, then declined -19.41% to its next low.
Gold peaked on September 23,1980, then declined -58.32% in 2 years.
Silver peaked on September 24, 1980, then declined -65.81% in 2 years.
Most Oil stocks, a leading group in the 1970’s, peaked on September 22, 1980.
Silver peaked on September 14, 1981, then declined -58.07% in 1 year.
Gold peaked on September 21, 1981, then declined -36.26% in 1 year.
The US Long Bond 30-Year generated its all-time low price and high yield of 15.2120%, in late
September 1981 and began an historic 40-year bull run peaking on March 9, 2020 at a yield of
0.6987%.
Oats generated a secondary peak on September 22, 1983, then declined -51.54% to April16,1986
low.
The Plaza Accord Currency collapse began on September 21, 1985.
The Lehman bankruptcy occurred on September 15, 2008, the S&P then declined -30% in 20 days
to October 10. Markets worldwide crashed for two weeks.
The market closed from September 11 to September 16 2001 in the wake of the 9-11 terror attacks.
The bottom occurred precisely on September 21 after declining -11.6% in 5 days. It then proceeded
to gain +21.40% in 72 days.
September 21, 2018. S&P 500 generated an all-time high and declined -20.21% into the December
24, 2018 Montgomery Date.
September 17, 2019. A historic and mysterious collapse occurred in the overnight repo market.
On 5th Aug, I closed ALL shorts after catching top @ 5670s right into my 5090s (#ROADMAP)
This marked major bottom 🍑 + we haven’t looked back since 🚀
In just 2 plays, I dominated entire $SPX
567 pts down/639 pts up to ATHs #UNBELIEVABLE 🤯
Was it not outlined FREE for U 🤲