Bingo. Velocity reached the target I've been warning about. Just imagine if I still had clients, and they were in cash throughout this crash.....That was my role for them first, and second was to position in leading asset classes/sectors.
Now, this is just a 1st step toward
They should report material events and financials routinely. More importantly, they should be compelled to report during market hours when liquidity is at its highest and investors have stop orders available. Instead, companies report outside regular market hours, when theoretically there is reduced liquidity and poor pricing. In truth, liquidity is exceptionally high, especially in these modern/electronic markets. Absolutely everyone should have access to stop orders. The small investor is impacted.
@RebellioMarket True, but as you know, once a trend is ripe (higher time frame 5th Wave), all will look deceptively bullish. It's like a clock 12: 59: 59 that will shortly need to reset on three different time frames back to 1:0:0. (Or counting in base 5. 😁)
Claude is now controlling TradingView live from my terminal.
Switching symbols. Writing Pine Script. Batch scanning futures. Replay trading. Drawing levels.
All autonomous. Zero clicks.
Still has rough edges but the vision is crystal clear.
I told it:
Find me every BTC futures contract with RSI below 30 and volume spike above 200%.
14 seconds later:
→ 6 contracts identified
→ Charts loaded
→ Support levels drawn
→ Pine Script backtests running
→ Entry zones marked
Didn't touch the mouse once.
Then I said:
Replay last week. Show me where your system would have entered.
It switched to replay mode. Scrolled through price action. Marked every edge. Calculated P&L in real-time.
$4,780 theoretical profit from 9 trades.
83% win rate.
Now it writes custom Pine indicators on command:
Build me a momentum oscillator that tracks whale wallet activity correlated with price.
40 seconds. Script deployed. Indicator live on chart.
Most traders are still clicking through 50 charts manually.
Claude scans 200+ in under a minute.
Finds the setups. Draws the levels. Backtests the edge. All while you watch.
This is not about replacing your strategy.
It's about executing it 100x faster.
You only need Claude + laptop + 1 hour/day.
Giving This Free for 24 hours. To get it:
1. Comment the word CLAUDE
2. Like and Retweet this post
3. Follow me @shedntcare_ (so i can DM you)
Save this post. Deploy this setup this weekend. Start testing. Scale on evidence.
80 was tagged, and produced a 43 pt rally. Was it BBL? Was it simply the prior pivot? After the rally going into the close, the trend reasserted, and there was a drop to 59 -- there's the most of the range I gave.
$NQ $ES $NDX $SPX $QQQ $SPY $TQQQ $UPRO $SOXL $SOXS
Been busy posting in a Discord (not mine, no financial interest), and warned on Wednesday of a speed ceiling, double speed failures, and completion of three cycles for this last leg up (5 waves). Gave the high and low yest, and warned to expect more weakness (timestamped entries). Can't say I traded my own stuff, because I've been busier with Codex and porting my 30 years' worth of Tradestation code to Ninja Trader --- with fancy bells and whistles I'd have taken forever to write on my own!
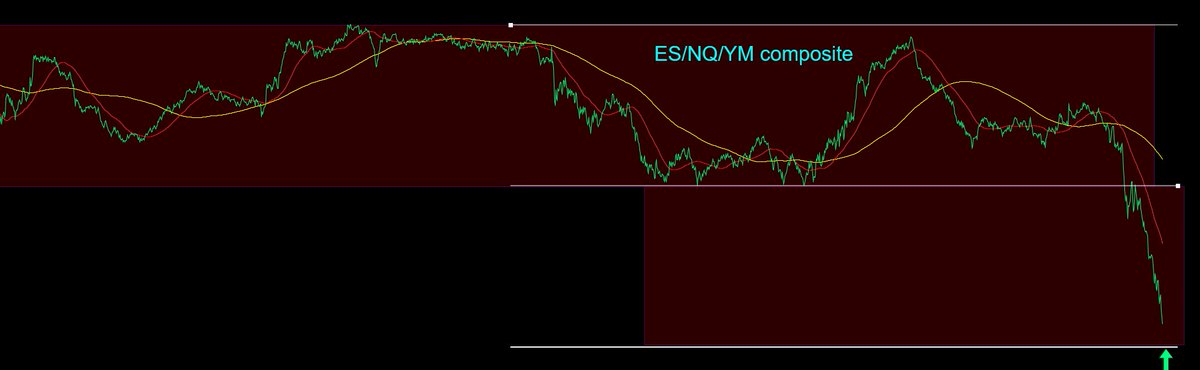
Anyway, interested in 7545 to 48. There's no shame in NOT catching the knife. There's more money made in the trend than there is the turn. (If it's a turn.)
Chart is June timeframe. My 45-48 may be too optimistic, if the composite is going to reach the target. I'll wait a little.
$NQ $ES $NDX $SPX $QQ $SPY $TQQQ $UPRO $SOXL $SOXS
The 100% target I was awaiting didn't hold. Took a stop on a small flier position. Up next at 7358-80 is the prior pivot low, and that might get speed to reset to baseline BBL.
$NQ $ES $NDX $SPX $QQQ $SPY $TQQQ $UPRO $SOXL $SOXS
One of the easiest ways to accidentally end up in a stock with a huge catalyst?
Just buy leaders... like seriously.
Every time you buy relative strength, you're putting yourself in names institutions already care about. And if the environment is rewarding, those are usually the stocks getting upgrades, earnings beats, partnerships, AI announcements, government contracts, and all the other fun stuff that sends charts into orbit.
Keep it simple.
Leaders tend to keep finding reasons to lead.
$MRVL!
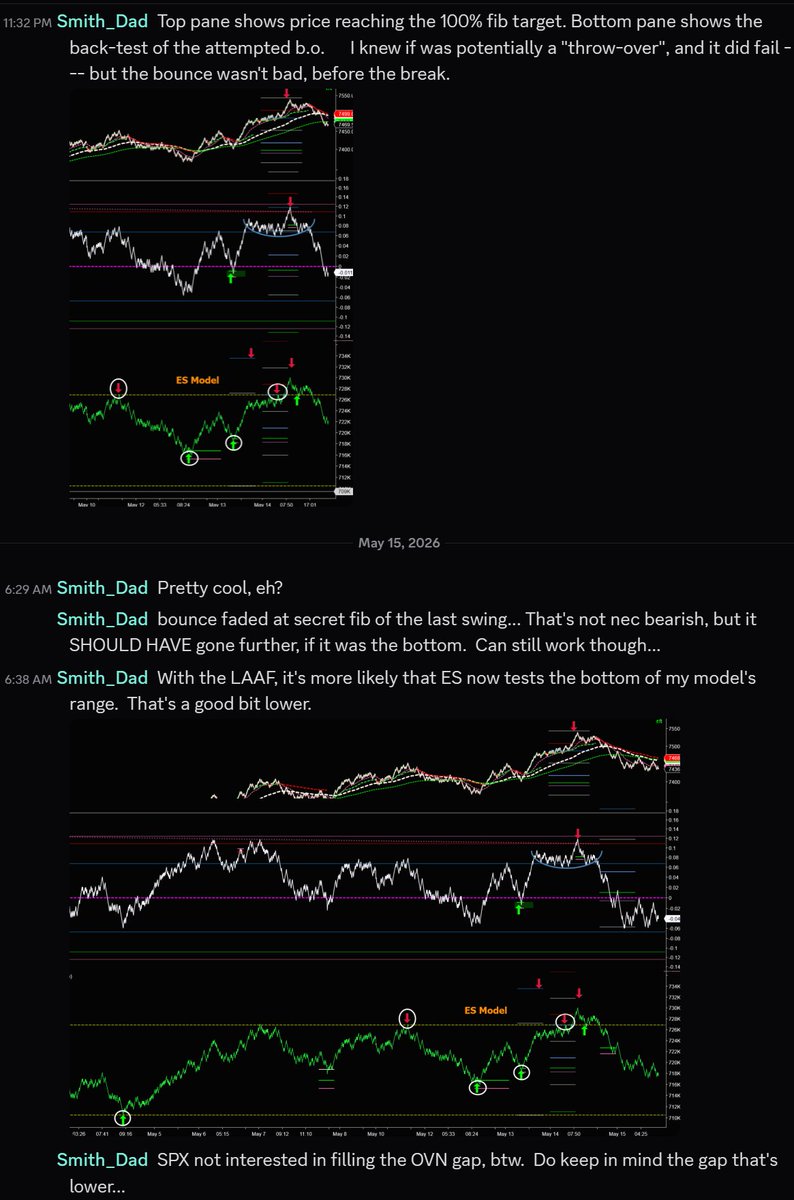
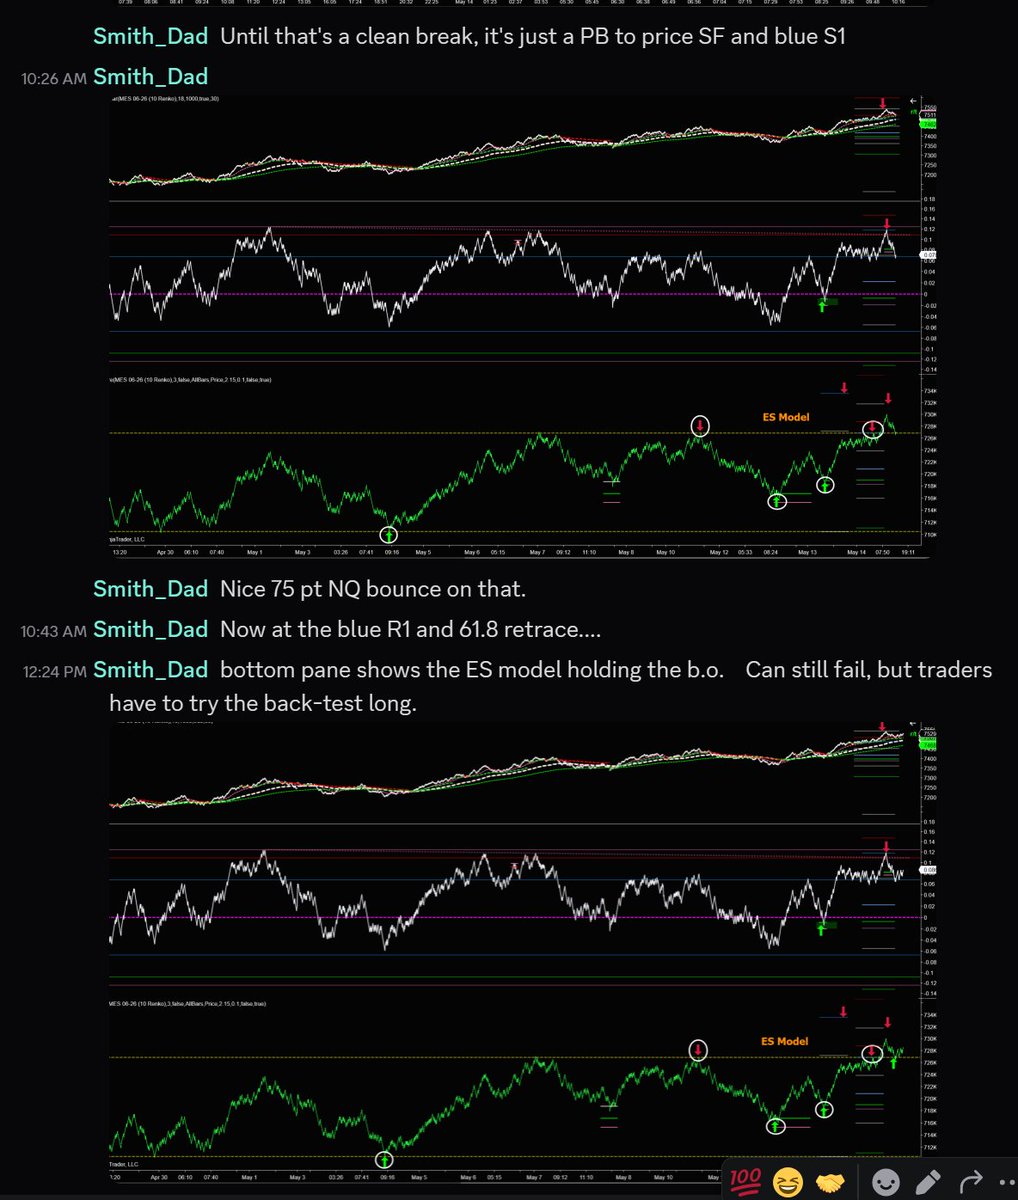
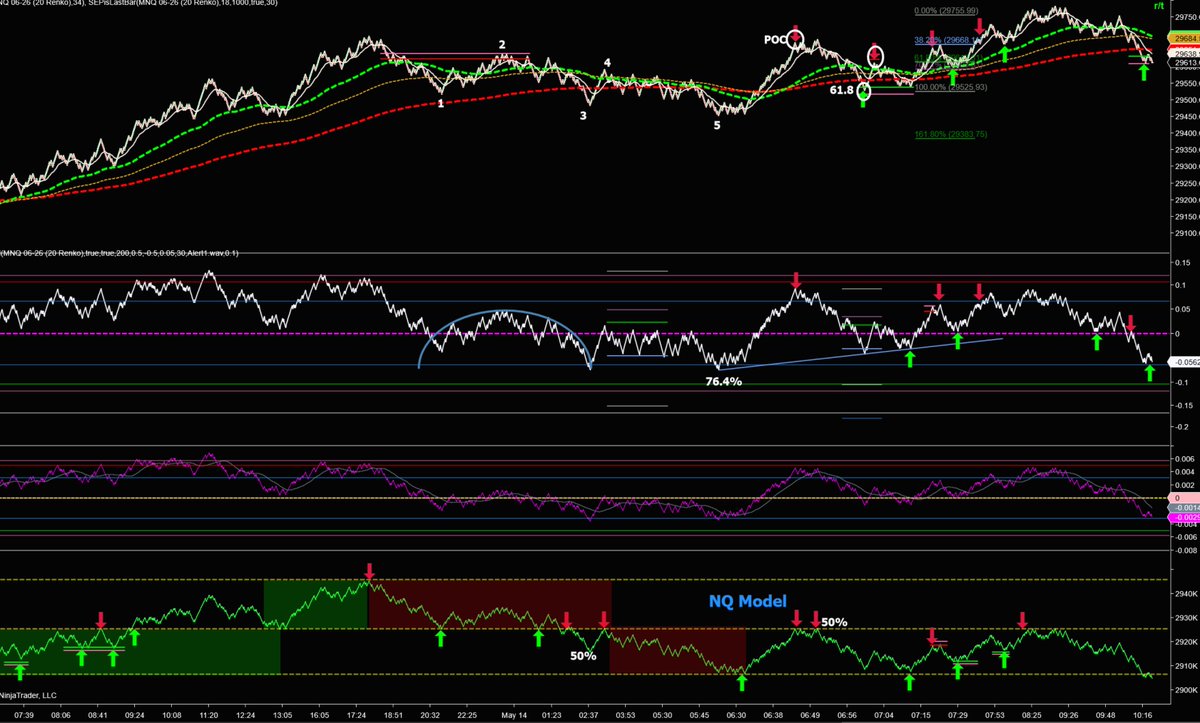
Pointed out a target reached, ensuing relative weakness in NQ vs. ES, a failed breakout (and expectation), and interim support for the current bounce.
The 5000-tick chart bounced EXACTLY on BBL, so the confluence with this 10-Renko was helpful for the current long.
$ES $NQ $SPX $NDX $SPY $QQQ $UPRO $TQQQ
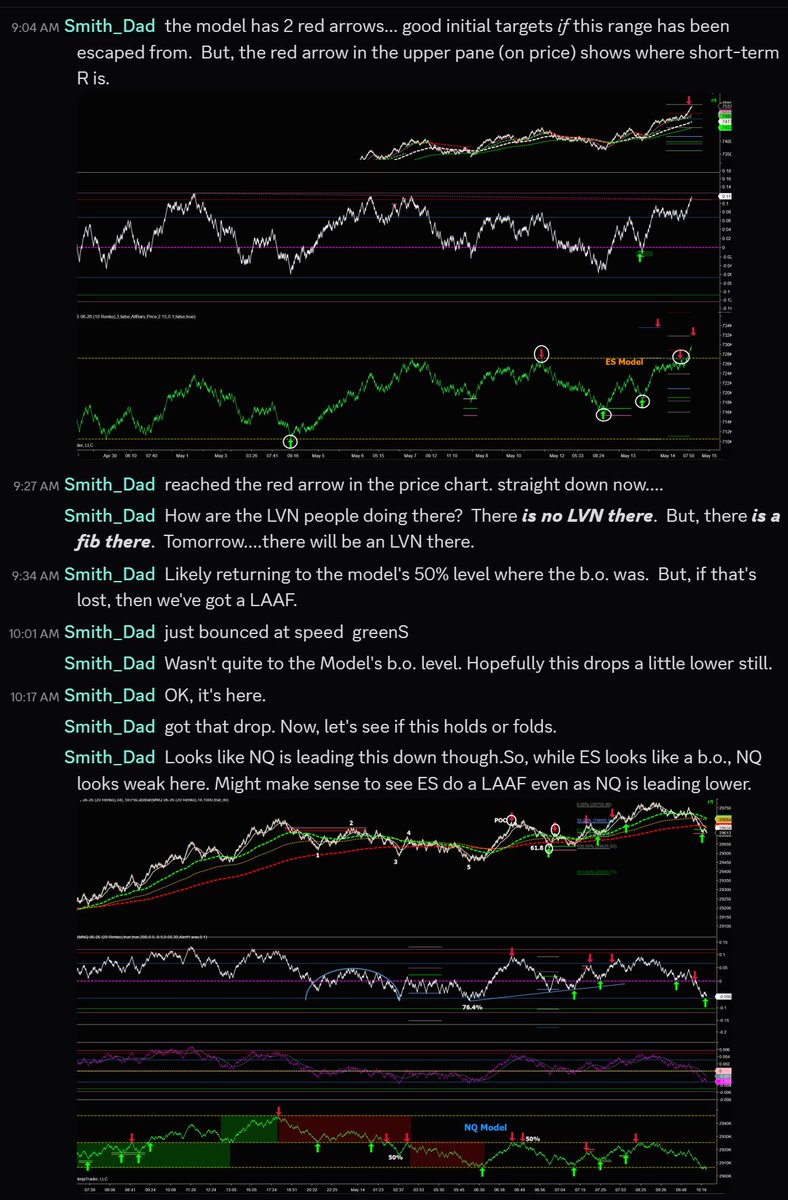
My $ES model broke through recent resistance, and has pulled back to test it. The $NQ model is threatening to drop through support, but is bouncing here. Any lower, and I'll expect more weakness.
$SPX $NDX $QQQ $SPY $TQQQ
The gap down reached where C=61.8%A. (The prior chart shows an A, but the move after B was a full 5 reversals for a C, and that ABC was a larger A fractal. The pop to the 50% was B, and the C I postulated ended up being 61.8% of the prior ABC.)
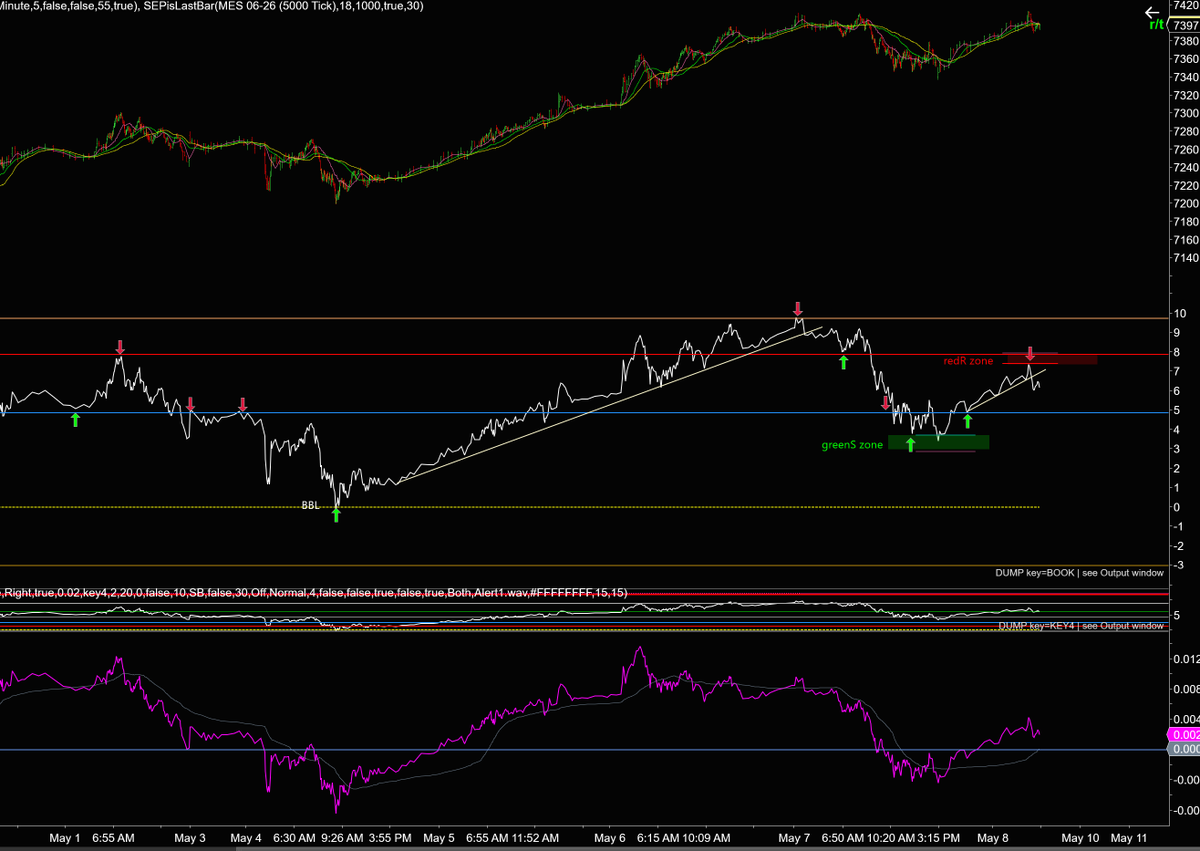
The larger timeframe shows the greenS that manifested at the low, followed by the redS -- both of which were actionable. Yesterday's timeframe had a purple speed bounce at BBL moments ago at ES 7391.50, hence the nice pop since. This is still a back-test of the failed up move, and when done, should come back down. The proper trade is the BBL long, not "should come back down". That'll reveal itself if/when....
$ES $NQ $SPX $NDX $SPY $QQQ $UPRO $TQQQ
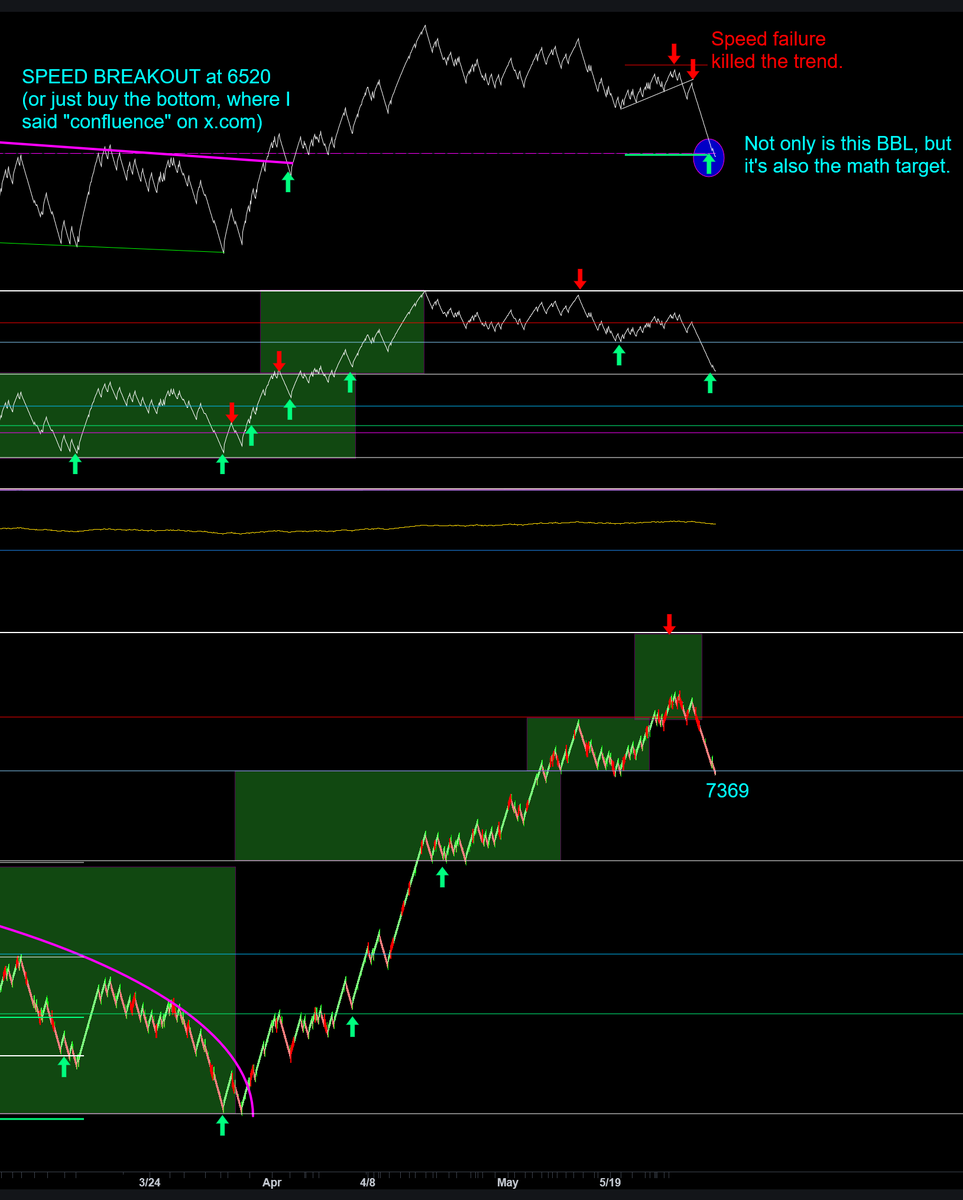
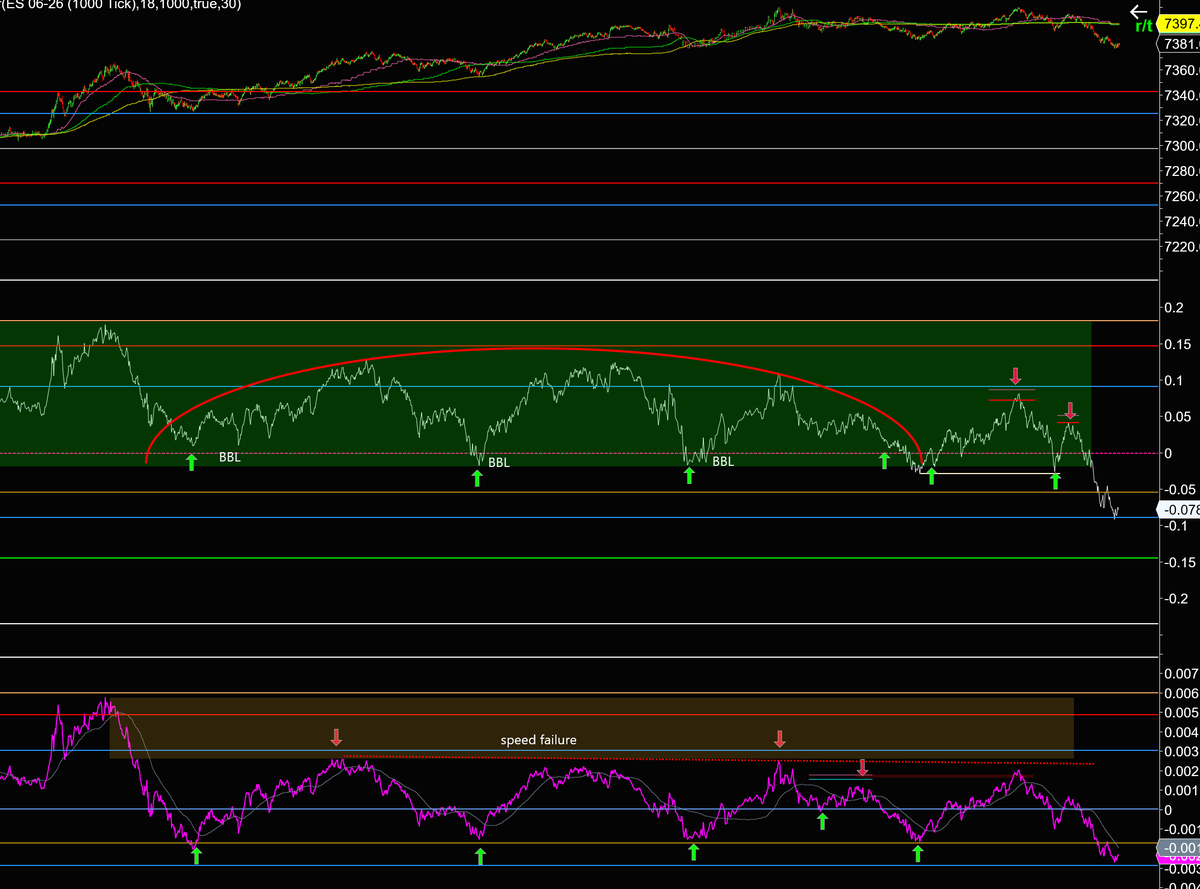
I've been bullish since the recent bottom where all manner of fib confluences met.
After a speed failure yesterday, ES is mildly correcting and has a lower speed target. I'm not expecting this to be dramatic however, but will monitor subsequent bounces for failures. Obviously, velocity has been rolling over even as price highs went still higher.
While typing, speed dropped to the green SmithBand, and I'll be looking for signs of a reversal here.
$ES $NQ $NDX $SPX $QQQ $SPY $TQQQ $SQQQ