New project in the works: https://t.co/WHkyDMMyPG for filterable shot charts of all D1 teams & players.
Works on phone/mobile layouts, filter for specific shooters, opponents, shot types, 5-man lineups, on/off queries, etc.
🧵 of a few interesting shot charts right now⬇️
@MattJHarris85 I’m not sure straight on/off splits or drtg are a fair way to evaluate a PF who played 73% of his possessions with an elite defensive center
Still think it’s a good pickup and the flashes+physical tools are undeniable. But the mental and motor concerns aren’t nothing imo
4 of the E8 teams are top 5 in OREB%, 7 of the E8 teams are top 50 in OREB%
5 of the E8 teams are top 30 in average height, 7 of the E8 teams are top 45 in average height.
6 of the E8 teams are top 30 in offensive 2PT%
6 of the E8 teams are top 50 in second chance points
5 of the E8 teams are sub 200 in offensive tempo
Only 2 of the E8 teams are top 100 in 3PA rate.
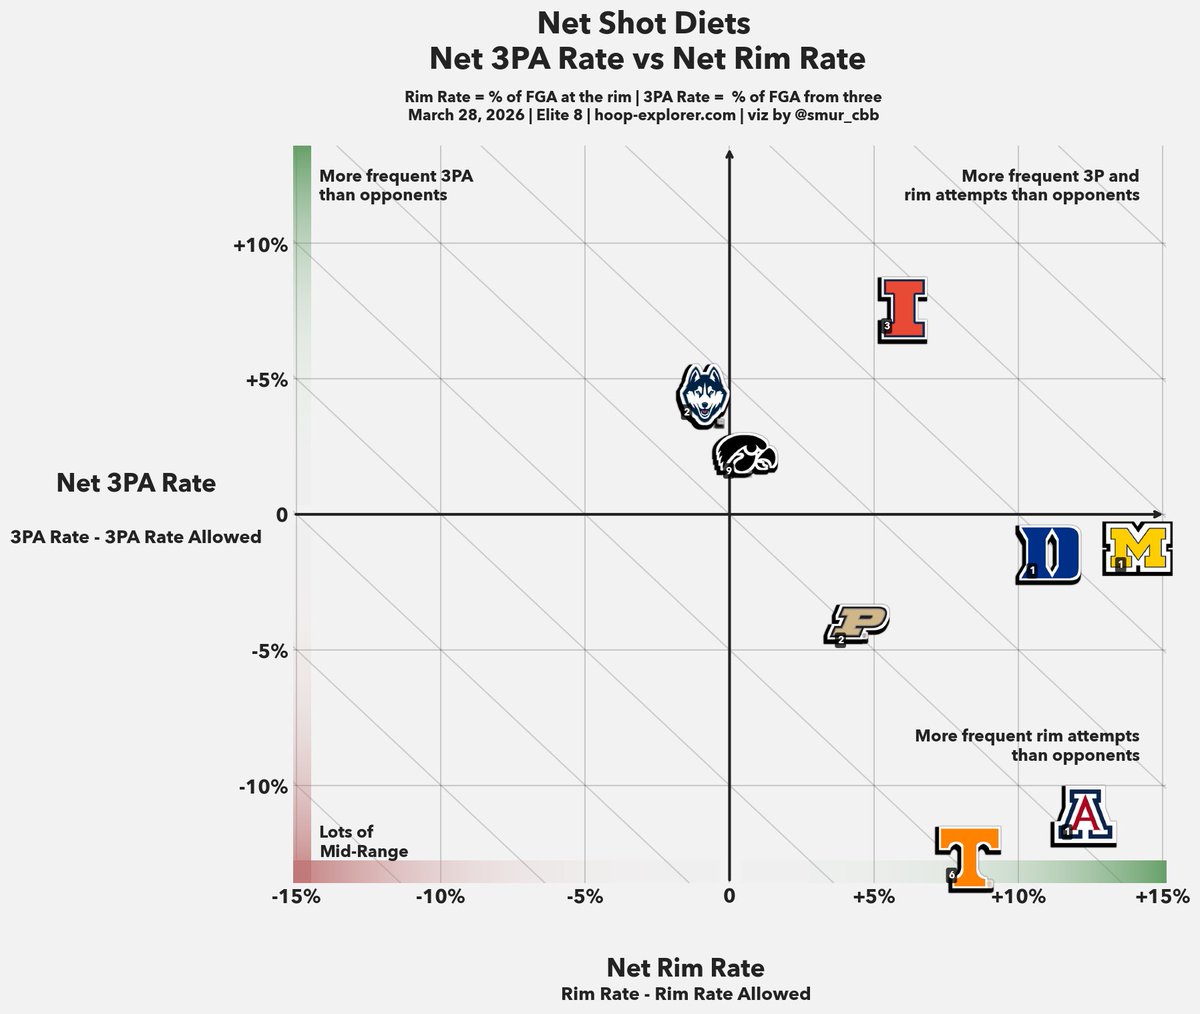
Bully ball is back.
The two-way rim dominance wave is here
Among elite 8 teams:
5/8 have +5% net rim rate or better
1/8 have +5% net 3p rate or better
7/8 have a positive net rim rate
3/8 have a positive net 3p rate
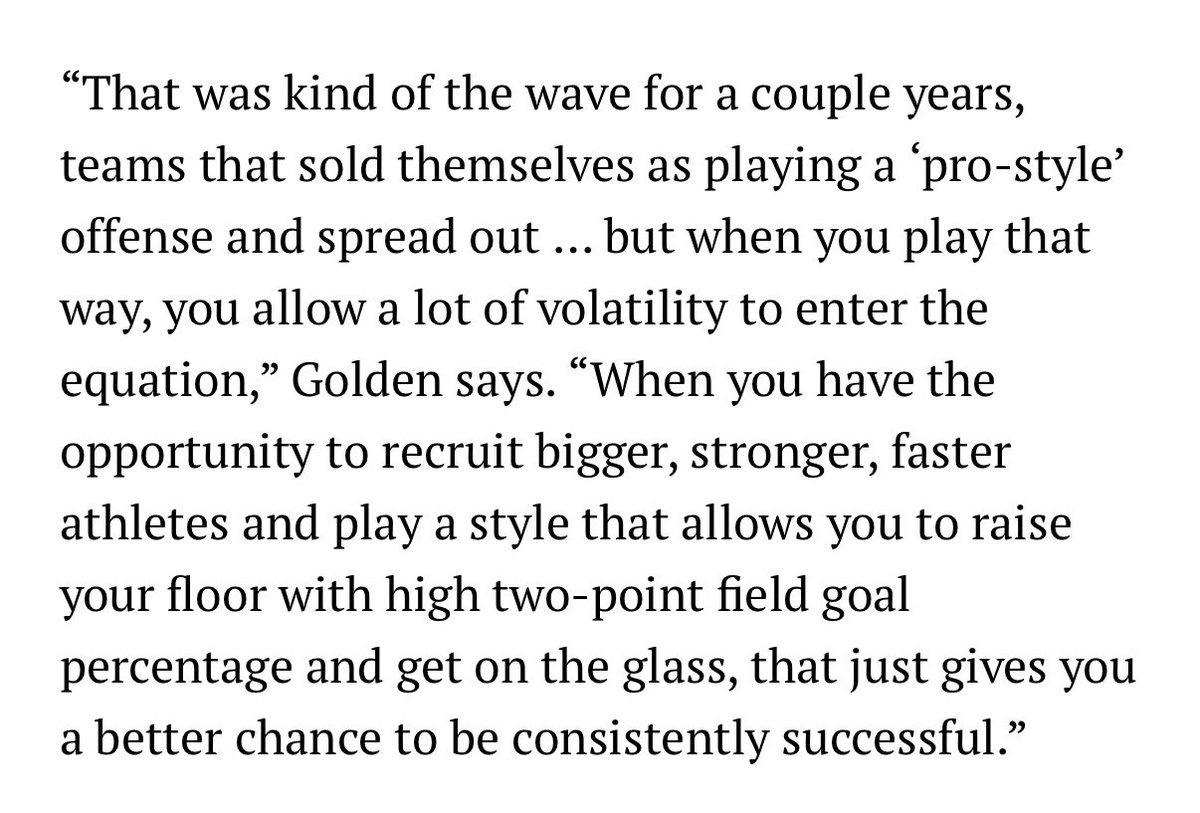
Todd Golden made an interesting point to me on the lack of upsets: Elite teams have gone from slanting towards skill + playing 5-out to going all-in on dominating at the rim. It’s a higher-floor brand of basketball and the hardest style for MMs to match:
https://t.co/ysR8UvkDSQ
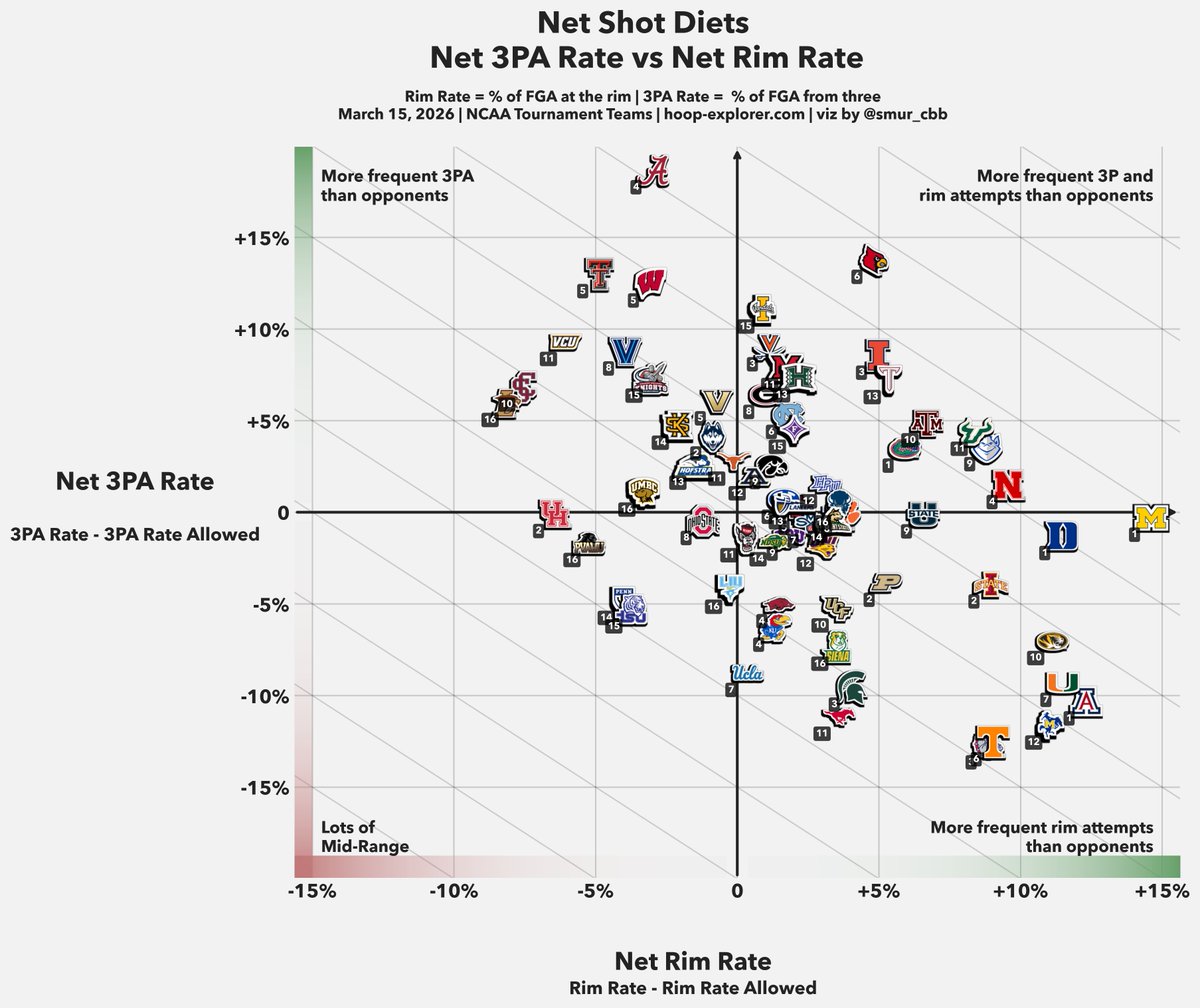
Every tournament team's shot diet relative to what they allow, from https://t.co/MYpeFpwoes
🔼 more frequent 3P attempts than opponents
▶️ more frequent rim attempts than opponents
KU is one of the few 5-seeds or higher that has negative extra poss margin:
ORB: -84
TOV: +35 (bad)
They actually won the extra possession battle against ASU (39-31), held them to 39% eFG, and still lost by 10. One of the worst shooting games by a team I can remember.
Arizona State and Kansas were a combined 22/69 (31%) inside 13 feet in yesterday's game https://t.co/WHkyDMM108
Stats on the day:
Kansas - 0.681 pts/shot
ASU - 0.780 pts/shot
Illinois has the highest Adj. ORtg in KenPom history at 131.0
However, average offensive efficiency across D1 is the highest it's ever been in the KP era. Standardizing AdjOE relative to D1 average by season, can see they're not quite the most efficient offense ever.
New project in the works: https://t.co/WHkyDMMyPG for filterable shot charts of all D1 teams & players.
Works on phone/mobile layouts, filter for specific shooters, opponents, shot types, 5-man lineups, on/off queries, etc.
🧵 of a few interesting shot charts right now⬇️
Illinois has the highest Adj. ORtg in KenPom history at 131.0
However, average offensive efficiency across D1 is the highest it's ever been in the KP era. Standardizing AdjOE relative to D1 average by season, can see they're not quite the most efficient offense ever.
1 month until Selection Sunday (March 15).
Average offensive efficiency across D1 is on pace to set a new high in the KenPom era for the 3rd straight year.
Average AdjOE has been roughly between 100 and 105 every year from 1997-2023, and is currently at 108.7 for the season.
@commish_dig Highest *adjusted* efficiency of all time. Just showed why it's not fair to compare *adjusted* efficiencies across separate seasons.
If you want to believe that this year's SMU offense would be the most efficient in the country almost every year from 2000-2010, that's fine.
This is a good point I wasn't clear on
Torvik's comment about comparing *adj* eff. across years: "part of the adjustment is tied to D1 avg eff., if offense goes up on avg, it goes up for all. So if looking for “best offense ever” should at least convert to “points above average”
@smur_cbb Controlling for the national average only shows how far above the field they are. If their offensive efficiency is the highest ever, they’re still the most efficient offense of all time.
This was the point, since D1 avg efficiency is at a high, having the highest adjOE ever may not truly reflect having the most efficient offense ever. Keeping the opponent adjustment and standardizing by season avg is a solid way to compare across years.
https://t.co/YcSp1WuiTb
It’s dodgy to compare adjusted efficiency numbers across seasons. One reason is that part of the “adjustment” is tied to D1 avg efficiency—if offense goes up on average, it goes up for all. So I f looking for “best offense ever” should at least convert to “points above average”
@commish_dig If country A has people 10’ tall and country B has people the exact same height but uses a totally different scale that says they’re 12’, you have to standardize to compare.
@commish_dig Everything you’re saying would be accurate if we were comparing RAW efficiency
Adjusted efficiency is different because it’s already relative to the average that year (BEFORE standardizing).Putting up 112 pts/100 in ‘15 will give way diff adjOE than putting up 112 pts/100 in ‘26