This Juneteenth, explore how historical slavery patterns intersected with agriculture across the U.S.
Using historical census and farming data, Social Explorer maps the lasting connections between land, labor, and freedom.
Read more: https://t.co/XKiGjMra9P
#Juneteenth #DataViz #GIS #History #Texas
Is the U.S. population aging? The data says yes – and the pace is unlike anything in American history.
We dug into the latest ACS data to map where America is aging fastest and what it means for housing, healthcare, and the workforce.
Read the full breakdown: https://t.co/651zYwjGEg
🏀📊 See the NBA Finals rivalry through a data lens.
Move from the basketball court to data analysis with Social Explorer's deep dive into the Knicks' New York City and the Spurs' San Antonio.
Link: https://t.co/GN2nSihN0U
#NBAFinals#DataViz#Demographics#CensusData
Nearly half of American renters spend more than they should on housing. To put it in perspective: North Dakota is the most affordable state with 36% of renters exceeding the rent burden threshold. We mapped the landscape in 50 states using the latest ACS data. https://t.co/uxMUgatEVo
#HousingAffordability #AffordableHousing #RentIsTooHigh #RentStruggles #AmericanCommunitySurvey
The U.S. economy has tripled since 2001 – but the growth hasn't been evenly distributed.
New analysis by Social Explorer finds that 9 of the 10 fastest-growing state economies are west of the Mississippi. Read the full breakdown on the Social Explorer blog. https://t.co/GeJWEQm46h
#EconomicData #GDP #DataVisualization #USEconomy #SocialExplorer
Which is the fastest-growing state in the country?
We dug into the latest ACS data to understand which states are growing, which are shrinking, and – more importantly – why it matters.
Get the details and explore our interactive data visualizations yourself: https://t.co/U1aramNIhk
#Demographics #Migration #USPopulation #CensusData
Where is the worst air quality in the US? The answer might surprise you. We analyzed EPA data across the US and the results paint a striking picture of regional extremes.
Curious what the air quality picture looks like in your community?
Read the full analysis on the Social Explorer blog: https://t.co/nhNUEZEDlq
#AirQuality #PublicHealth #DataVisualization #EPA #SocialExplorer #EnvironmentalData
The US housing shortage gets measured in many ways, but there's a revealing metrics that rarely makes headlines: the median age of housing stock.
We analyzed American Community Survey data across US metro areas, comparing 2005–09 figures to 2020–24. A few things stood out:
• The typical US home is now 44 years old — up from 35 in 2009
• Charleston, WV led all metros, with median housing age jumping 17 years
• Only one metro — Sioux City — actually saw its median housing age decrease
Read the full analysis (and explore the interactive map) here:
https://t.co/fz1ApZaZ5s
#HousingAffordability #RealEstate #HousingMarket #DataJournalism #AmericanCommunitySurvey
Housing costs have nearly doubled since 2009. So why has the average household size in the US fallen from 2.6 to 2.53 people? The story behind that number is more complicated than you might think. We mapped it all out. See how your state compares.
https://t.co/LMfCSx3ABy
#Demographics #HousingMarket #DataVisualization #CensusData #SocialExplorer
Your monthly electricity bill isn't just rising – it's soaring!
Recent American Community Survey data tells a striking story: The share of American households paying more than $250/month for electricity has jumped from 14.8% to nearly 21% in just a few years.
https://t.co/y9C4cXwrJM
#ElectricityBills #EnergyData #UtilityRates #CensusData #AmericanHousehold
[Data Intelligence Simplified]
We recently launched our brand-new website! A major team effort has given it a fresh look, enhanced UX, and innovative features that let you explore and visualize data like never before. Check it out: https://t.co/LmlKWtEAve
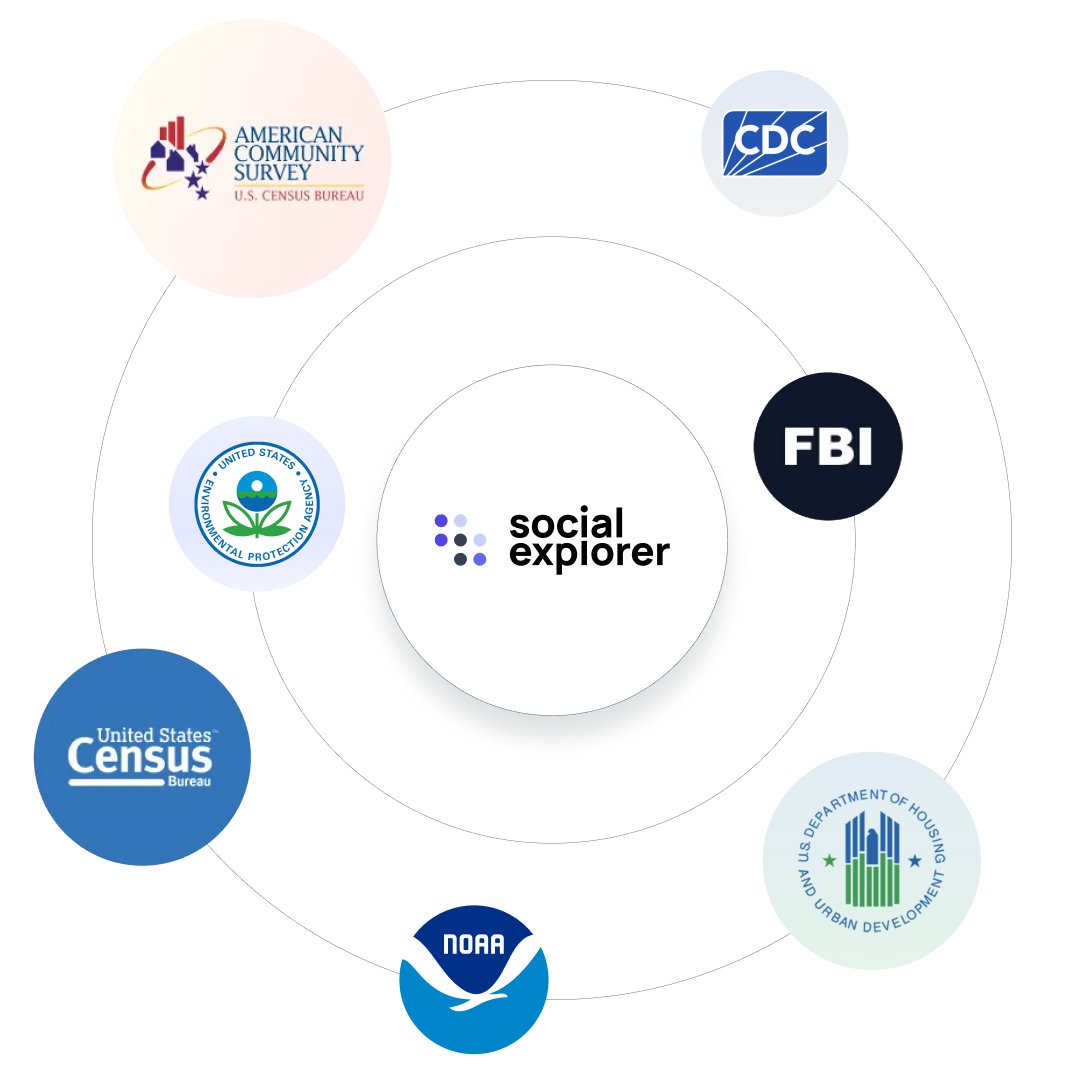
Critical federal data is vanishing–census, health, environmental records, and more. At Social Explorer, we’re rescuing & securing over 500K variables so you never lose access. Join us in safeguarding your research! https://t.co/q51OlXNzWh
How is public data used in private industries? With #APDU2024 around the corner, we're looking at how processed public data fuels innovation and growth in private industries and dive into insights on marketing strategies, product development, customer service, and more-https://t.co/ocjp62sQs3
#PublicData #DataStrategy #DataProfessionals
We are excited to introduce our new blog series, Demystifying the American Community Survey (ACS). Whether you're diving into public data for the first time or a seasoned user, our posts will walk you through interpreting ACS data step by step. Gain valuable insights with us! #ACS #PublicData #DataLiteracy
The income gap between the rich and poor widened in more than half of U.S. metro areas from 2018 to 2022.
Explore the data, trends, and what this means for our cities.
Read more here: https://t.co/rru0S838Kk
#IncomeInequality#Economics
Curious about America's financial rollercoaster ride? Our latest post dives deep into the wealth trends of the past five years.
From a soaring GDP to household incomes on the rise, the stats paint a fascinating picture.
But brace yourselves: it's not all sunshine and rainbows.
You can check the new blog by clicking on the link below: https://t.co/Dpv8cWTAZn
#LivingWage #HumanRights #SocialJustice
Social Explorer’s data, as covered in the @NYTimes, shows New York City's economy faces challenges as
lower- and middle-income residents leave, impacting the city's recovery from the pandemic. The
departure of wealthy individuals also affects the revenue base, leading to potential cuts in essential
services. Data from our recent study highlights these trends.
#NYCeconomy #IncomeInequality #COVID19
In case you’re like us and feel that a demographic analysis was missing in the discourse about #Swifties, Social Explorer created “The Swiftie Index”: https://t.co/jTONbrfK0O. In our analysis we identified U.S. counties with high concentrations of @taylorswift13 fans vis-a-vis @NFL enthusiasts. Dive into the data (or don't) with this public service. You’re welcome…? Happy Valentine's Day! #DataAnalysis #TaylorSwift #TravisKelce #Taylor #Swifties #NFL #SuperBowl
📢 Exciting news! Our Political Explorer software is driving youth voter registration 🗳️, as highlighted in this insightful article from @TheHill. Discover how our location and voter analysis tools are shaping political campaigns. #PoliticalAnalysis#YouthVote#VoterRegistration
👉 Learn more: https://t.co/ivrSoPKSLH
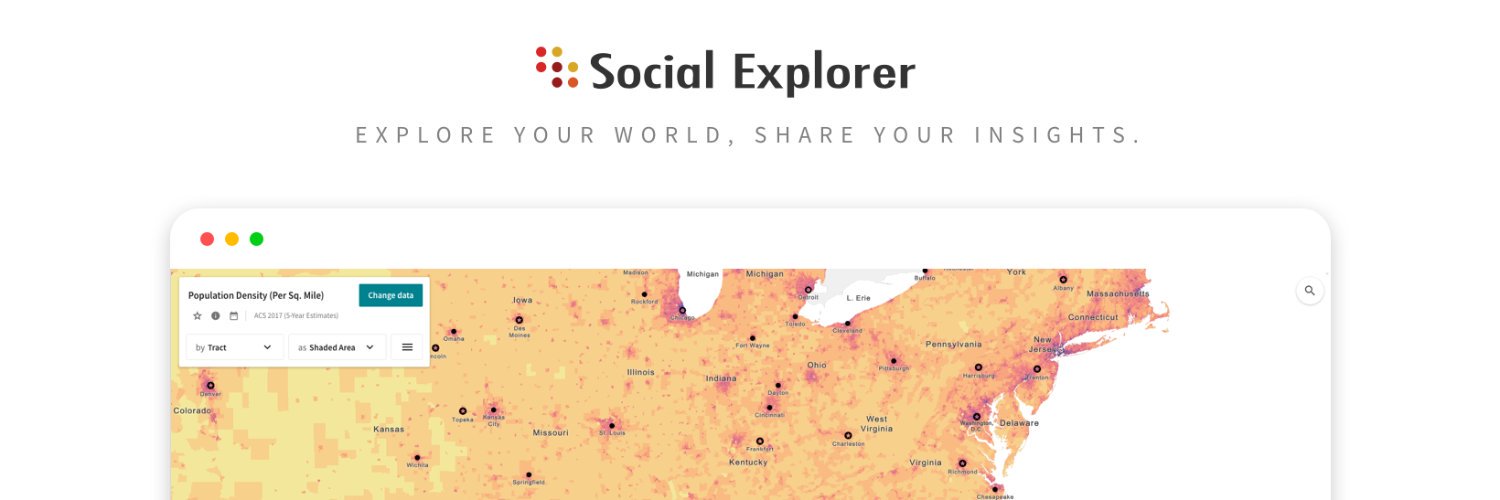


![socialexplorer's tweet photo. [Data Intelligence Simplified]
We recently launched our brand-new website! A major team effort has given it a fresh look, enhanced UX, and innovative features that let you explore and visualize data like never before. Check it out: https://t.co/LmlKWtEAve https://t.co/ffhLWUOlt1](https://pbs.twimg.com/media/Gm0eKQubAAMMEO1.jpg)