We always tell people to join data communities, but never which ones
Google can give you a list, but are they Actively?
I’m compiling a list of ACTIVE data communities.
Drop the name, focus & how to join below
Please Kindly Repost so it reaches more people!
#DataCommunity
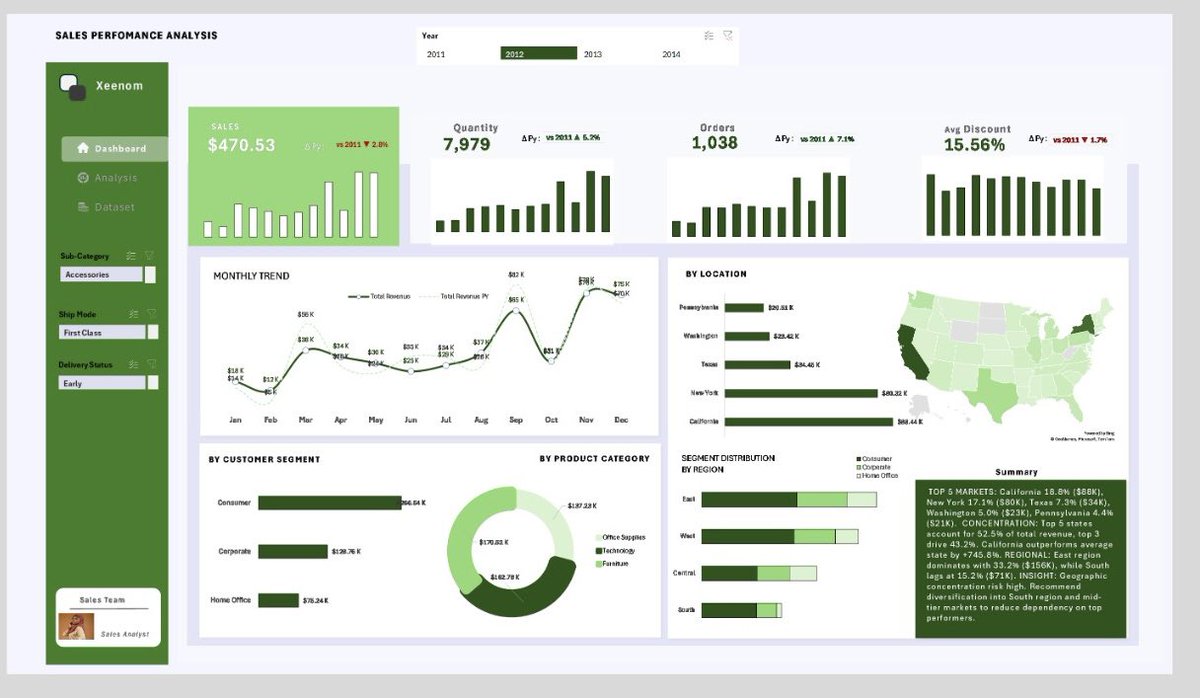
In this project I:
• Cleaned and structured the dataset
• Built KPIs using Pivot Tables and DAX in Excel
• Used the Data Model for deeper analysis
• Created a dashboard showing trends, segments, products, and locations
#DataAnalyticsLockedIn#120DaysOfDataWithTina@msexcel
Still working on my Excel Sales Dashboard.
Today I:
• Completed the dashboard layout
• Added a line chart for monthly trends
• Used a bar chart for customer segments
• Used a doughnut chart for product categories
• Formatted all visuals for clarity
#DataAnalyticsLockedIn
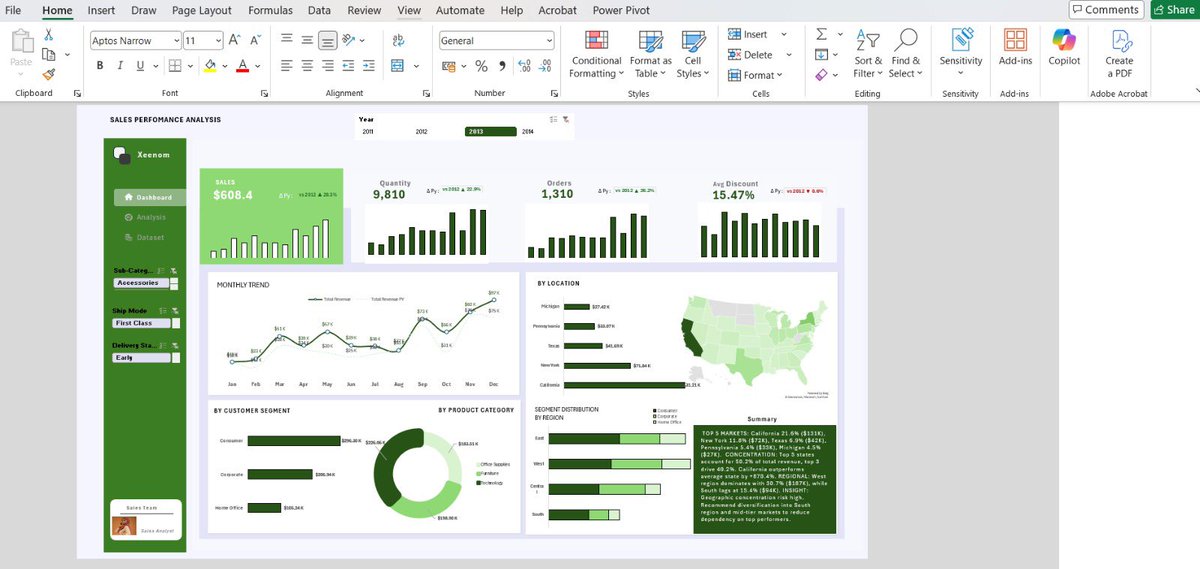
The Excel Sales Performance Dashboard is now complete.
After days of:
• cleaning the data
• calculating KPIs
• building visuals
• structuring the dashboard
The next step is documentation.
A project isn’t finished until someone else can understand the story behind it.
Calculated YoY for revenue, orders, quantity & discount
Applied conditional formatting (Green = growth, Red = decline)
Analyzed revenue by month, category, segment & state
Completed dashboard layout
Good dashboards don’t just show numbers.
#120DaysOfDataWithTina#DataLockedIn
I Worked on a Sales Performance Dashboard in Excel
Cleaned dataset
Removed unnecessary columns
Built KPIs with Pivot Tables
Wrote DAX in Excel
Created a Calendar table in the Data Model
Lesson: Don’t rush to visuals.
Get your metrics right first.
#120DaysOfDataWithTina#day8
I Created a project idea bank
Instead of thinking What tool should I use?
I asked: “What business problem can I solve with data?”
5 ideas:
Sales decline
Customer churn
Marketing ROI
Inventory issues
Employee engagement
Business-first portfolios stand out
#120DaysOfDataWithTina
Took one of my past projects and reviewed it using the analytics lifecycle.
Big lesson?
My work was technically okay
But I skipped key steps like:
clear business question
documented assumptions
actionable recommendations
evaluation + follow-up
Decisions are the finish line.
I Reviewed 2 strong data portfolios.
Big lesson?
A standout portfolio isn’t about “how many tools you know.”
It’s about:
Clear problem statement
End-to-end workflow
Clean documentation
Business insights + recommendations
Easy navigation
Clarity > complexity.
I reviewed 3 Data Analyst job descriptions to understand the gap between known and used skills.
What’s listed: SQL, Excel, Power BI/Tableau, Python, statistics.
What’s actually used most: SQL, Excel, dashboards, and communicating insights.
#120DaysOfDataWithTina
Your dashboard doesn’t need more charts. It needs more clarity.
I once saw an executive dashboard packed with metrics and visuals. The CEO opened it and closed it immediately.
Follow the 3-Metric Rule:
• Where are we? (current health)
• Where are we going? (trend)
In 6 days we launch.
Today we show you that Visibility means sharing your work as it is:
→ That dashboard you think isn’t perfect
→ The analysis that took you 3 tries
→ The lesson that finally clicked
Here, "not ready yet" is welcome.
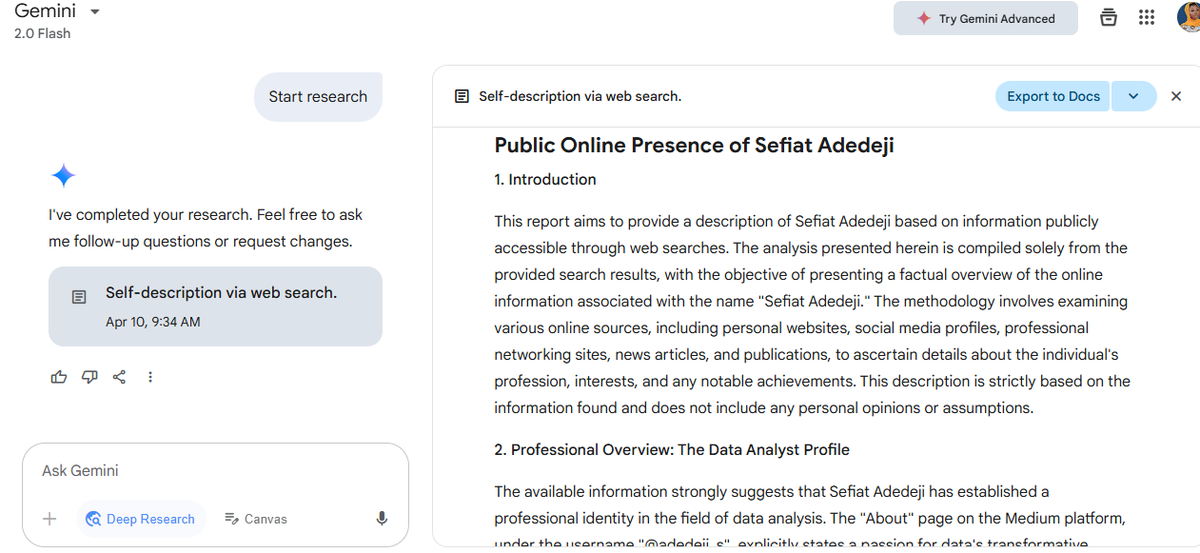
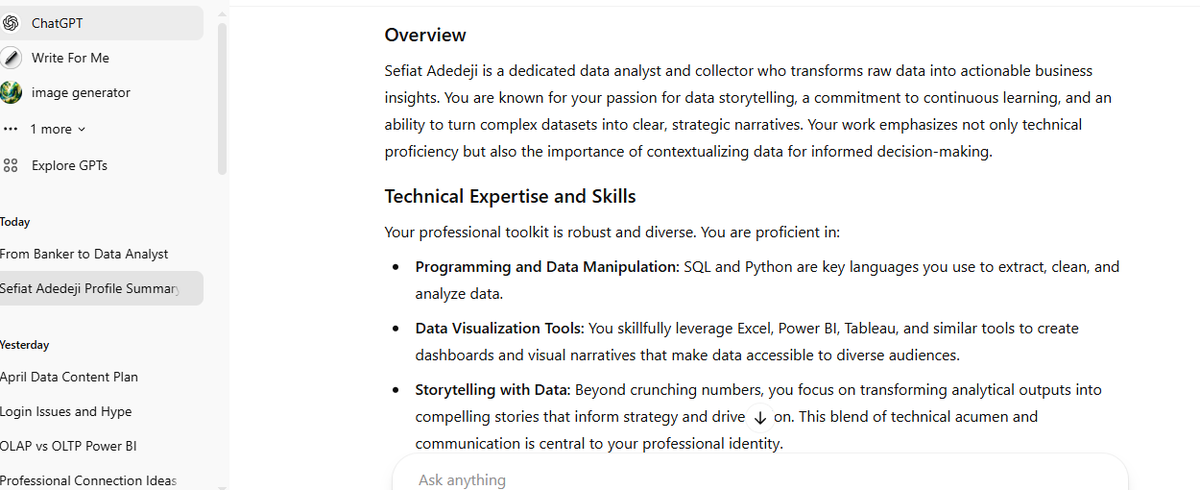
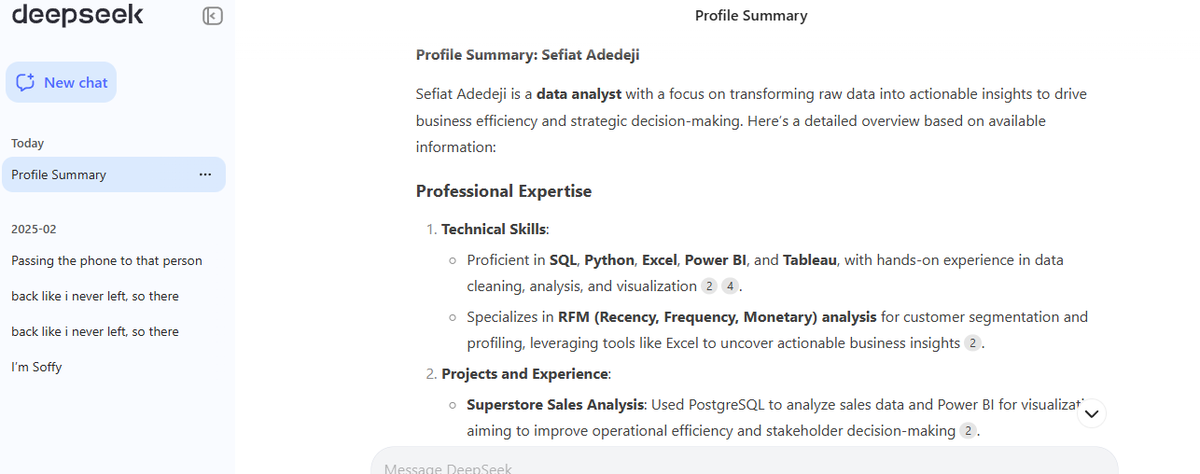
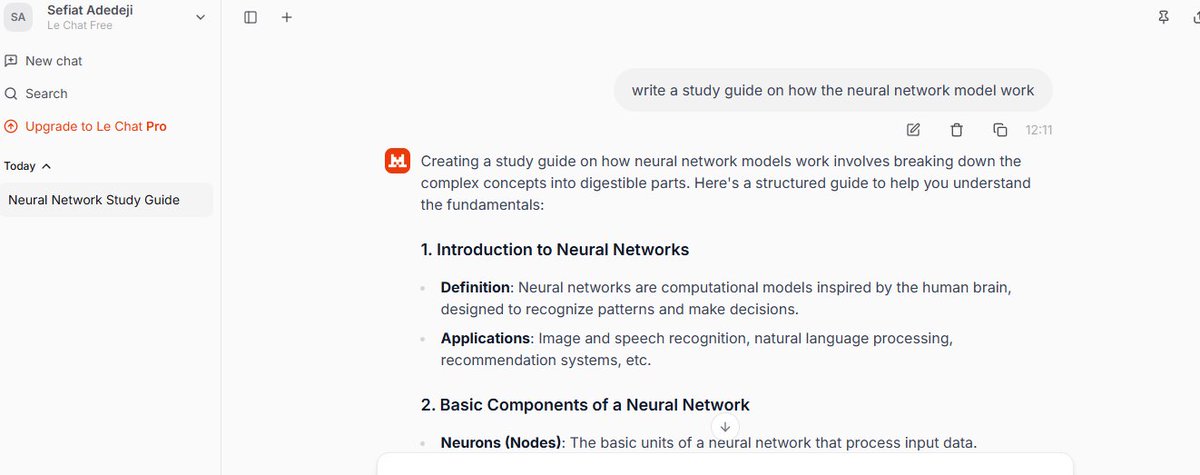
I decided to test different AI tools to see how they'd describe me, just to check their reasoning. Not bad at all! Attached are screenshots from DeepSeek, Gemini, ChatGPT, and Queen Chat. #ALX_AiSK#ALX_AI
NVIDIA Edify is a multimodal architecture for developing visual generative AI models across domains like images, 3D objects, 360 HDRi, PBR materials, and video. And in this preview by Shutterstock, you get to try out image to 3D object generation! #ALX_AiSK#ALX_AI
Le Chat is a multilingual conversational assistant developed by Mistral AI, launched in February 2024. It serves as a demonstration of Mistral’s language models, including Mistral Large, Mistral Small, and a prototype model called Mistral Next #ALX_AiSK#ALX_AI