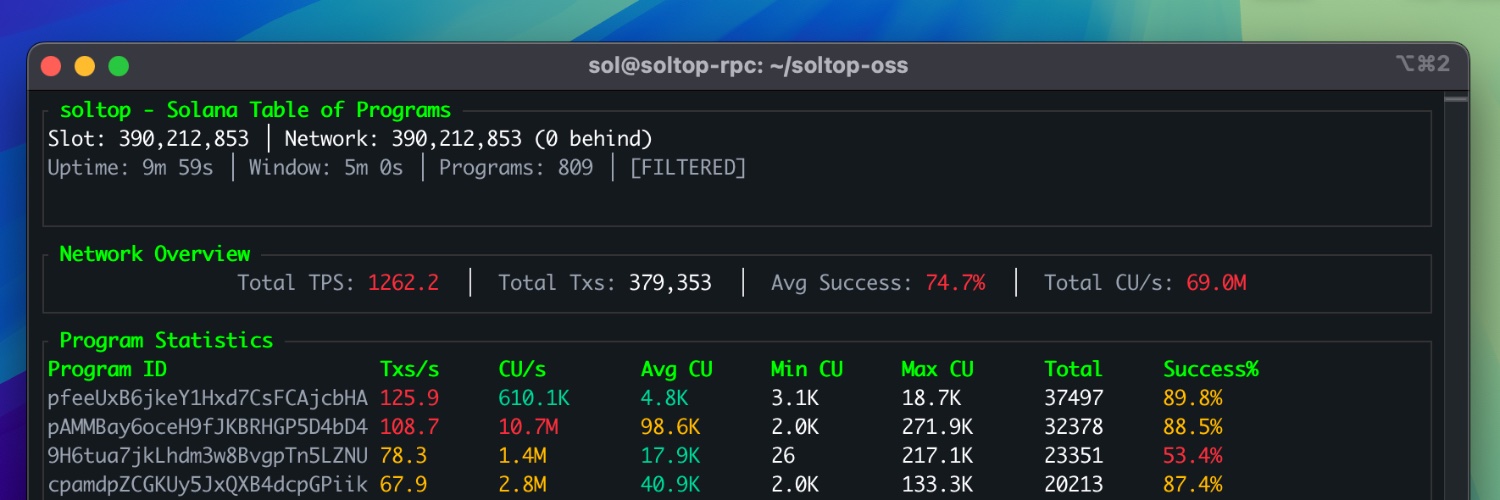
Instead of a recap thread, we’re shipping code
As a small end-of-year gift, we’re open-sourcing Soltop, a terminal UI for real-time @solana program monitoring. Think htop for Solana programs: TPS, CU/sec, success rates, live slots, all in your terminal.
Open to feedback, issues, and contributions. Happy holidays, builders 🎄
🎁 https://t.co/0jHkbX62qQ
The @DriftProtocol program currently has a lower success rate and higher CU usage on Frankendancer/Firedancer and Harmonic compared to Agave.
@DriftProtocol, is the team aware or investigating possible client-specific behavior?
Snapshot downloads shouldn't be a geography tax.
Validators in LATAM and SEA spend way too long bootstrapping because most snapshot providers are concentrated in Europe and the US.
We're now serving public snapshots via Cloudflare CDN: full + incremental, refreshed every 12h, free for anyone.
Small infra, real impact. Learn more at: https://t.co/IQBp3u1Fh2
The observability gap is real. Most teams only see success/fail in their logs. But understanding program behavior under load, that's the difference between shipping fast and shipping production-ready.
With the surge of institutional RWA tokenization on Solana (WisdomTree funds, Matrixdock's XAUm, Ondo's 200+ tokenized stocks), there's a crucial question builders should be asking:
How do you monitor program behavior when institutional capital is on the line?
Traditional finance runs on 99.99% uptime SLAs. When tokenized gold or stock trades fail on-chain, institutions need answers:
• Was it a program bug or network congestion?
• Which compute units were consumed vs wasted?
• Did failure rates spike during that block?
> Get a list of all the people robbing you blind.
> Detect backruns and frontrun activity per PoH tick for different pools
> Analyze any wallet and all its transactions through visual graphs
> Study write locks contentions on any account
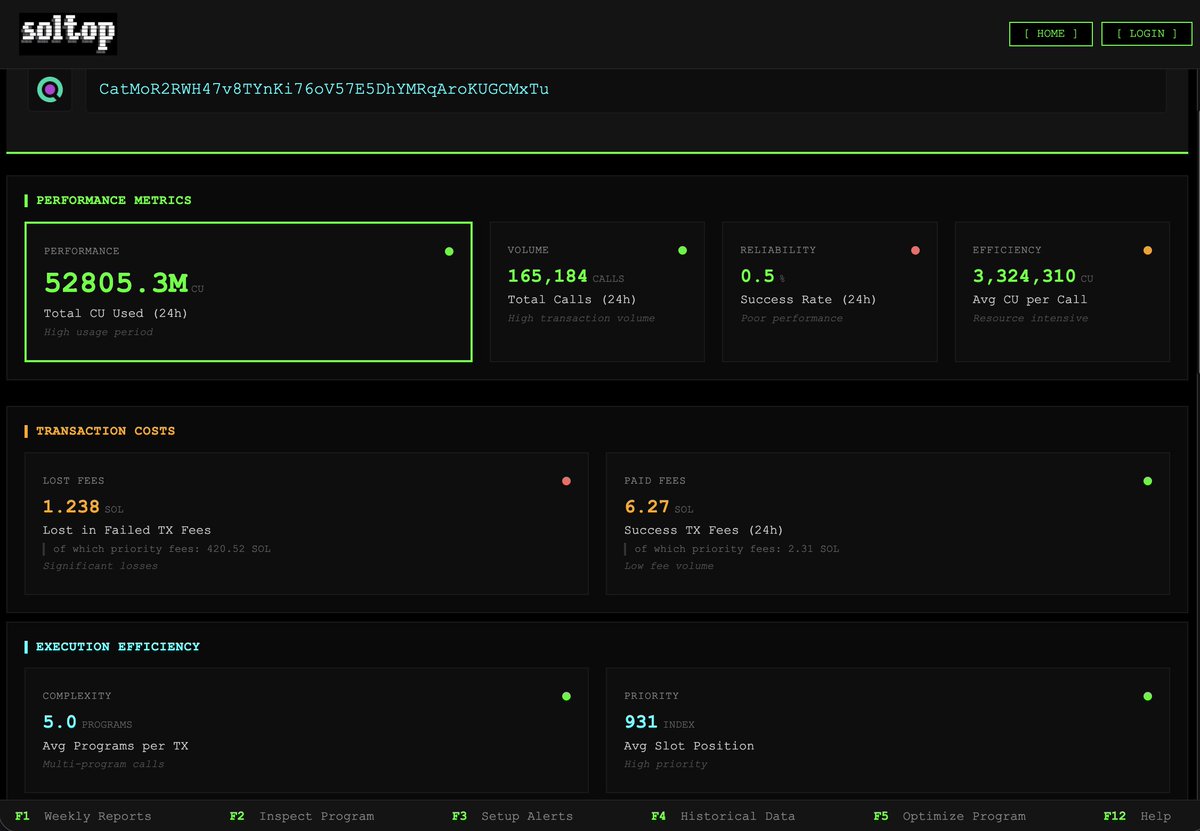
We’re excited to roll out Blockline, built by @soltop_sh - exclusively for our Pro plan users.
Is this a misconfigured bot? A buggy smart contract? Or is someone intentionally burning resources?
This program ranks dead last in efficiency with a score of 507.1, meaning it burns ~66 million compute units per successful transaction. For context: The most efficient programs on Solana average 28-400 CU per success. This program is consuming 268,000x more compute per success than the best performers.
What's happening?
The co-program analysis shows this program primarily interacts with Token programs, suggesting it's likely a trading/swap application. With 99.6% of transactions failing, something is fundamentally broken, whether it's slippage settings, timing logic, or compute budget allocation.
When debugging performance issues in your programs, what do you wish you could see that current tools don't show you?
We're constantly thinking about what observability gaps exist in the Solana ecosystem. Metrics like compute usage and failure rates are a start, but the most valuable insights often come from understanding why programs behave the way they do under load.
When you're diagnosing program failures in production, what's your first metric to check?
We've noticed builders often start with transaction success rates, but the most revealing signal is usually compute unit consumption patterns across failed vs successful txs.
A program hitting CU limits might show 20% failures - but dig deeper and you'll often find those failures cluster around specific instruction combinations or account states.
What's your go-to debugging approach? Do you start with logs, metrics, or simulation?
@Pumpfun 's AMM consumed 1.67 trillion compute units in the last 24 hours. More than any other program on Solana.
38.5 million transactions. 89.9% success rate.
But here's what the metrics reveal: traders paid 293 SOL in failed transaction fees yesterday. That's 17% overhead on top of the 1,459 SOL paid in successful fees.
When program-level observability becomes routine, we stop guessing and start understanding where the real costs are.
https://t.co/LgTHVKDnRm
Instead of a recap thread, we’re shipping code
As a small end-of-year gift, we’re open-sourcing Soltop, a terminal UI for real-time @solana program monitoring. Think htop for Solana programs: TPS, CU/sec, success rates, live slots, all in your terminal.
Open to feedback, issues, and contributions. Happy holidays, builders 🎄
🎁 https://t.co/0jHkbX62qQ
Solana has incredible performance, but program-level observability still feels underexposed.
Isn’t it time we treat program monitoring as first-class infra, @toly?
Quick peek at how the open-source Soltop is shaping up 👀
Still early, but the core pieces are coming together nicely. Feels like the kind of tooling @solana programs have been missing. Curious what you think, @toly.
More soon.