When I first began my crypto journey, it was because I stumbled upon the hype surrounding NFT projects while surfing Twitter
The idea of trading digital pictures on the internet fascinated me, and the demand for whitelists was enormous
As a beginner, I made mistakes and fell for a few "rug pulls" while also being influenced by the wrong crowds on Twitter and Discord.
Over the years, I've learned to read the market and understand the hype better
But the most valuable lesson I've gained is the importance of surrounding yourself with like-minded individuals who share your goals
Good people provide reliable information, which can be a crucial advantage in the market.
So clearing up your timeline and Discord channels can help you better funnel the information you receive
This can be overwhelming at times, but it's essential to stay informed and ahead of the curve
I follow a select group of people in the crypto space who have proven to be reliable sources of information
These individuals are smart, hardworking, and dedicated to their craft;
• @gumsays news, defi mastermind, statistic, a chad, and well connected in solana space
• @wronguser000 if you are into farmings, trading inefficiency in the market, trying new stuff
• @0xnouveau farmings, trading god, a great information on how to do things
• @0xMubeenn very good trader, know how to move things around, give a very good advice
• @khurrylicious concentrated gambler, very good trader in his own right
• @Pickle_cRypto recently found his account as a fellow @GummiesART , but I can tell he will have bigger followers soon
• @Notfgod if you are into trading, getting a great insight on how to bot (he shares all these things, hard to find CT account that will share it)
• @CryptoCred learning trading? this is the way to go, he also have a weekly views on the market on youtube
By following their advice and insights, I've been able to develop my own strategies and grow in the crypto world
I will keep adding people to this thread, so if you want to, bookmark this tweet
Don't forget to leave a like and repost if you feel this help you in anyway
if you want to learn supply and demand trading, i have a full course on @krakenpro's youtube channel from beginner to advanced
some people charge thousands for this but for you it is free. i really don't think you can learn price action from many better people than me on here. i've been doing it for nearly 12 years
in this video series, i teach a lot of nuance that i've gained from experience, not just the cliche stuff you can find online
the feedback i have had so far is that people are finally finding the missing pieces of the puzzle that they struggled with
check the episodes out here and make sure to bookmark this post
episode 1
introduction to price action trading
https://t.co/nJaivDmD3K
episode 2
creating a trading strategy
https://t.co/dLWaNjdSgV
episode 3
using nuance for better results
https://t.co/JyG1MCXHBm
episode 4
advanced price action lessons
https://t.co/Z5GkvZWzhi
episode 5
putting everything together
https://t.co/8dyqVBaueA
hope you enjoy!
Beginner's guide to Supply & Demand: 👇
1. The larger the move away -> The better
2. HTF zones > LTF zones|
3. Fast moves during the retest -> The Better
4. Refine execution w/ Orderflow (Absorption)
5. Clusters > Individual Candles
Start doing chart write-ups. It will significantly help you when trading live.
Your brain will start to piece those previously reviewed structures with current pa.
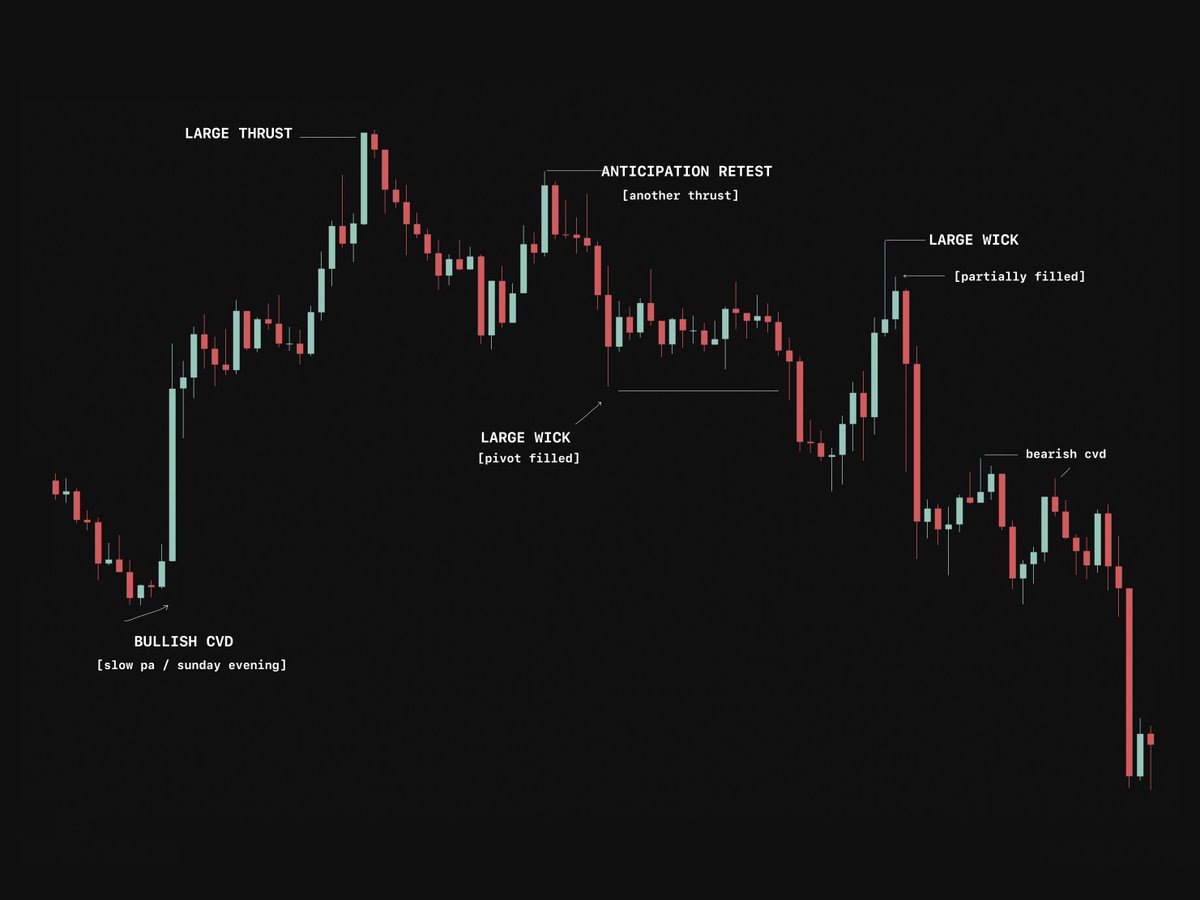
In particular the biggest moves/pivots of the week.
watch this clip of haaland
that’s how you should trade to actually make money, preserve capital, energy and time
relax and chill
when the ball comes to you, score
if you're confused with how to draw supply and demand zones, this is how i do it
i've only been doing it for 11 years 😜
full stream for more:
x: https://t.co/eBCicplfca
yt: https://t.co/zzZgGNTE0b
Nice to wrap up another profitable quarter.
Q4 was exceptional. I barely traded in Q1, and Q2 has been another strong period.
On my crypto perps account I started in September 2025* is now up around 72%, with a maximum peak-to-trough drawdown of 11%.
Its not flashy, but steady honest work, me against myself... earning the right to scale up the account size.
There are periods where it's more valuable to step away from the screens, appreciate the account growth, and focus on refining the process rather than forcing trades. Some of the biggest improvements come from taking a step back, and Q3 is another opportunity to do some of the deeper internal work which many neglect.
The 11% drawdown is the one metric I'm not entirely satisfied with, although it was largely a result of deliberately increasing size around higher-timeframe inflection points. Those multi-week swing opportunities naturally produce a different risk profile to my shorter-term intraweek rotational trading where I risk below 1%. By comparison, Q4's maximum drawdown was just over 3%.
Over the past few months I've identified several additional execution filters that should improve a couple of my strategies, while reducing my overall playbook to just five. Fewer strategies. Better execution.
One thing I've said for a some time now is that a strategy and its execution are two key components in the game of trading.
Anyone can define a playbook of setups. The real edge lies in how those setups are executed, entries, sizing, scaling, risk management, exits, and equally important, knowing when not to trade. Those subtleties are where variance is reduced and consistency is built vs how much asymmetry you're giving away due to poor execution
The next stage of my own development is moving towards a more hybrid approach.
I still want discretionary judgement around execution, but trade selection, position management and profit-taking will become increasingly systematic and where possible, automated. Dynamic stop management is an area I'm particularly interested in developing further.
Another habit I've adopted is periodically resetting both my journal and my datasets. Markets evolve, and historical data gradually loses relevance as your process changes. Every meaningful refinement should be measured going forward, not against a static snapshot from years ago.
I've never been a fan of most off-the-shelf trading journals. They tend to collect data without producing meaningful insight.
Building your own framework forces you to ask better questions, track the metrics that actually matter, and develop a far deeper understanding of your own decision-making process - partially thanks to claude code, codex (quite fun tbh).
Looking back over the last year, I'm pleased with the returns. But more importantly, the process feels increasingly repeatable. I understand my own game better than I ever have, and that gives me far more confidence than any individual quarter's P&L.
Ultimately the reminder is - one bad trade is all it takes to undo soo much of the hard work - I refuse to let that happen.... Survival is everything as is being a good loser.
I think this is the best writeup on $BB out there.
Although, some of the price targets are a bit optimistic. The read is quite long, but it's worth it as it goes into every detail of the business and it's growth.
It is also a lot of research that we've already shared, just better organized. But why I see BB has having huge upside over a several year period.
You can't borrow conviction, but i think the read will help you truly understand the thesis and potential
levels which accelerate price
> vwap
> range boundaries
> swing highs/lows
> significant S/R levels
> last low/high before gap
> round numbers/psych levels
liquidity clusters there, so any imbalance accelerate price.
> tp/sl orders
> liquidations
> oi unwinds
> breakout entries
If I'm holding a position,I'm looking to add before that burst of momentum.
$BTC How to Spot Trapped Traders with Speed and Precision 🎯
To identify trapped traders accurately, we can use a powerful combination: the Delta Profile overlaid with Open Interest (OI) Created vs. Removed.
Let’s break down exactly how this works using a recent session Point of Control (POC) as an example 👇
1. The Context (Volume Profile)
Looking at the standard Volume Profile and candlesticks on the left, we can identify a High Volume Node (HVN/POC) neer the current lows, where price was ultimately rejected. However, traditional volume alone doesn't tell us whether buyers or sellers dominated the auction at that specific level.
2. The Aggression (Bid/Ask Profile)
To see who is initiating the trades, we look at the Bid x Ask Profile on the right. This splits the traded volume into aggressive selling (red) and aggressive buying (blue). A spike on the aggressive sell side tells us the HVN was created by market sellers dumping into the bids. Because price didn't drop further, we instantly know a passive buyer is absorbing the selling pressure.
3. The Intent (Delta Profile + Open Interest)
At this stage, we know there is aggressive selling, but we don't know if it's new shorts opening or existing longs closing. This distinction is critical: closing longs are simply exiting the market, but fresh shorts represent new capital that will eventually have to buy back to cover if they are wrong. To find out, we look at the Footprint chart:
- Delta Profile: Visualizes the net difference between Bid and Ask. A large negative (red) delta confirms market sellers dominated.
- Open Interest (OI) Text: Measures contracts closed vs. opened.
By overlaying OI text onto the Delta Profile, the full picture emerges. At the HVN we see a high negative delta paired with 9.5M new contracts opened.
Now have concrete proof: these aren't just exiting longs, these are fresh shorts getting trapped. They sold aggressively at the lows, got absorbed by passive buyers, and were not rewarded with lower prices.
When the market pushes these trapped shorts offside, they are forced to close their losing positions by buying at the market. This creates a highly predictable cascade of buying pressure that you can trade alongside.
Chart by @ExochartsC
people can spend the better part of a year trying to call bottom on something, just to see it continue to make a new low for the duration of that period, over and over. Same with trying to call the stock market top repeatedly.
what have we don't this year? We have completely avoided assets in downtrends, and traded ones in uptrends. The rewards are that we will eventually get to buy the ones in downtrends when the market structure changes. without having been exposed to all the downside.
charts that are winners, tend to keep being winners, and losers, tend to keep being losers. and only stop being one when market structure actually breaks. LH + LL. or HH + HL
Sometimes, things for the most part are really that simple. Its stupid, but its simple. The trend is your friend.
Obviously you can do this on lower time frames with MA's and have little downtrends inside the uptrend and vice versa without breaking the larger market structure and trend.
But what really matters is just catching 70-80% of the move. So if you're starting out trading. Simple market structure is probably one of the best places to start. You don't need a single indicator either.
I am trying to dumb it down as much as possible bc there's a lot of new followers lately. But you'd be surprised how many people try to be contrarian about everything, and as a result miss the moves or cost themselves money, time, and opportunity
A few things from today. The next decade is the super cycle. Same disclaimer as always. it will be volatile, it will be so over and we are so back many times. But ultimately, this is over a decade period. going to be the larget bubble in human history.
Japan committing multiple trillions to the AI buildout over the next decade. Other govs will do the same.
We are going to see more robots than humans 10 years from now. The robot buildout hasn't even started. These companies aren't even public yet. Robots are solving for the 59T labor problem that exists today. Avg hourly wage is around $38, robots can get the job done for under $3-4 over its lifetime.
There is still a huge energy need, the AI buildout isnt complete. It also is going to take years
We are going to see rapid advancements in medicine as a result of AI. Speeding up time to market, research, and finding new cures.
There are going to be many bubbles, and side bubbles inside the broader bubble and super cycle.
Many traders have been asking about my personal settings for the Price Data & Time Grids indicator. 📊
You can find the exact $BTC settings in the comments of this post! 👇
Whether you are a day trader or a swing trader, you need to watch the price levels. The options market always dominates the flow!
This is exactly why my Price Data & Time Grids indicator isn't just a tool. It's an absolute essential for your charts.
https://t.co/OGoCABpiTA