🎉 25K SPECIAL MILESTONE! ❤️
To celebrate our 25K followers milestone, we’re sharing something useful with you! 🚀
🎁 A FREE SCREENER CHART INK — as a small thank-you for your love and support.
Because we believe in spotting opportunities early, before the crowd notices them.
👇👇👇
https://t.co/9Oa1lV6l08
Thank you for being part of this journey! ❤️🙏
#25K #StockMarket
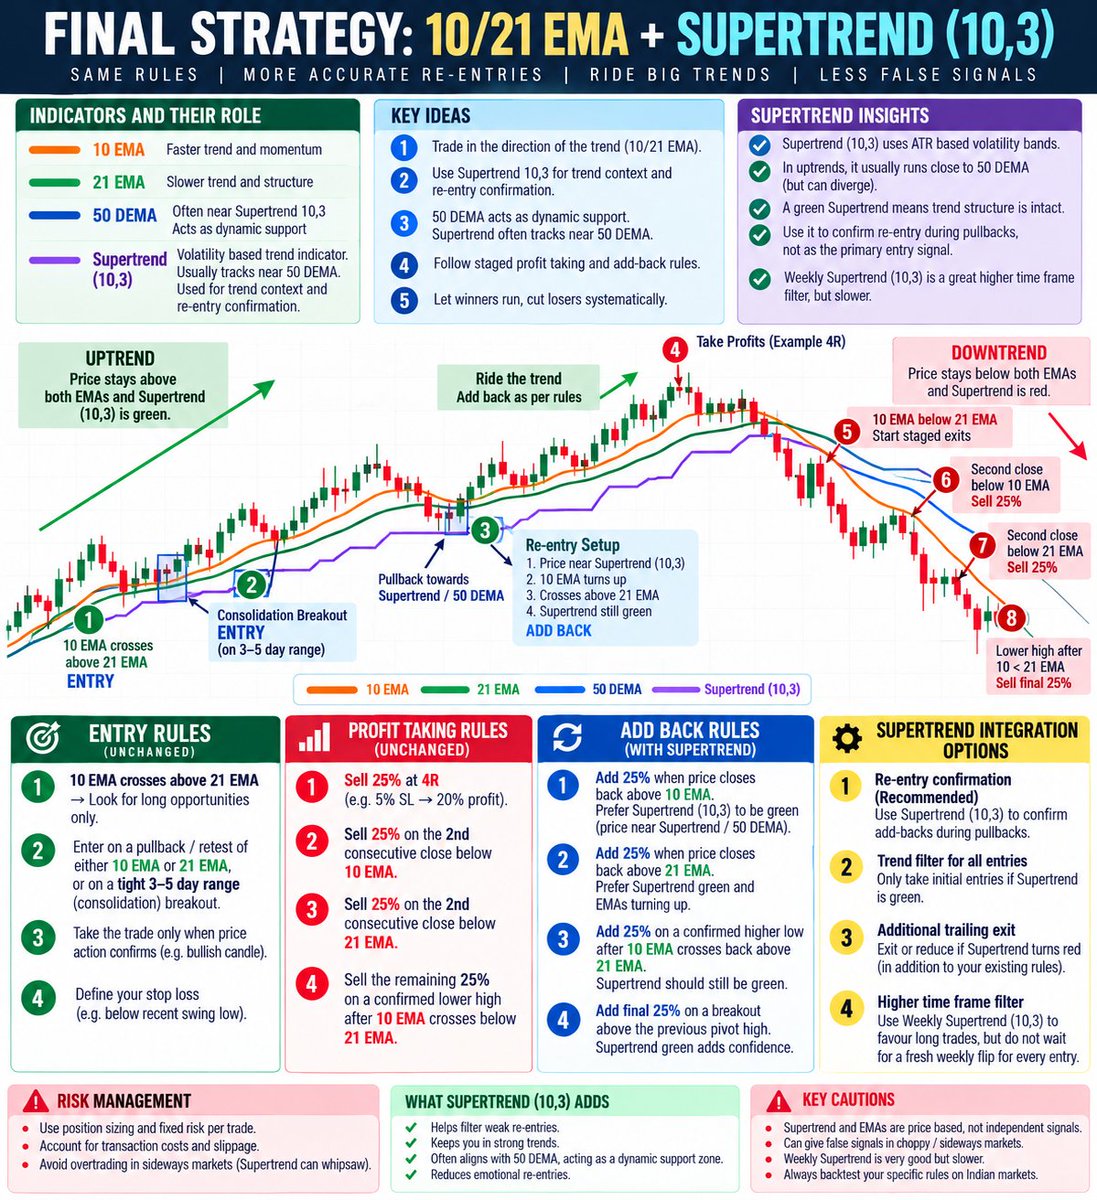
MY FINAL TRADING STRATEGY: 10/21 EMA + SUPERTREND (10,3)
The objective is simple: Catch big trends, protect capital, exit weakness and re-enter strength.
I don't want to predict tops and bottoms. I want to participate in the strongest part of a trend without surrendering my profits to emotion.
Here's my complete framework.
1. INDICATORS AND THEIR ROLES
🟠 10 EMA: Short-term momentum
🟢 21 EMA: Trend structure
🔵 50 DEMA: Dynamic support reference
🟣 Supertrend (10,3): Trend context and re-entry confirmation
2. ENTRY RULES
• 10 EMA crosses above 21 EMA.
• Enter on a pullback/retest of either EMA or a tight 3–5-day consolidation breakout.
• Wait for bullish price confirmation.
• Place the stop below the relevant swing low.
3. PROFIT-TAKING RULES
• At 4R: Book 25%.
• Second consecutive close below 10 EMA: Sell 25%.
• Second consecutive close below 21 EMA: Sell 25%.
• Confirmed lower high after 10 EMA crosses below 21 EMA: Exit the final 25%.
4. RE-ENTRY AND ADD-BACK RULES
• Close back above 10 EMA: Add 25%.
• Close back above 21 EMA: Add 25%.
• Confirmed higher low after bullish 10/21 EMA crossover: Add 25%.
• Breakout above previous pivot high: Add final 25%.
Each addition requires a valid setup and available risk capacity.
5. SUPERTREND (10,3): THE EXTRA EDGE
Supertrend is not my primary entry signal.
I use it to confirm whether the broader trend remains intact during pullbacks.
If price regains the 10/21 EMA while Supertrend remains green, my confidence in the re-entry improves.
If Supertrend turns red, I become more cautious.
Weekly Supertrend provides higher-timeframe context, but daily EMA signals drive execution.
6. RISK MANAGEMENT
• Fixed risk budget per trade.
• Position size determined by stop distance.
• No averaging down.
• No widening stops to avoid losses.
• No overtrading sideways markets.
• Account for slippage and transaction costs.
THE PHILOSOPHY
The 10 EMA tells me when momentum is changing.
The 21 EMA tells me whether the trend is holding.
The 50 DEMA provides another structural reference.
Supertrend helps me distinguish a potentially constructive pullback from deteriorating trend conditions.
None of these indicators guarantees an outcome. Their value lies in making decisions systematic.
I don't need to catch the exact bottom. I don't need to sell the exact top.
I need to enter when strength emerges, reduce exposure when weakness persists and rebuild positions when strength returns.
The goal is not to be right on every trade. The goal is to stay in the game long enough to capture the trends that matter.
Trade the trend. Respect the risk. Let winners run.
How to identify sector rotation using RRG charts 🔄
Money never leaves the market. It rotates from one sector to the next.
RRG shows you where it's flowing, before the crowd sees it.
A thread 🧵
🚨 Here is a list for all my important screeners from chartink
1. Swing Trading my favourite Screener
https://t.co/0CrqzRBu00
02. VCP Type Pattern (Range breakout) stocks
https://t.co/gCjXPeaDb8
03. My favourite Intraday tight range with Email Setup stocks Scan ( 5&15 min.)
https://t.co/u1fD9cykvW
04. Bottom formation stocks
https://t.co/bIVyTUkRxc
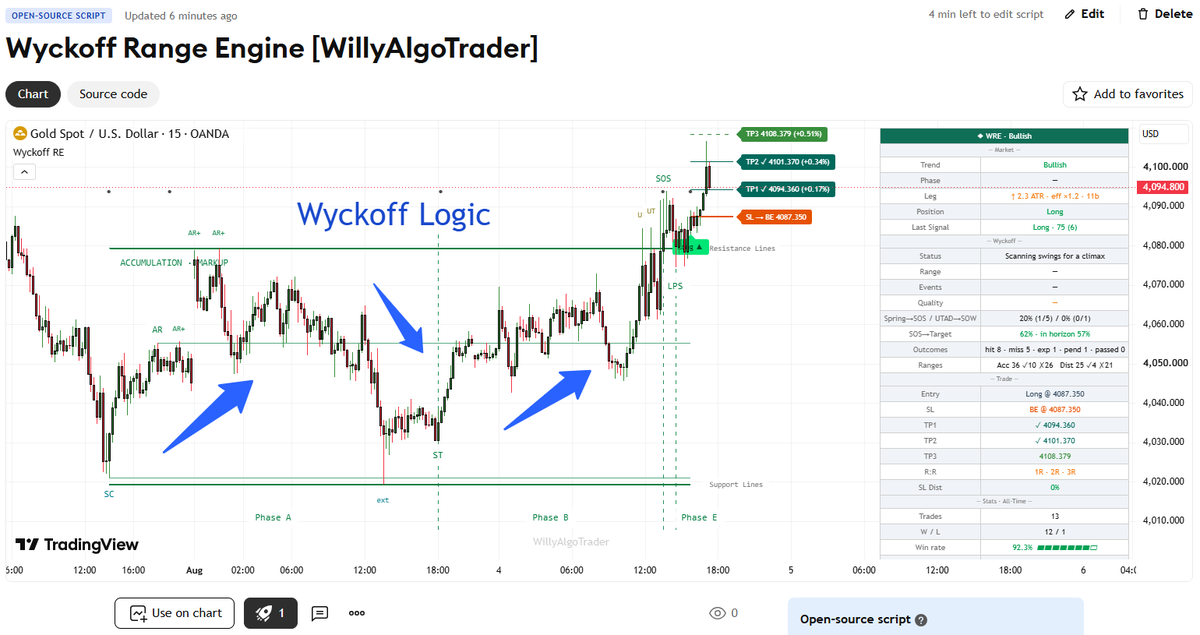
🚀 FRIENDS, MEET MY NEW POWERFUL FREE INDICATOR — WYCKOFF RANGE ENGINE!
🔥 Now you have a powerful tool to spot potential market reversals before missing the move!
And here's the exciting part:
🎯 The built-in performance metrics show a 90% win rate on GOLD! (Based on the indicator's internal statistics.)
📊 WYCKOFF RANGE ENGINE — Classic Wyckoff Analysis, Fully Automated!
Forget manually drawing accumulation and distribution zones. The indicator identifies market structures and maps them directly onto your chart.
🔍 WHAT DOES IT DETECT?
✅ Accumulation & Distribution ranges
✅ Automatic Support / Resistance levels
✅ Classic Wyckoff events: SC, AR, ST, Spring, Test, SOS, LPS
✅ Distribution events: BC, UTAD, SOW, LPSY
✅ Phase transitions: A → B → C → D → E
✅ Measured Move price targets
Everything is displayed visually, following classic Wyckoff methodology.
🧠 WHAT'S UNDER THE HOOD?
This isn't just another indicator looking for patterns on individual candles.
⚡ Swing-Based Analysis — evaluates entire price swings, including effort, peak intensity, and ATR-based movement.
⚡ Climax Detection — scores climactic moves from 0–100 based on strength, duration, speed, and peak-bar characteristics.
⚡ Smart Spring Detection — analyzes liquidity sweeps, recovery speed, and effort to distinguish potential shakeouts from weak reactions.
⚡ SOS / SOW Confirmation — evaluates breakout quality across the entire move, not just one candle.
⚡ Structural Validation — ranges require confirmed automatic reactions before becoming valid.
🛡️ BUILT-IN TRADE ENGINE
The indicator doesn't just identify Wyckoff structures — it also builds complete trading setups!
🎯 Entry signals based on selected events
🛑 Structure-based Stop Loss
💰 3 Take Profit targets calculated in R
🔒 Automatic breakeven tracking after TP1
🔄 Opposite-signal reversal logic
Choose your trading style:
• Conservative
• Balanced
• Aggressive
• Scalping
📊 ADVANCED TRADING DASHBOARD
Everything you need in one place:
📍 Current Wyckoff phase
📋 Event confirmation checklist
⭐ Pattern quality scores
📈 Historical target-hit statistics
🎯 Current trade and Risk/Reward
📊 Performance statistics: 24H / 30D / All-Time
🔔 SMART ALERTS & WEBHOOK SUPPORT
Get notifications for:
• Trade entries
• TP1 / TP2 / TP3
• Stop Loss & Breakeven
• Reversal signals
• Individual Wyckoff events
Supports both text alerts and JSON webhooks.
🚫 NO REPAINTING!
All calculations are performed on closed candles, and the indicator marks exactly when each event became confirmed.
🌍 ANY MARKET. ANY TIMEFRAME.
Gold, Bitcoin, crypto, Forex, indices — the Wyckoff methodology can be applied across different markets.
🔥 Classic Wyckoff methodology. Advanced structural analysis. Automated detection. Professional risk management.
All combined into one powerful indicator!
📌 Indicator link: https://t.co/mPBNzDiY0W
Test it on your favorite market and let me know what you think! 🚀
😎 Trading together in my Telegram: https://t.co/msBtIAmXWr
#TradingView #Indicator #TechnicalAnalysis #PineScript #Trading #Crypto #BTC #Stocks $BTC #forex #xau $xau #gold #vwap
🚀 Fx Polaris 2025 is live!
Deeper forex analysis, exclusive setups & daily insights only on Telegram.
Join now 👇
https://t.co/zArjF41euh
Best trades are shared there first!
JOIN THE CHANNEL NOW 🔥
#Forex#Trading
I’ve completely rewritten my Supertrend Method - 1 scanner. 🔥
The new version is much more accurate at identifying Stage 2 breakouts and filtering out weaker setups.
If you copied my earlier version, please update it to the latest one 👇
https://t.co/9hdpqMrdDI
A lot of people have been asking me in DMs:
“How do I start building a momentum portfolio today?”
Here’s the framework I follow 👇
🔎 STEP 1 — Find the candidates
Use this screener to find stocks making fresh 52-week highs:
https://t.co/RmXKhzIksx
Start by adding 4–5 stocks every week.
Gradually build the portfolio to around 30–40 stocks.
---
STEP 2 — Have a clear exit rule
Don't fall in love with your stocks.
I use a simple rule:
Exit when the weekly closing price goes below the 20-week simple moving average.
The idea is simple:
Let winners run.
Cut losers.
---
STEP 3 — The difficult part: selecting the final 4–5
The screener may give you many stocks.
This is where discretion comes into play.
Try to understand:
“What is the probable trigger behind this breakout?”
Look for something NEW:
• New product
• New capacity going live
• New market entry
• New approvals
• Favourable policy/regulatory decision
• Large order / customer addition
• Business model change
• Strong earnings inflection
Use AI to dig deeper into the trigger.
---
STEP 4 — Give preference to strong themes
If a stock is breaking out and its sector has strong tailwinds, it gets higher priority.
I would rather own a breakout riding a powerful sectoral trend than a standalone breakout with no obvious underlying theme.
---
STEP 5 — What I generally avoid
❌ Highly cyclical businesses
❌ Choppy charts
And here's the most important part:
Even after doing all this, my accuracy is only ~35%.
That's okay.
Because momentum investing isn't about being right most of the time.
It's about:
Cutting the losers quickly + letting the winners run.