Independent quantitative research on volatility and systematic positioning. We model what institutional funds are forced to do next, and what it means for risk.
📰 Get complimentary access to institutional-grade market intelligence, sourced from Wall Street’s leading banks.
Data-driven insights by academics.
Check out our FREE Substack👇
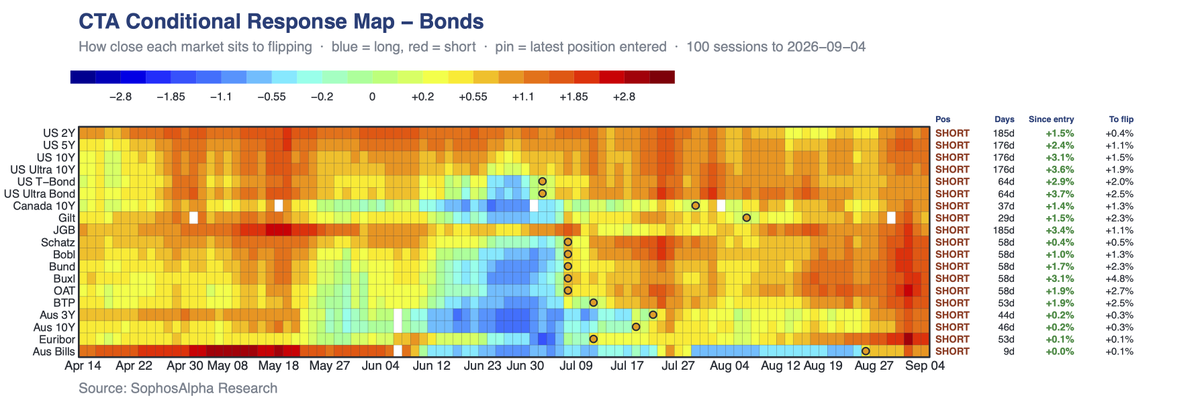
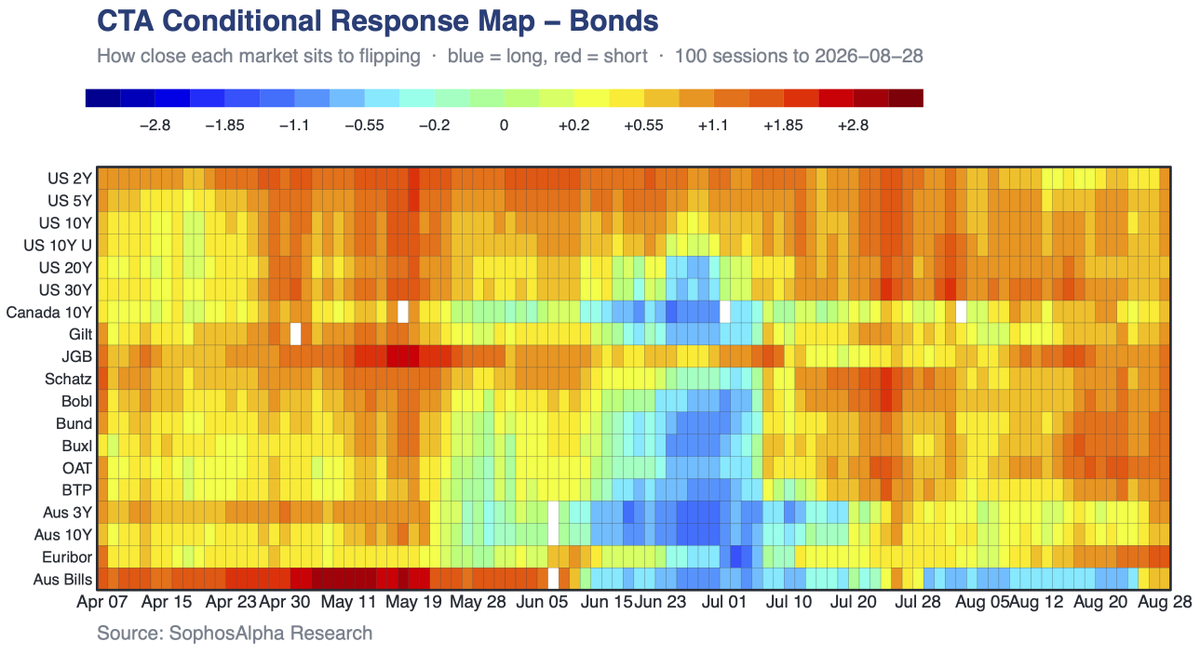
@KobeissiLetter Trend followers have been short the entire global bond complex for months.
Our US 2Y and JGB shorts are 185 days old, the US belly 176, and all 19 markets are green since entry. This decline hasn't been a surprise to systematic money, it's been the trade.
After dipping into negative territory, Nasdaq Non-Dealer net positioning forcefully rebounded during August.
Non-Dealers purchased every week from the August 4th low through September 1st for a cumulative +$51.0bn, marking a record stretch in notional terms.
Markets don't move on news. They move on flows and positioning.
We map that layer every week: who is long, who is already full, and what they are forced to do next.
This week's Institutional Monitor 👇
https://t.co/WMHJDzlLDN
After dipping into negative territory, Nasdaq Non-Dealer net positioning forcefully rebounded during August.
Non-Dealers purchased every week from the August 4th low through September 1st for a cumulative +$51.0bn, marking a record stretch in notional terms.
@KobeissiLetter Gold has been paying trend followers. Our systematic trend following portfolio has been adding to gold longs since early August, when momentum-driven conditions turned meaningfully better.
Despite the pullback, dealer gamma remains positive, a regime that historically damps realized vol and gives the index a mechanical bid on dips. Gamma is mid-range versus the past year though, so treat it as a cushion, not a floor.
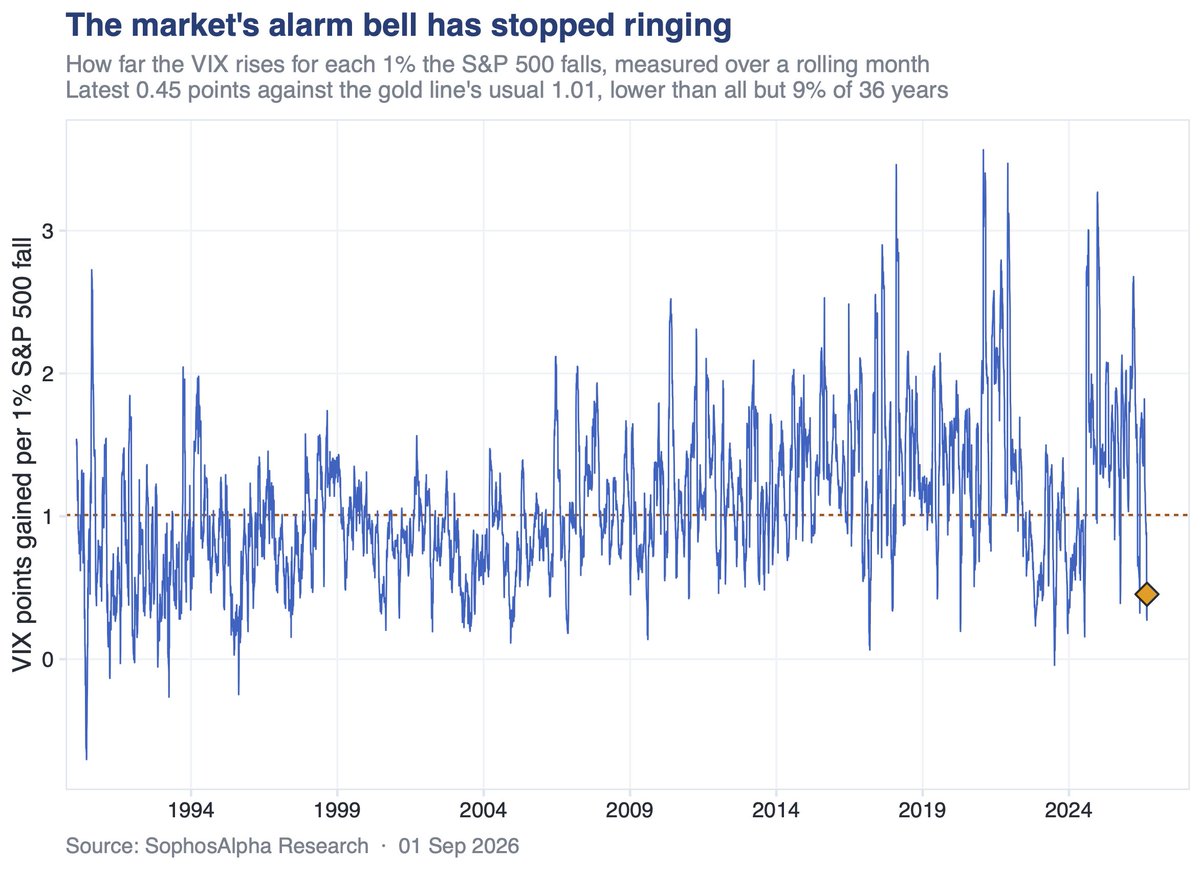
The VIX has stopped doing its job.
For 36 years it rose about 1 point for every 1% the S&P 500 fell. Right now it manages 0.45. Only 9% of history has seen a weaker reaction. Protection looks cheap because it has quietly stopped protecting.
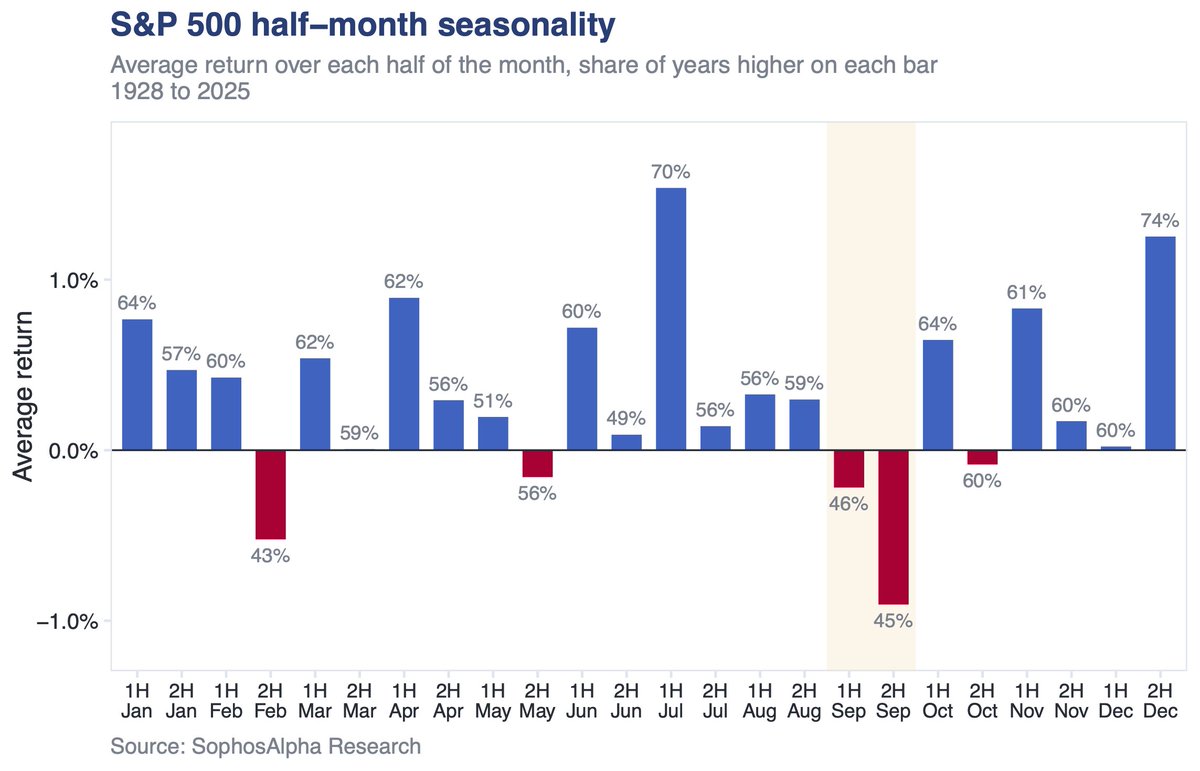
September is not weak all the way through.
Since 1928 the back half of the month has averaged 0.91% negative, the weakest two week stretch of the year, and has been higher in only 45% of years. The first half is barely negative. That window opens in two weeks.
Earnings are largely behind us. What follows is a very different catalyst calendar: NFP Sep 4, PPI Sep 10, CPI Sep 11, FOMC Sep 16.
Unlike earnings, that is a far more two sided set. After a season dominated by positive surprises, the right tail is less obvious.
September screens as the worst performing month for the SPX followed by Q4 being the strongest quarter of the year.
Seasonal moves may be exacerbated by midterm election seasonality, which tends to be soft into the election and then strongly positive after it.
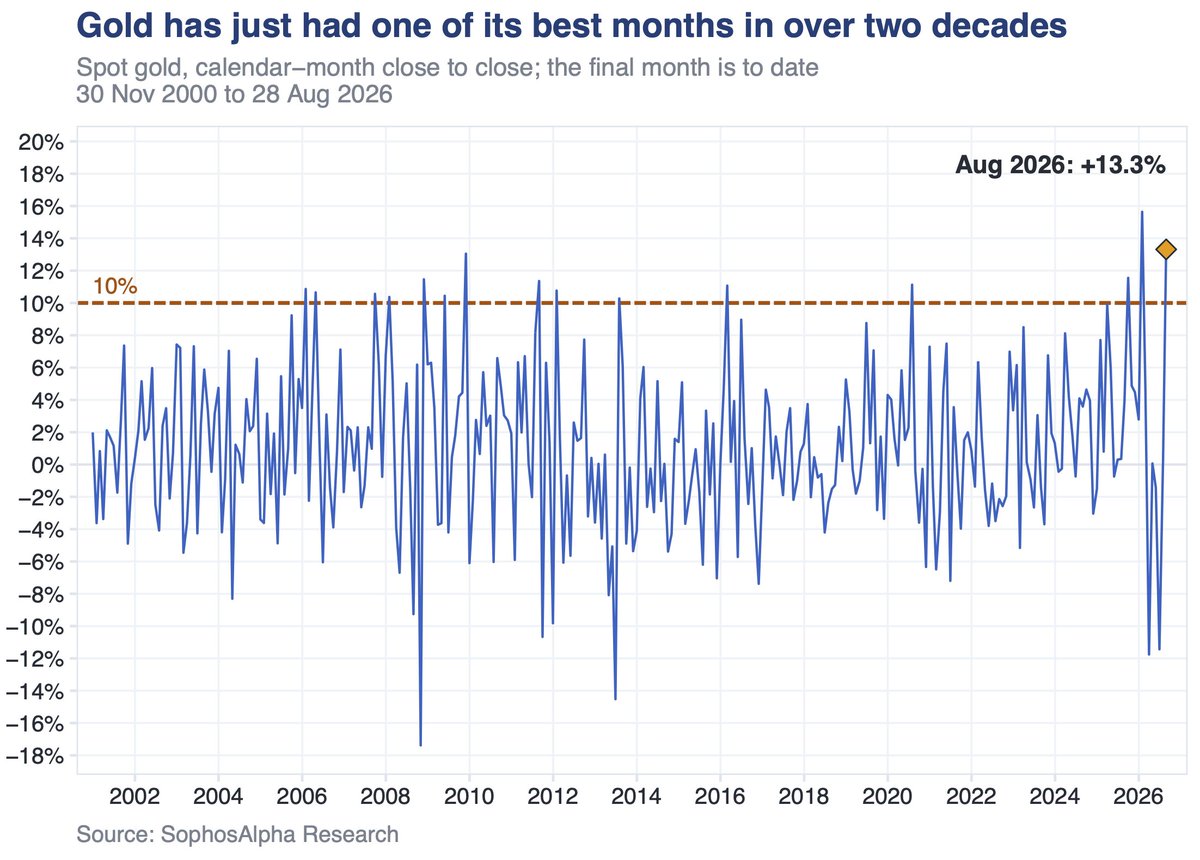
Gold has just had one of its best months in over two decades.
+13.3% in August, one of a handful of 10%+ months since 2000, and speculative demand hit a nominal record along the way.
Investors are as bearish as they usually get after a 10% selloff, except there hasn't been one.
The bearish share has averaged above 40% for four weeks, a level that has coincided with the S&P sitting 7 to 10% off its highs. Today it is less than 1% away.
Investors are as bearish as they usually get after a 10% selloff, except there hasn't been one.
The bearish share has averaged above 40% for four weeks, a level that has coincided with the S&P sitting 7 to 10% off its highs. Today it is less than 1% away.
Equity bull markets tend to end with either a hiking cycle or a recession.
Currently, a recession is highly unlikely to manifest over the next few quarters. What is unclear is if the Fed hikes, and what the scale and length of the hiking cycle would be.
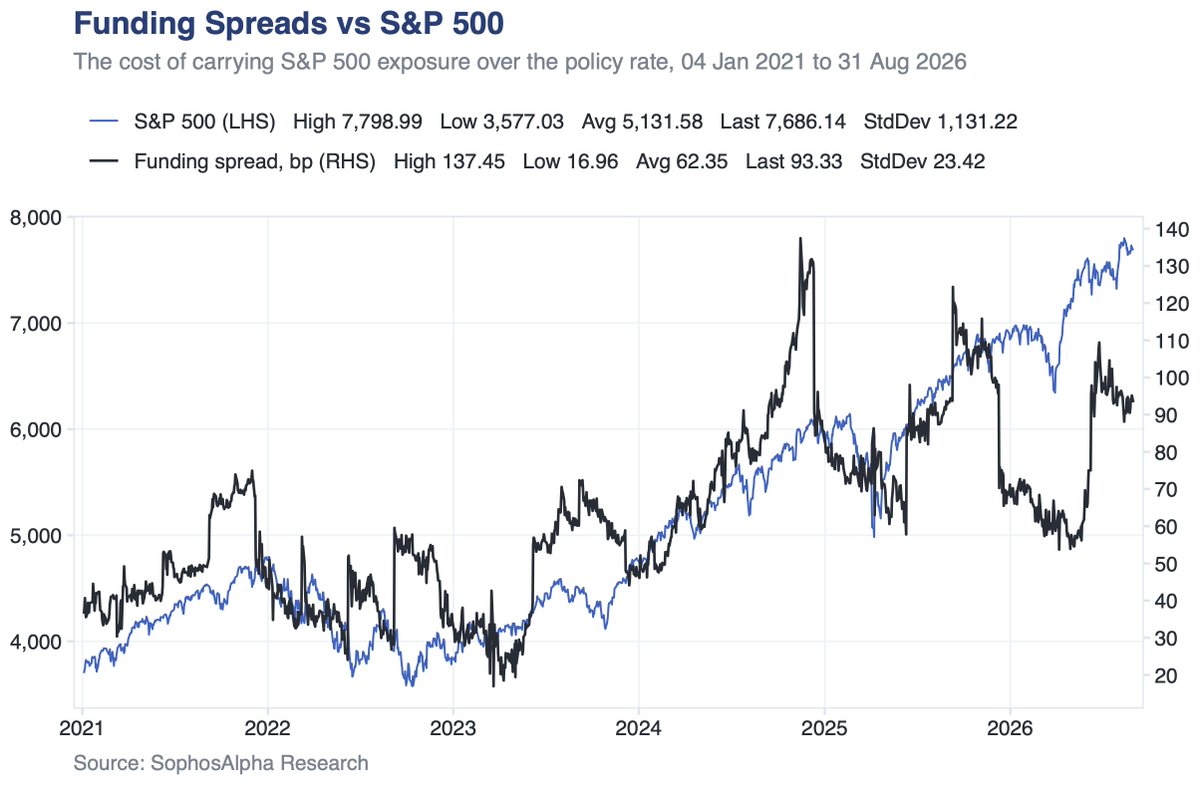
Meanwhile, professional investors have not been chasing this last leg higher. The cost of carrying S&P 500 exposure, which reflects how much leveraged longs are paying dealers to hold their positions, spiked into the July rally and has been easing since, even as the index printed fresh highs in August.
@KobeissiLetter A global bond selloff was most pronounced in Asia, where 10-year Japanese yields hit the highest level this century.
The move came as US Treasury Secretary Scott Bessent pressed the Bank of Japan to tighten policy amid fresh weakness in the yen.
Substantial speculative Gold buying surrounding the announcement of Treasury market intervention, extending a run of purchases that began with the July FOMC.
Then Jackson Hole turned hawkish, real rates rose, gold dropped sharply.
The Mag 7 just had their most violent earnings season in ten years.
Three of the seven swung double digits in a single session, while the VIX sat under 16.
Index vol is asleep. The biggest names in the world are not.
SPX kicks off the week in positive gamma.
Dealers are absorbing moves rather than amplifying them, but the cushion is thin: the flip sits roughly 32 points under spot, 0.4%. And it barely shifts as vol rises, so this regime ends on price, not on a vol spike.
Markets don't move on news. They move on flows and positioning.
We map that mechanical layer every week, with academic rigor and the math to back it.
Read free 👇
https://t.co/zxue6usC1J
Our CTA simulation runs a collection of trend-following frameworks with varying adjustment speeds, to get a sense of positioning from the systematic community. It currently suggests that long end positioning looks quite stretched relative to its recent history.
Full breakdown👇