Soraya.
A name for the Pleiades, a cluster of stars forming one pattern in the sky.
Different points of light, seen together as one.
Soraya Research is built on the same idea: connecting markets, technology, economics, and capital until the signal becomes visible.
All regions land at 7.1-7.6% via different paths. US leans on revenue (6.3%) and buybacks (2.5%), with valuations dragging -0.8%. Ex-US leans on dividends (3.0%). EM's 7.2% revenue growth loses 5.2 pts to margins and dilution. Similar returns make diversification nearly free.
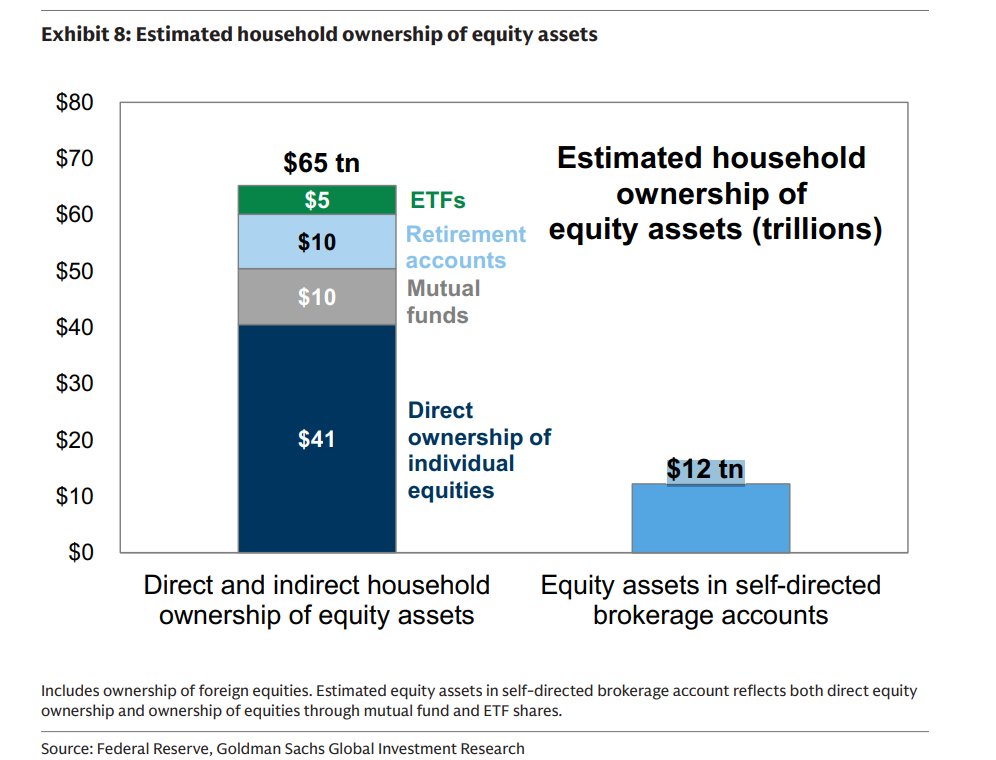
Households own $65tn of equities, but only $12tn sits in self-directed brokerage accounts. Direct stocks ($41tn) dominate, so much of that is likely held outside retail trading platforms. ETFs at $5tn are just 8% of the total, leaving a long runway for passive inflows.
U.S. households own 42% of equities, making them the largest shareholder group. This concentration ties market performance to household wealth and sentiment, while mutual funds and exchange-traded funds add another 25% of ownership, reinforcing the role of passive investing.
US equity inflows have rebounded strongly in 2026, signaling sustained investor demand. However, heavy inflow can amplify crowded positioning and downside risk if earnings disappoint or liquidity tightens. Strong flows support momentum, but do not guarantee the rally's durability
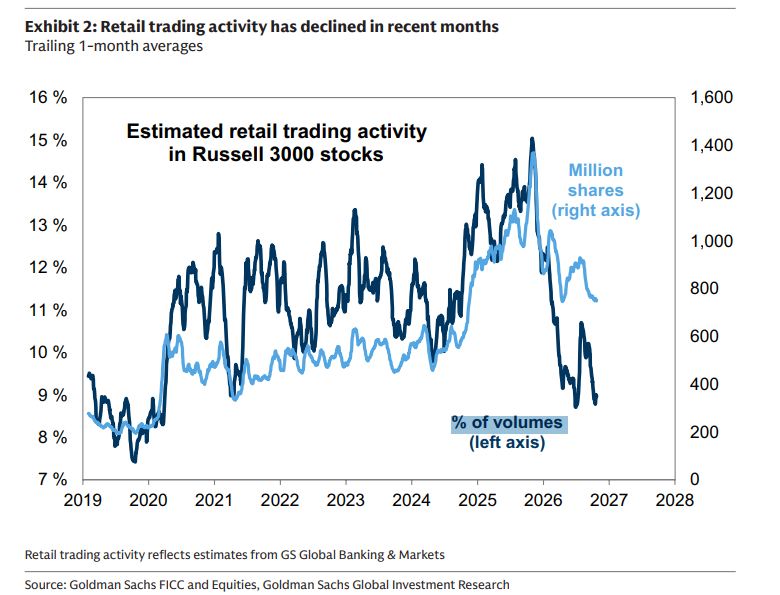
Retail trading in Russell 3000 stocks has collapsed from 2025 peaks, with retail’s volume share falling toward 9%. Despite share volumes remaining elevated, the divergence signals weaker speculative participation, potentially reducing a key source of equity demand and momentum.
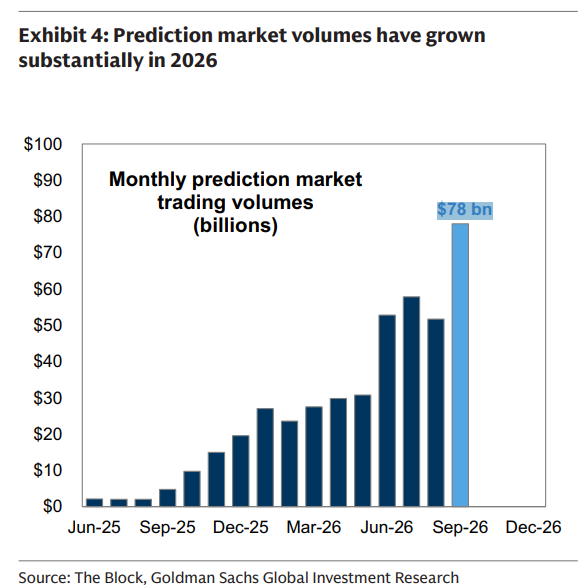
Prediction markets are scaling rapidly, with monthly trading volume reaching $78 billion in September 2026. The acceleration signals rising demand for event-based speculation, but sustaining this growth will depend on liquidity, market trust, and regulatory clarity.
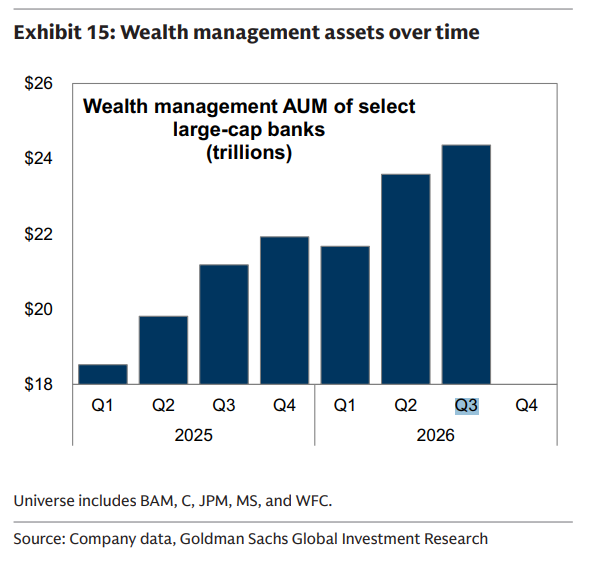
Big-bank wealth AUM climbed from ~$18.5T (Q1'25) to ~$24.4T (Q3'26), up ~32%. Only Q1'26 dipped (~-1%), then Q2 jumped ~9%. Growth likely reflects market beta plus inflows, so fees stay tied to equities. Scale compounds, but the cycle still sets the pace.
Pretty much.
As of the past few weeks, debt markets have almost entirely shut off access to money for any company that doesn’t have substantial revenue independent of AI data centers.
SpaceX closed $40B of debt for GPUs, but we’re investment grade and have Starlink & launch revenue.
That means the 200+ neoclouds are going to see guppy-level death and consolidation. Some will make it through, but not many.
South Korea’s export growth signals a strong semiconductor upcycle, driven by AI demand. However, SMH’s 200% year-over-year rally far outpaces export growth, suggesting markets are pricing in sustained earnings expansion and increasing the risk of a valuation correction.
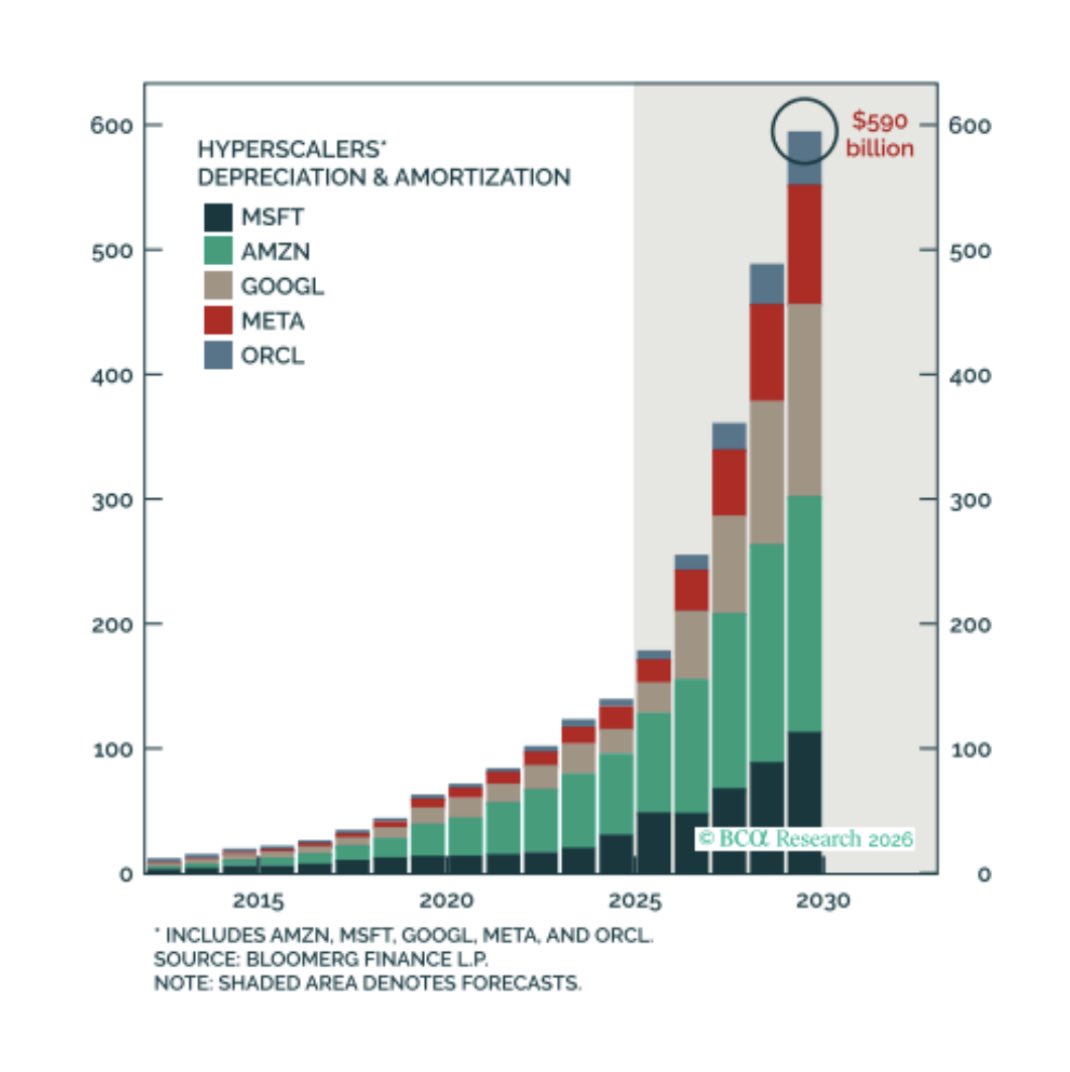
Hyperscaler D&A is set to jump from about $180B in 2025 to $590B by 2030, a 3x rise. Capex is now a fixed cost that hits earnings before any AI revenue arrives. Margins hold only if returns on compute outrun depreciation. Miss, and the multiple compresses.
US deficit near -1% of global GDP is financed by East Asian and European surpluses. If Europe pivots to net importer to fund its investment surge, the US loses a marginal financier. Expect pricier US funding, a weaker dollar, and a global repricing of capital.
US large cap's 7.5% return leans on revenue growth (6.3%) and buybacks (2.5%), while valuations drag -0.8%. EM has the strongest revenue engine (7.2%) but margin and dilution erosion cut its total to 7.1%. Developed ex-US leads at 7.6% thanks to dividends and FX.
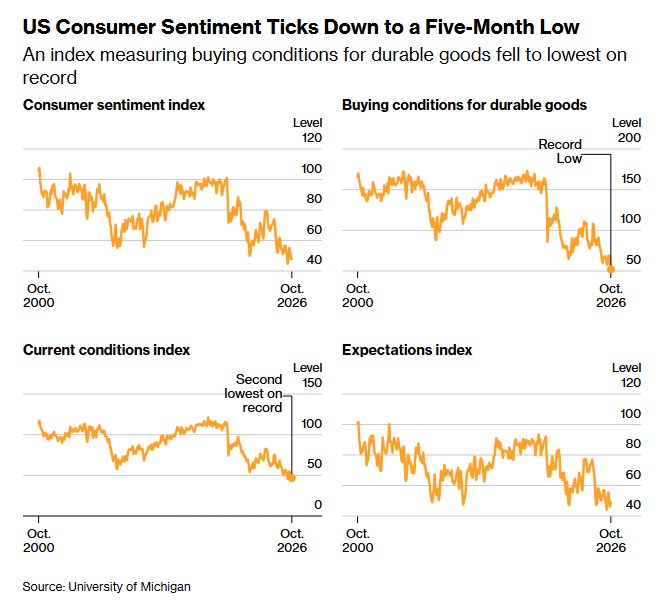
US consumers are deeply pessimistic: durable goods buying conditions hit a record low, current conditions are second lowest ever, and sentiment sits near 40. Oil at $114 squeezes wallets as stocks wobble. Weak demand meeting costly energy is the stagflation signal.
Brent has nearly doubled from ~$60 in January to ~$114, retracing almost the full July slump to ~$72. Oil is rallying while stocks wobble on AI fears, which is a stagflation-flavored mix. Energy shocks like this are exactly what the earlier IMF chart warned about.
Earnings drove the rally on both sides of the Atlantic, with both indices up roughly 55% to 60% since 2022. The US looks more fragile: its P/E contribution has faded to near zero, so returns now hinge entirely on earnings delivery.
Big IBIT outflows have preceded weakness that scales with size: BTC averaged -4.6% a week after $300M+ exits and -16.4% a month after $500M+, versus +3.0% on normal days. Caveat: only 3 events at the top tier. Treat it as a stress signal, not a trigger.
EM tech concentration has surged to ~41%, above the US at ~35% and past its 2018 peak, while EAFE and Canada sit near 10%. EM's AI correlation hit 0.9, versus 0.6 on average. Diversifying into EM no longer diversifies away the AI trade; it doubles down on it.
Data center power demand is projected to nearly double from ~41 TWh in 2025 to ~78 TWh by 2030, then add only ~37% more by 2035 (~107 TWh). The curve flattens after 2031, so the biggest grid and utility payoff sits in the next five years, not the long tail.