Nifty Energy index took the pause at marked resistance at 41357 . To wait for few weeks of consolidation here .. let's see if 21 dema should holds in this pullback .
Tracking all these stocks ( & many more such ) and waiting for sideways 4-8 weeks above 10/21 dema.
Shown green line as 10 ema, light blue as 21 ema. Violet line as price movement above them.
Thermax as a latest example of it.
Behavior of price moment is changed for the first time since correction started in Sept 2024.
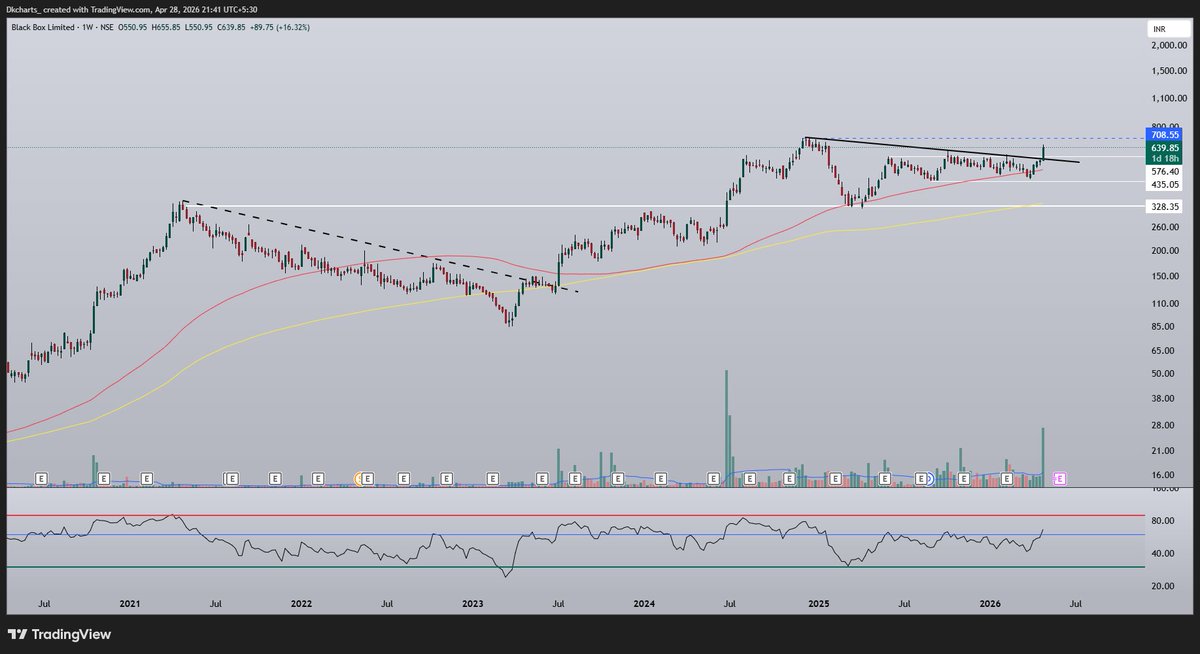
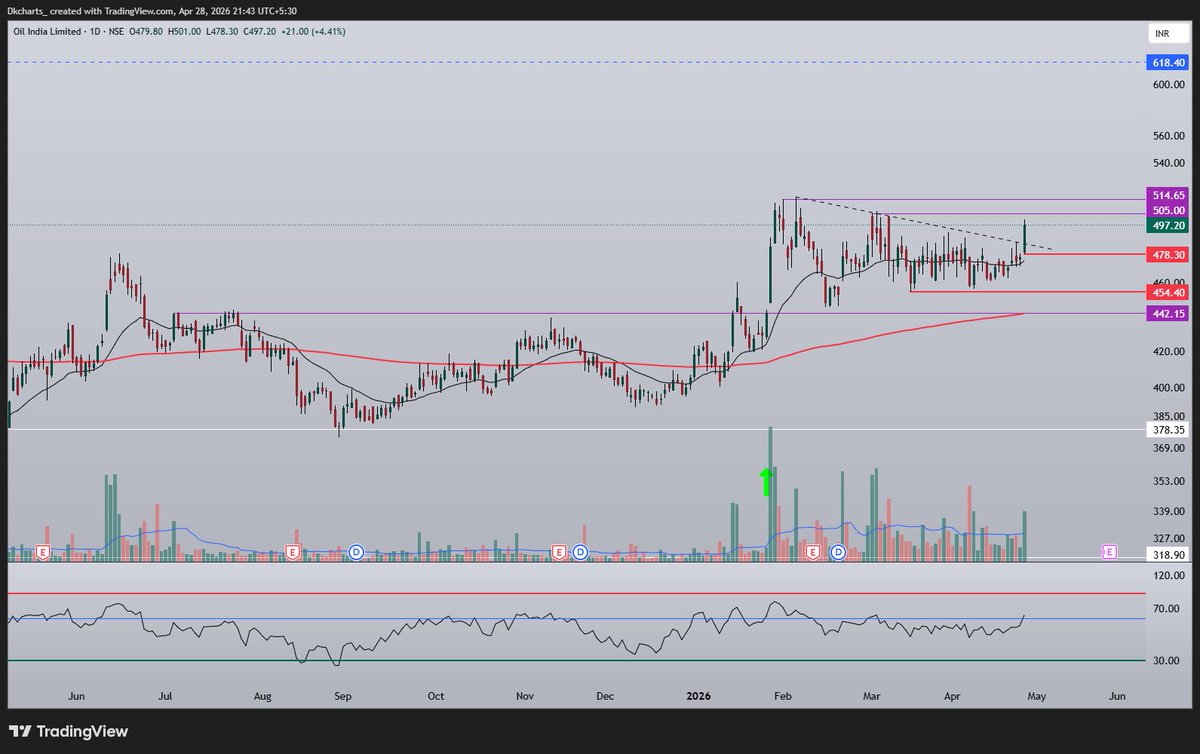
Trendline breakouts are smooth..
Volume is on 🔥
Candle size 🔥
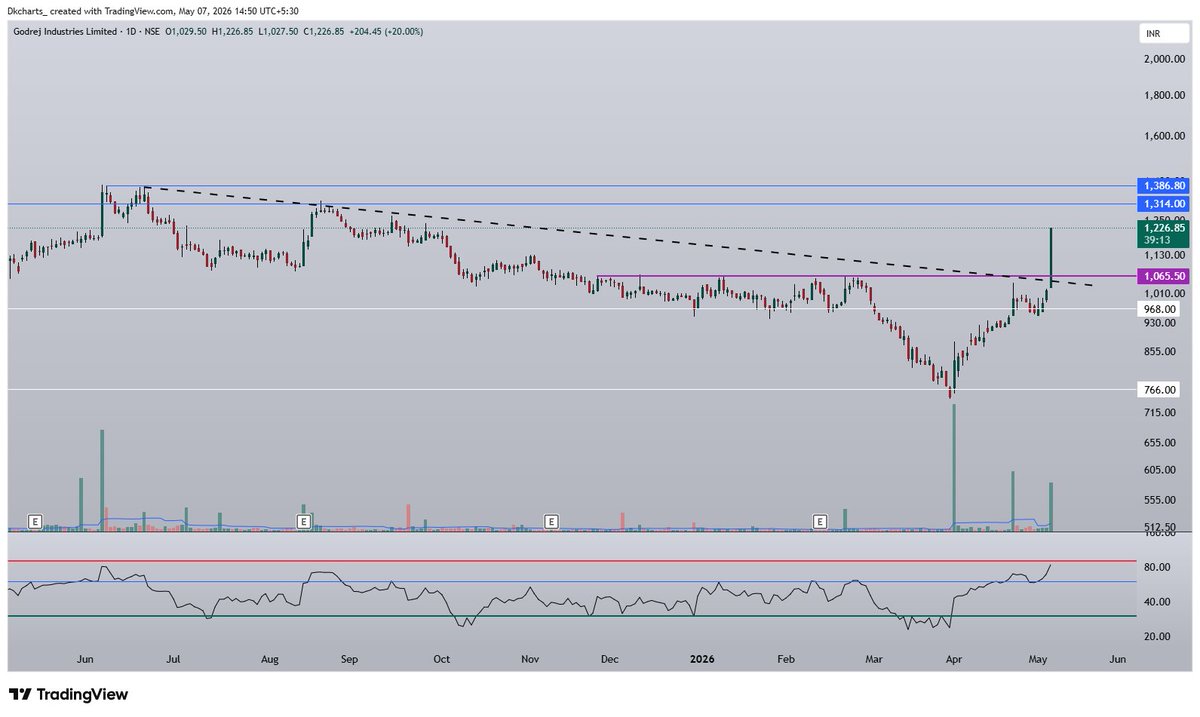
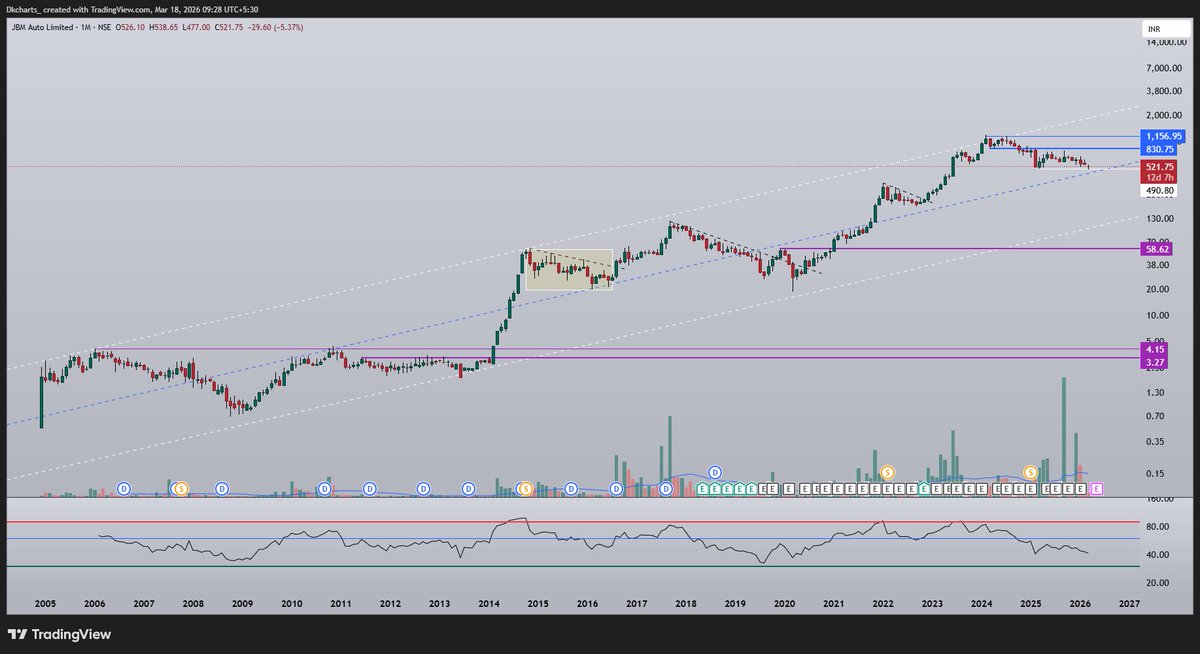
few random example charts ( not for entry or trade )