Analytics should do more than visualize information.
It should help teams make faster, more confident decisions.
The new Spotfire website showcases how visual industrial analytics connects data, context, and AI into a shared environment for exploration, investigation, and action.
Explore the new Spotfire experience - https://t.co/Np7P7FaSFP
#Spotfire #VisualIndustrialAnalytics #DecisionIntelligence #AI
What happens when supply chain data, operational data, and external risk signals are viewed together instead of in silos?
Organizations move beyond monitoring what happened and begin understanding what could happen next.
In the first blog of our new series with NeoNetra, "Decision intelligence for a resilient future", we explore why the future of supply chain resilience depends on moving beyond dashboards to decision intelligence, and how decision intelligence helps manufacturers and industrial organizations identify risks earlier, evaluate trade-offs, and make more confident decisions.
Read the first blog in our new series on building resilient and sustainable operations: https://t.co/VL2nBPq9IT
#DecisionIntelligence #Manufacturing #VisualIndustrialAnalytics #SupplyChainResilience
Industrial organizations need more than disconnected AI tools or static dashboards.
They need environments where data, analytics, AI, and domain expertise come together in a shared decision layer.
Explore how Spotfire® is advancing AI-powered visual industrial analytics through Spotfire Copilot™, visual AI, and intelligent analytical workflows.
Read the blog: https://t.co/3Fx7y0QPbj
Watch the webinar: https://t.co/H4oljsKtcM
#Spotfire #IndustrialAI #DataAnalytics #Energy #Manufacturing #VisualIndustrialAnalytics
Most operational challenges aren’t caused by lack of data.
They’re caused by fragmented insight across teams, tools, and workflows.
The new Spotfire website is built around how engineers, analysts, and operational teams actually investigate problems, understand variation, and drive performance forward.
Explore the new experience - https://t.co/EFvoHOESAT
#Spotfire #VisualIndustrialAnalytics #IndustrialAI #OperationalExcellence
Industrial decisions rarely depend on a single system or dataset. Engineers and analysts must investigate across complex operational environments where context matters.
In our latest webinar, we explored how Spotfire® AI is becoming embedded directly into visual analytical workflows through conversational interaction, visual AI, and domain-aware intelligent agents.
Learn how Spotfire helps teams move more efficiently from questions to understanding while maintaining transparency, context, and control.
Read the blog: https://t.co/bvmhmzBvyb
Watch the webinar: https://t.co/ehFGeS1XQQ
#Spotfire #IndustrialAI #VisualAnalytics #Manufacturing #Energy #AI
Industrial decisions rarely depend on a single system, dataset, or perspective.
The new Spotfire website reflects a new direction for visual industrial analytics, bringing together data, analytics, AI, and operational context in a shared decision layer designed for industrial complexity.
Explore the new experience - https://t.co/Bo6BJlkAXW
#Spotfire #IndustrialAnalytics #Manufacturing #Energy #AI
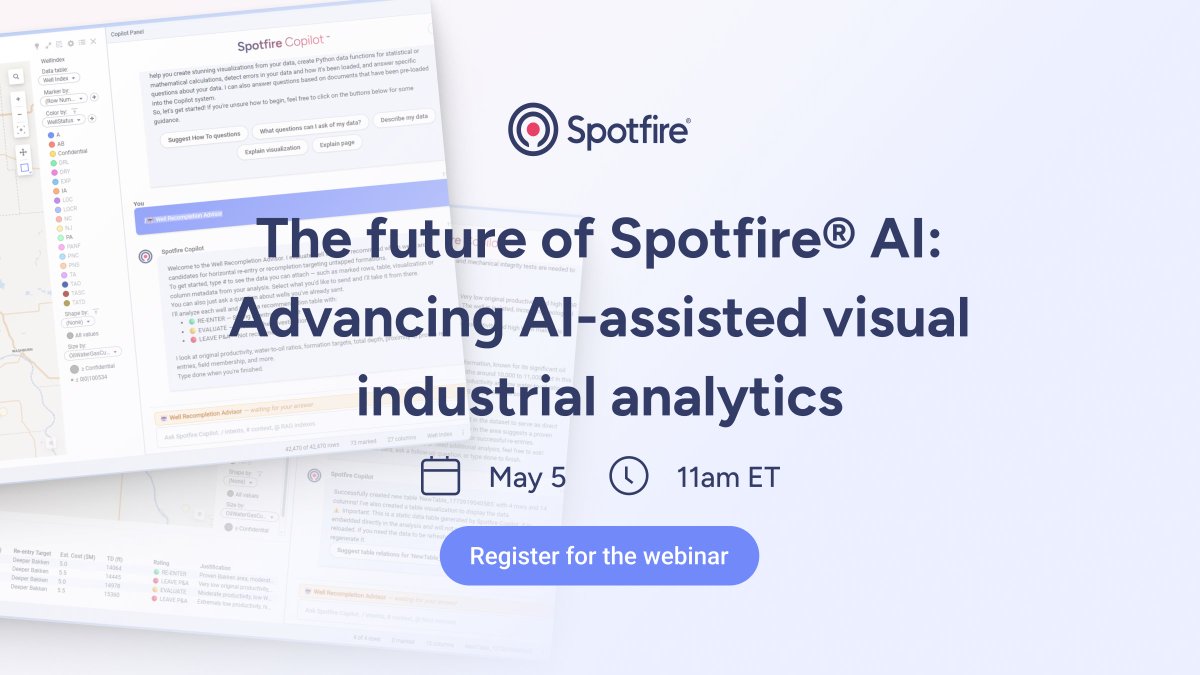
Discover insights. Surface risks early. Drive operations forward.
See how Spotfire® AI is evolving the decision layer, bringing contextual, explainable AI directly into analytical workflows.
Taking place tomorrow, May 5th | 11 AM ET - Save your spot: https://t.co/tfAjKXyWGe
#VisualIndustrialAnalytics #AI #Spotfire
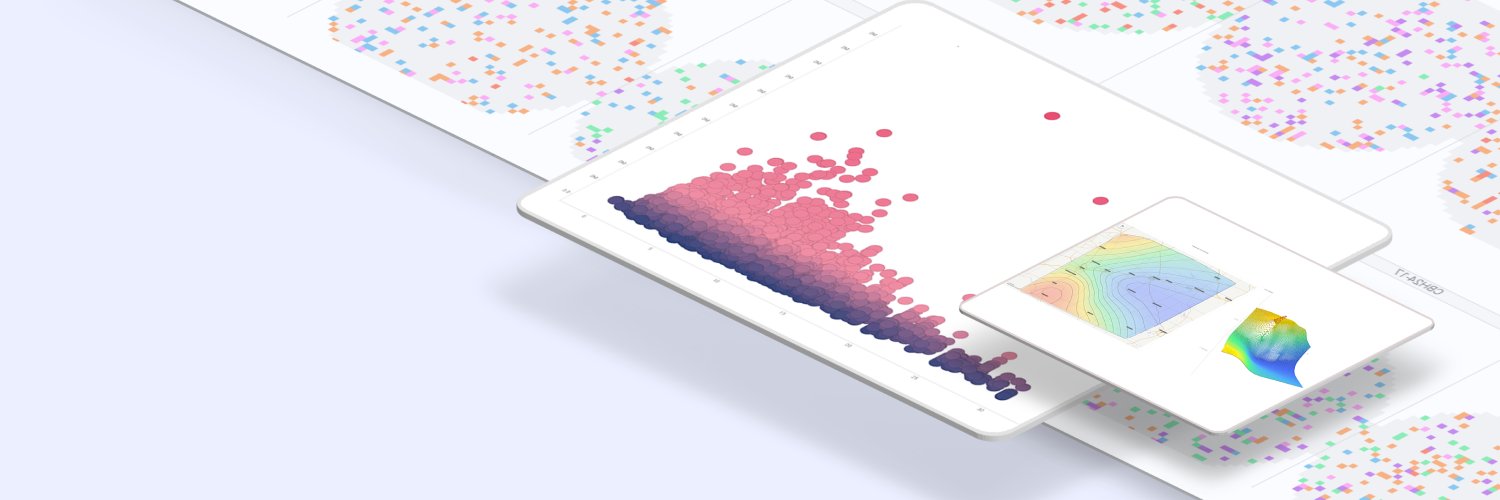
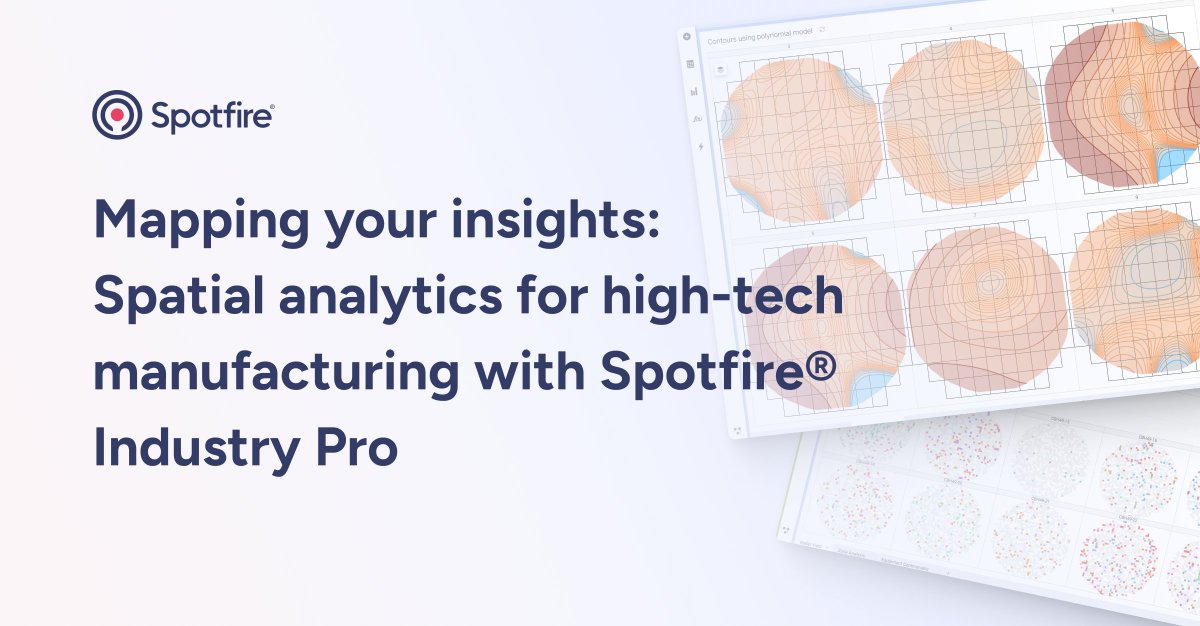
In high-tech manufacturing, location isn’t just position, it’s process context.
Wafer patterns, defects, and process conditions all interact spatially, but most tools stop at visualizations.
See how Spotfire® Industry Pro embeds spatial analytics into investigative workflows to help teams:
✔️ Discover insights
✔️ Surface risks early
✔️ Drive operations forward
Read the blog: https://t.co/WYn1Y1Dw20
#VisualIndustrialAnalytics #Manufacturing #MappingInsights #WaferMaps
From fragmented analysis to confident decisions.
Spotfire® AI brings intelligence directly into the decision layer, connecting data, context, and expertise in one analytical environment.
In this webinar, see how Copilot 2.3 and the evolving Visual AI roadmap help teams:
• Move faster from questions to analysis
• Understand what’s happening, and why
• Act with confidence in complex environments
May 5 | 11 AM ET - Register now: https://t.co/1MGWTCIvlM
#IndustrialAnalytics #AI #DecisionMaking #Spotfire
Understanding why performance changes is critical in complex industrial environments.
Taking place tomorrow, see how Statistica® algorithms now run directly inside Spotfire® workflows, helping teams apply advanced statistical and machine learning techniques within visual analysis to support faster, more confident decisions.
Save your spot for tomorrow's webinar: https://t.co/ASJ1LT8b8X
#visualindustrialanalytics #Spotfire #Statistica
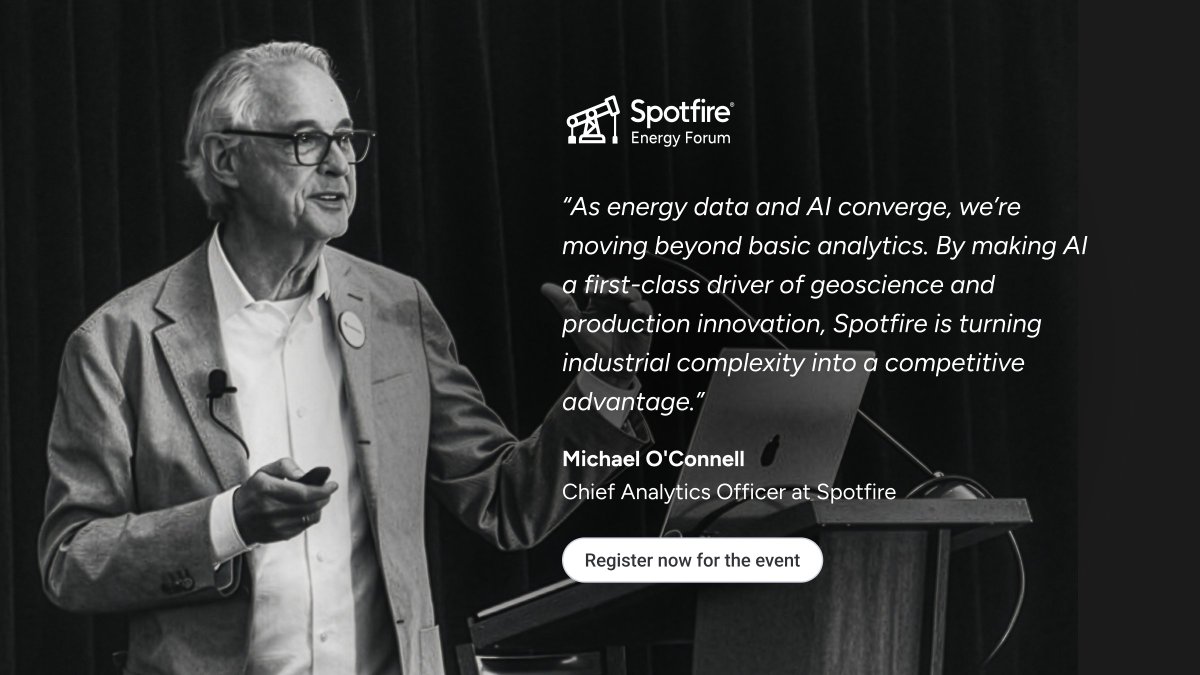
Join us for the 2026 Spotfire Energy Forum in Houston on May 13!
Hear from Spotfire leaders, industry experts, and major oil & gas companies about the latest in visual industrial analytics, AI-powered insights, and innovations shaping the energy sector from reservoir to refinery. Dive into real-world use cases and get a first look at what’s next on the Spotfire roadmap.
Don’t miss your chance to connect, learn, and help shape the future of energy analytics. Register now to secure your spot: https://t.co/BNoUNzg1JO
#SpotfireEnergyForum #IndustrialAnalytics #Energy #oilandgas
What happens when advanced statistics live inside visual analysis?
Spotfire® 14.8 embeds industry-grade analytics directly into interactive workflows, reducing handoffs, accelerating investigation, and helping teams move from insight to action faster.
Explore what’s new in the blog https://t.co/8clvOAhobQ
Watch the on-demand webinar https://t.co/OMC7SbV0Vw
#VisualAnalytics #Spotfire #VisualIndustrialAnalytics
When insight is fragmented, decisions slow down.
Industrial teams are often forced to piece together signals across systems, disciplines, and tools, making it harder to see what’s happening, understand why, and act with confidence.
Spotfire® is evolving the decision layer with AI that works the way experts think.
Join us to explore how Spotfire® Copilot 2.3 and the Spotfire Visual AI roadmap bring intelligence directly into analytical workflows, helping teams:
• Discover insights across complex data
• Surface risks earlier
• Drive operations forward with confidence
May 5 | 11 AM ET - Register now: https://t.co/EnghApgVcg
#IndustrialAnalytics #DecisionLayer #AI #Spotfire
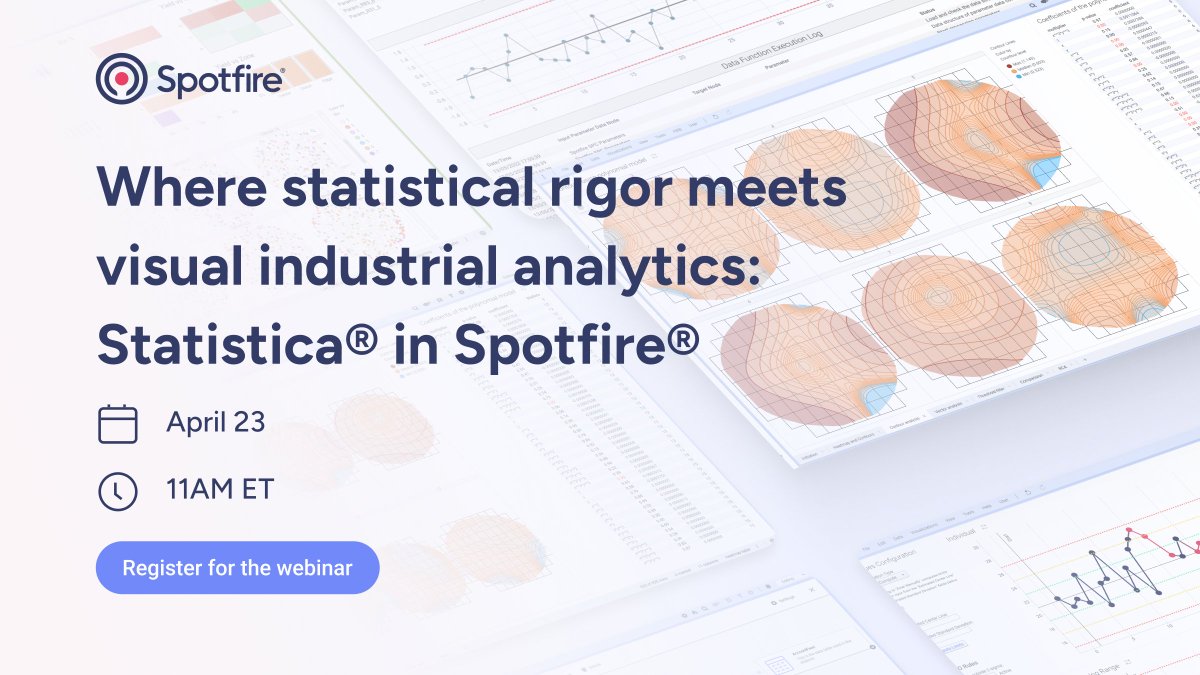
Advanced statistics. Visual industrial analytics. One workflow.
See how Statistica® analytics now run natively in Spotfire® Industry Pro, helping manufacturing teams move from exploration to explanation faster..
Register now for our April 23rd webinar: https://t.co/GwntUYMXxt
#visualindustrialanalytics #Spotfire #Statistica
Industrial teams don’t just need insights, they need confidence.
Spotfire® 14.8 strengthens the link between advanced analytics and real-world decisions, bringing deeper statistical power, clearer context, and faster workflows into one visual environment.
Explore what’s new in the blog https://t.co/oCZGNiARFB
Watch the on-demand webinar https://t.co/GFaVg7Jrav
#DecisionIntelligence #IndustrialData #Spotfire #VisualIndustrialAnalytics
Upstream drilling decisions depend on connecting planning, engineering insight, and operational execution.
But too often, drilling schedules, resource plans, and well trajectory analysis live in separate tools.
In our latest From Data to Decisions blog, see how Spotfire® Industry Pro helps bring these perspectives together with new Spotfire Industry Pro add-ons, like the Task & Resource Timeline visualization, and Analyze Well Trajectory action.
Helping energy teams move from fragmented data to coordinated, confident decisions.
Read the blog: https://t.co/O9mGPfFYw2
#EnergyAnalytics #OilAndGas #VisualIndustrialAnalytics #Spotfire
Industrial teams need more than dashboards, they need to understand why performance changes and what to do next.
Join our upcoming webinar on April 23rd, to see how Statistica® analytics now run natively inside Spotfire® Industry Pro, bringing advanced statistical modeling and machine learning directly into interactive visual workflows.
Register now: https://t.co/HKvA7nAf19
#visualindustrialanalytics #Spotfire #Statistica
When insights are fragmented, decisions slow down.
Our latest webinar explores how Spotfire® Industry Pro helps energy teams connect subsurface, production, and operational data in one visual analytical environment.
Read the recap blog and watch the webinar on demand. https://t.co/QN5QXQObXy
#Energy #VisualIndustrialAnalytics #DataDriven #SpotfireIndustryPro
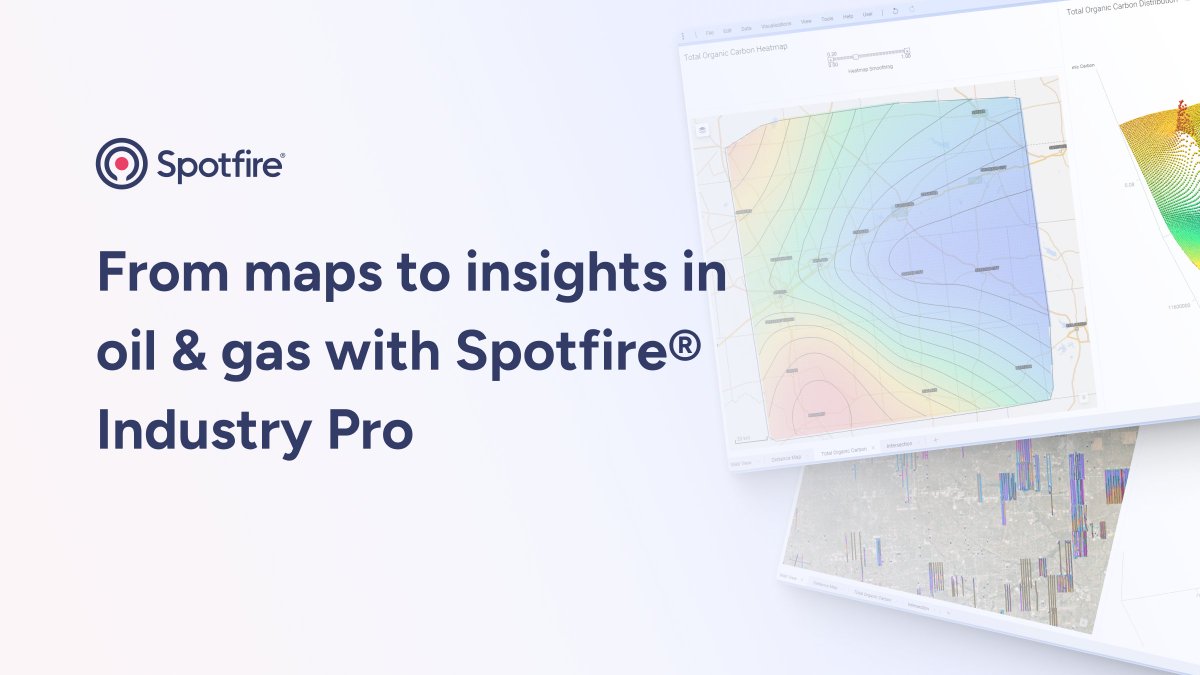
In energy operations, decisions depend on understanding how everything connects in space.
Spotfire® Industry Pro transforms mapping from static visualization into a shared visual industrial analytics environment, helping teams uncover relationships, detect risks earlier, and act with confidence.
Discover insights. Surface risks early. Drive operations forward.
Read the blog: https://t.co/Ff5SJymfZz
#Energy #IndustrialAnalytics #DecisionIntelligence #SpotfireIndustryPro