Innovating financial tech solutions | Empowering digital finance journeys | Committed to transparency & compliance | Not a SEBI-registered advisor or broker
My dear followers!!!
Thank you all for the lovely support you all have extended to me for my relentless effort in providing you all with good and consistent content for your learning benefits.
However, due to some issues, the automated system has been down for a couple of days, and I hope I will be able to resolve those issues over this weekend.
Till then, I would request you all to just keep patience.
Thank you all for your kind understanding.
@fyers1 Hi!
Your 2L and 3L true atomic multileg order API endpoint is awesome. Can you extend it for 4L as well? It will help us place box-spread orders also. Looking for your kind support as usual.
It is wonderful to note that you have introduced the multiorders facility in your latest API update:
https://t.co/qLN8pw5PuX
However, I found that these are purely sequential orders and not true atomic multileg orders for straddle/strangle/arbitrage orders like the all-or-none type.
That facility would be a wonderful addition. Only one broker in the NSE provides that as of now. As a true patron of Dhan, I want that facility be introduced and far more better than the existing one.
@DhanHQ Dhan's official documents for the API have not been updated yet. That is also required for placing a trailing profit super order.
Your urgent attention in this regard will be highly appreciated.
Dear @ShashiTharoor Sir,
It is curious, if not disingenuous, to inveigh against the present administration for asserting that passports are not, and never were, instruments of citizenship when the very constitution and statutes your party once guided contain no explicit provision conferring upon passports the sanctity of a citizenship certificate. A careful reading of Section 6(2)(a) of the Passport Act, 1967, discloses that passports are not to be issued to non‑citizens — yet the statute stops short of proclaiming the passport itself to be a definitive proof of citizenship.
Moreover, the Act deliberately carves out exceptions. Section 20 empowers the government to grant a passport to a non‑citizen in exceptional circumstances; that very possibility undermines any claim that a passport is impermeably legal proof of nationality. There is a further, telling provision: Section 17 expressly declares that a passport remains the property of the Central Government and may be impounded or revoked at its discretion — a characteristic more akin to a licence or permit than to an immutable certificate of citizenship.
Why, then, did your party, when it steered the machinery of governance, not legislate the passport into a document of citizenship before reproaching the current administration for refusing to treat it as such?
#NIFTY 50 — 23,853.90 (+0.98%) | 52W: 22,183 — 26,373 | Vol 39.9 Cr
📈 Verdict
The daily chart just fired a clean reversal signal: Stoch bullish crossover at 46.7/28.6 with MACD converging 30 points toward signal. The Nifty is now above all daily EMAs (10, 20, 50) for the first time in weeks, and ADX at 21.6 confirms a trend has re-established. But the weekly is still Sell — the index is fighting its weekly EMA10 at 23,764 and hasn't cleared weekly EMA20 at 24,048. The US-Iran peace deal is the macro catalyst today. FIIs flipping to net buyers after 11-session selling streak on June 15 is the institutional signal to watch.
📊 Technicals
• Rating | Daily: Positive | Weekly: Negative
• RSI | Daily: 56.3 | Weekly: 45.8
• Stoch | Daily: 46.7 / 28.6 | Weekly: 56.9 / 48.0
• ADX | Daily: 21.6 | Weekly: 18.5
• MACD | Daily: -100.1 / -130.6 | Weekly: -373.8 / -387.8
• Daily Stoch 46.7/28.6 — bullish crossover with 18-point gap; room to 80+
• Daily MACD converging fast — -100 vs -131 (gap narrowed to 30 points from deeper)
• Daily CCI 105 — momentum thrust confirming the bounce
• Daily ADX 21.6 — trend threshold cleared; directional conviction present
• Price > EMA10 (23,479), EMA20 (23,542), EMA50 (23,773) — reclaiming the stack
• Daily BB upper 24,059 — first resistance; ~200 points away
• Weekly MACD converging — -374 vs -388 (14-point gap); early stage
• Weekly RSI 45.8 — still below 50; the regime hasn't flipped yet
• Weekly SMA100 at 24,505, SMA50 at 24,819 — major resistance band
• ⚠️ Mixed confluence — daily bullish vs weekly bearish divergence active
🔍 Key Levels
• 26,373 — 52W high
• 25,739 — weekly BB upper
• 24,819 — weekly SMA50
• 24,505 — weekly SMA100
• 24,264 — daily SMA100
• 24,059 — daily BB upper (immediate)
• 24,048 — weekly EMA20
• 23,764 — weekly EMA10
• 23,543 — daily EMA20
• 23,479 — daily EMA10
• 23,039 — daily BB lower
• 22,300 — weekly BB lower
• 22,183 — 52W low
🌐 Macro Drivers
• US-Iran peace deal — primary sentiment booster; risk-on across Asia
• FIIs turned net buyers on June 15 — first time in 11 sessions
• Nifty opening near 23,900; 24,000 is magnetic resistance
• "Exhaustion visible at 24,000" per analyst commentary — the level is heavily watched
• Auto parts and NBFCs leading today; broad-based participation
The call
The daily reversal has legs — Stoch crossover, MACD convergence, ADX confirmation, and a macro tailwind. The 24,000-24,060 zone is the first real test: daily BB upper meets psychological resistance. A close above 24,060 would target the weekly EMA20 at 24,048 (effectively the same zone), and beyond that, the weekly SMA100 at 24,505 becomes the next structural objective. The weekly Sell rating won't flip until RSI crosses above 50 (currently 45.8) and MACD goes bullish — that's probably 2-3 weeks away even if the rally continues. The FII buying resumption is the most important single data point — if it sticks for 3+ sessions, the 24,500-24,800 band comes into play.
View Full Report here: https://t.co/7IZr4GU69p
Disclaimer: This post is AI-generated and strictly for educational and informational purposes only. It does not constitute, contain, or imply any investment advice, stock recommendations, financial tips, or solicitation to buy or sell any securities or financial instruments. There are no references or suggestions related to Buy/Sell, Entry/Exit, Stop Loss (SL), or Target levels. Any market data or chart images shared are solely to illustrate technical concepts. We are not SEBI Registered Advisors, do not promote, solicit, or endorse trading decisions, and do not accept any liability for actions taken based on this content.
No compensation, association, or financial relationship exists between us and any entities or securities mentioned herein. Viewers are strongly advised to conduct their own research and consult with a certified financial advisor or SEBI registered professional before making any investment or trading decisions.
#StockMarket #Stocks #StockTrading #Trading #Investing #Investment #Finance #Money #Trader #Investor #ShareMarket #StockAnalysis #TechnicalAnalysis #Charting #MarketAnalysis #Success #Motivation #Entrepreneurship #MoneyMatters #InvestSmart #BuildWealth #TradeSmart
GABRIEL - ₹1,146.30 (+10.2%) | 52W: ₹582 — ₹1,388 | Vol 19.3 L | Auto Parts OEM
---
📈 Verdict
Today's breakout is genuine — a +10.2% move on 19.3 L volume clearing the daily EMA cluster (₹1,057-1,063) with a Stoch crossover at 49.2/34.8. But this is a conviction story, not a value one: P/E 65.3 on just 3% profit growth. The weekly MACD gap of +16.3 points is enormous — this trend has structural backing. Motilal Oswal's bull case sees 71% upside. The conflict is between powerful technical momentum and a fundamentally stretched multiple. The balance sheet quality (D/E 0.11, ROE 19.8%) offsets some of the valuation concern.
---
📊 Technicals
• Rating | Daily: Strongly Positive | Weekly: Strongly Positive
• RSI | Daily: 61.8 | Weekly: 59.1
• Stoch | Daily: 49.2 / 34.8 | Weekly: 73.7 / 73.8
• ADX | Daily: 19.0 | Weekly: 18.0
• Daily Stoch 49.2/34.8 — bullish crossover confirmed; 14.5 point gap, clean setup
• Daily MACD 1.31 / 2.57 — slight bearish convergence (-1.26); narrowing
• Daily ADX 19.0 — one push from trend threshold; today's candle likely pushes it over 20
• Price surged through EMA10 (₹1,057), EMA20 (₹1,059), SMA200 (₹1,063) in a single session
• Daily BB upper ₹1,164 — immediate resistance; within 1.5%
• Weekly MACD 28.9 / 12.6 — +16.3 points; one of the widest bull gaps across any stock analyzed
• Weekly BB upper ₹1,179 — next resistance beyond daily BB
• Fully bullish confluence
---
🔢 Fundamentals
• P/E 65.3 · EPS ₹17.56 — stretched; market pricing growth that hasn't arrived yet
• Revenue ₹4,667 Cr (+14.9% YoY) — solid top-line
• Net profit ₹252 Cr (+3.0% YoY) — growth has stalled; the valuation's weak point
• Gross 17.8% · Op 7.2% · Net 5.4% — thin OEM margins; structural
• EBITDA ₹438 Cr (9.4% margin)
• ROE 19.8% · ROA 11.3% — strong returns despite thin margins
• D/E 0.11 · CR 1.66 — pristine balance sheet
• Div yield 0.48%
• Analyst target ₹1,291 (+12.6%) · Motilal Oswal ₹1,266; bull case 71% upside
• Strategic diversification; strong Q4; auto slowdown fears but may be milder than FY20
---
🎯 Key Zones/Levels
• ₹1,388 — 52W high
• ₹1,291 — analyst consensus
• ₹1,266 — Motilal Oswal base target
• ₹1,179 — weekly BB upper
• ₹1,164 — daily BB upper (immediate)
• ₹1,063 — daily SMA200 (just cleared)
• ₹1,059 — daily EMA20
• ₹1,057 — daily EMA10 / weekly EMA10
• ₹1,056 — weekly SMA50
• ₹1,036 — daily EMA50
• ₹1,033 — daily SMA50
• ₹977 — daily SMA100 / BB lower
• ₹801 — weekly BB lower
• ₹790 — weekly SMA100
• ₹582 — 52W low
---
📊 Stock Score — 18.25 / 30
• Category: Growth | Score: 3.00 | Why: Revenue +15% solid; profit +3% weak — divergence between top and bottom line
• Category: Trend | Score: 3.75 | Why: +10% breakout day, Stoch crossover, weekly MACD +16.3 dominant; ADX 19 needs confirmation
• Category: Profitability | Score: 2.75 | Why: Net 5.4%, Op 7.2% thin (OEM structural); ROE 19.8% partially offset by high asset turnover
• Category: Financial | Score: 4.75 | Why: D/E 0.11 pristine, CR 1.66 healthy — exceptional balance sheet
• Category: Valuation | Score: 1.50 | Why: P/E 65.3 on 3% growth is expensive by any metric; market pricing 2-3 years of future growth
• Category: Efficiency | Score: 2.50 | Why: ROE 19.8%, ROA 11.3% respectable but not justifying 65x
---
The call
This is a momentum vehicle with a quality balance sheet, not a value discovery. The weekly MACD at +16.3 points says the trend is institutionally-backed and likely has further to run — auto parts OEMs are riding the broader auto cycle. But at 65x P/E with 3% earnings growth, there is no margin of safety. The ₹1,164-1,179 zone (daily + weekly BB uppers) is the immediate test. A close above ₹1,179 would confirm a run at the 52W high (₹1,388), which would be a further +17% from here. The divergence between daily MACD convergence and weekly MACD acceleration suggests a near-term pause before the next leg — the Stoch crossover may be the signal that resolves it upward.
View Full Report here: https://t.co/UUvI4Fm8kf
Disclaimer: This post is AI-generated and strictly for educational and informational purposes only. It does not constitute, contain, or imply any investment advice, stock recommendations, financial tips, or solicitation to buy or sell any securities or financial instruments. There are no references or suggestions related to Buy/Sell, Entry/Exit, Stop Loss (SL), or Target levels. Any market data or chart images shared are solely to illustrate technical concepts. We are not SEBI Registered Advisors, do not promote, solicit, or endorse trading decisions, and do not accept any liability for actions taken based on this content.
No compensation, association, or financial relationship exists between us and any entities or securities mentioned herein. Viewers are strongly advised to conduct their own research and consult with a certified financial advisor or SEBI registered professional before making any investment or trading decisions.
#StockMarket #Stocks #StockTrading #Trading #Investing #Investment #Finance #Money #Trader #Investor #ShareMarket #StockAnalysis #TechnicalAnalysis #Charting #MarketAnalysis #Success #Motivation #Entrepreneurship #MoneyMatters #InvestSmart #BuildWealth #TradeSmart
FIVESTAR - ₹466.80 (+6.3%) | 52W: ₹338 — ₹795 | Vol 1.31 Cr | NBFC — Business Finance
---
📈 Verdict
A high-quality NBFC at a recovery inflection. The daily chart just fired a trifecta of bullish signals: Stoch crossover at 45.6/34.3 (right above oversold), MACD convergence to within 1 point of a bull cross, and price breaking the BB upper (₹466) on 1.3 Cr volume. Fundamentals are superb — 76% gross margin, 34% net margin, P/E 12.5. The stock is still 41% below its 52W high of ₹795. Collection efficiency rebounding and AUM +11% with FY27 guidance of 20% growth provide the fundamental catalyst. The weekly remains neutral — that's the next regime to flip.
---
📊 Technicals
• Rating | Daily: Positive | Weekly: Neutral
• RSI | Daily: 60.1 | Weekly: 49.6
• Stoch | Daily: 45.6 / 34.3 | Weekly: 57.6 / 55.5
• ADX | Daily: 20.6 | Weekly: 17.8
• Daily Stoch 45.6/34.3 — fresh bullish crossover from near-oversold; 40 points of room to overbought
• Daily MACD -3.94 / -4.99 — 1.05 points from bull cross; imminent signal
• Daily CCI 176 — strong momentum thrust confirming the breakout
• Daily BB upper ₹466 blown — price ₹467; breakout on volume
• Daily SMA200 ₹500 — first major structural resistance; 7% above
• Weekly MACD -18.4 / -27.9 — 9.46-point convergence underway; gap closing
• Weekly RSI 49.6 — exactly at neutral; a push above 50 would shift the higher timeframe
• Weekly SMA50 ₹518, EMA50 ₹515 — the real "regime change" zone
• Mostly bullish confluence — daily bullish, weekly on the fence
---
🔢 Fundamentals
• P/E 12.5 · EPS ₹37.31 — cheap for a 34% net margin franchise
• Revenue ₹3,246 Cr (+13.3% YoY) — steady double-digit growth
• Net profit ₹1,099 Cr (+2.4% YoY) — growth slowed; FY27 guidance of 20% AUM growth implies reacceleration
• Q4 profit ₹269 Cr — stable quarterly run-rate
• Gross margin 76.1% · Operating 51.7% · Net 33.8% — elite profitability; NBFC edge
• ROE 16.1% · ROA 7.3% — solid, not spectacular; leverage is moderate for NBFC
• D/E 1.11 — standard NBFC leverage; well within comfort
• CR 67.6 — exceptionally high liquidity; NBFC cash buffer
• Div yield 0.45%
• Analyst target ₹623 (+33.5%) · Motilal Oswal target ₹600
• AUM ₹13,225 Cr (+11% YoY); collection efficiency rebounded
• Capital ratios improved; final dividend proposed
---
🎯 Key Zones/Levels
• ₹795 — 52W high
• ₹625 — weekly SMA100
• ₹623 — analyst consensus target
• ₹600 — Motilal Oswal target
• ₹518 — weekly SMA50
• ₹515 — weekly EMA50
• ₹513 — weekly BB upper
• ₹500 — daily SMA200 (immediate structural resistance)
• ₹466 — daily BB upper (just broken; now support if it holds)
• ₹451 — daily SMA50
• ₹449 — daily EMA50
• ₹444 — daily EMA20
• ₹441 — daily EMA10
• ₹439 — daily SMA100
• ₹420 — daily BB lower
• ₹350 — weekly BB lower
• ₹338 — 52W low
---
📊 Stock Score — 21.75 / 30
• Category: Growth | Score: 3.25 | Why: Revenue +13%, profit +2.4%; AUM +11% with 20% FY27 target — growth reacceleration expected
• Category: Trend | Score: 3.25 | Why: Daily Stoch crossover, MACD 1 point from bull cross, BB breakout; weekly neutral with MACD converging 9.5 points
• Category: Profitability | Score: 5.00 | Why: Gross 76%, Op 51.7%, Net 33.8% — exceptional margins across the board
• Category: Financial | Score: 3.50 | Why: D/E 1.11 (NBFC normal), CR 67.6 (extreme liquidity); well-capitalized
| Valuation | 3.50 | P/E 12.5 with 2.4% earnings growth; cheap on absolute, fair on growth; analyst target implies +33% |
| Efficiency | 3.25 | ROE 16.1%, ROA 7.3% — solid but not top-tier among NBFCs |
---
The call
The daily setup is one of the cleaner momentum-reversal signals today: Stoch crossover above oversold, MACD about to bull cross, volume-backed BB breakout. The ₹500 SMA200 is the first real test — clearing that would put the stock above all daily MAs and shift the conversation from "recovery" to "trend." The weekly needs to follow: RSI crossing 50 and MACD continuing to converge are the confirmations. The ₹518-623 corridor is the zone where the weekly Sell/Neutral rating would flip. At 12.5x P/E with 34% net margins and collection efficiency rebounding, the fundamental floor feels established. The gap between ₹467 and ₹623 is where the 41% drawdown from 52W highs gets repaired — or stalls.
View Full Report here: https://t.co/Pv0eQcHlsr
Disclaimer: This post is AI-generated and strictly for educational and informational purposes only. It does not constitute, contain, or imply any investment advice, stock recommendations, financial tips, or solicitation to buy or sell any securities or financial instruments. There are no references or suggestions related to Buy/Sell, Entry/Exit, Stop Loss (SL), or Target levels. Any market data or chart images shared are solely to illustrate technical concepts. We are not SEBI Registered Advisors, do not promote, solicit, or endorse trading decisions, and do not accept any liability for actions taken based on this content.
No compensation, association, or financial relationship exists between us and any entities or securities mentioned herein. Viewers are strongly advised to conduct their own research and consult with a certified financial advisor or SEBI registered professional before making any investment or trading decisions.
#StockMarket #Stocks #StockTrading #Trading #Investing #Investment #Finance #Money #Trader #Investor #ShareMarket #StockAnalysis #TechnicalAnalysis #Charting #MarketAnalysis #Success #Motivation #Entrepreneurship #MoneyMatters #InvestSmart #BuildWealth #TradeSmart
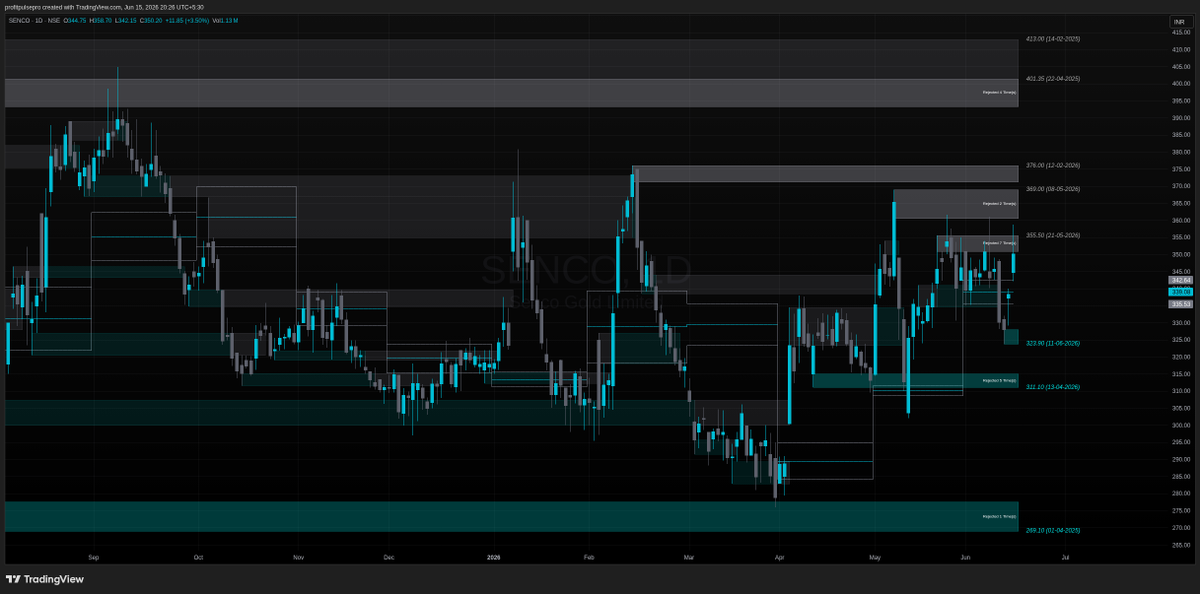
SENCO - ₹350.20 (+3.5%) | 52W: ₹276 — ₹405 | Vol 11.3 L | Gold & Jewellery Retail
---
📈 Verdict
A rare discovery: single-digit P/E (9.99) on 261% earnings growth with 25.6% ROE. Senco delivered a record FY26 — revenue +32%, profit +261% — yet the stock trades at a deep value multiple because the FY27 outlook is "conservative." The daily Stoch just fired a bullish crossover at 40.0/27.2, mirroring the FIVESTAR and FEDFINA setups but with far superior fundamentals. The daily ADX at 11.3 is the weakness — no trend momentum yet, which means this is an accumulation phase, not a breakout. The weekly is stronger: ADX 19.8 approaching trend territory and MACD at +4.68 points — firmly bullish.
---
📊 Technicals
• Rating | Daily: Positive | Weekly: Positive
• RSI | Daily: 56.1 | Weekly: 55.1
• Stoch | Daily: 40.0 / 27.2 | Weekly: 75.7 / 75.9
• ADX | Daily: 11.3 | Weekly: 19.8
• Daily Stoch 40.0/27.2 — bullish crossover confirmed; 12.8 point gap, 30+ points of room to overbought
• Daily MACD 2.32 / 3.43 — slight bearish convergence (-1.11); minor and narrowing
• Daily ADX 11.3 — weak trend; price in a low-momentum consolidation
• Daily CCI 83.3 — positive but not thrust-level
• Price above all daily EMAs (EMA10 ₹341, EMA20 ₹340, EMA50 ₹333, SMA200 ₹330)
• Weekly MACD 5.24 / 0.56 — +4.68 gap firmly bullish; strong higher-timeframe support
• Weekly ADX 19.8 — on the cusp of trend confirmation (20)
• Weekly RSI 55.1 — neutral with upward bias
• Fully bullish confluence
---
🔢 Fundamentals
• P/E 9.99 · EPS ₹35.08 — single-digit multiple on record earnings
• Revenue ₹8,430 Cr (+32.0% YoY) — strong top-line expansion
• Net profit ₹574 Cr (+260.5% YoY) — nearly quadrupled; record FY26
• Gross 16.6% · Op 10.5% · Net 6.8% — healthy for jewellery retail; gold is low-margin by nature
• EBITDA ₹969 Cr (11.5% margin)
• ROE 25.6% · ROA 9.7% — exceptional; earning well above cost of capital
• D/E 1.07 · CR 1.54 — moderate leverage, adequate liquidity
• Div yield 0.52%
• Analyst target ₹462 (+32%) · Motilal Oswal neutral at ₹375
• Record FY26; strong old gold exchange program driving margins
• FY27 guidance: conservative — the reason the P/E is compressed
• Major acquisition approved
---
🎯 Key Zones/Levels
• ₹462 — analyst target
• ₹405 — 52W high
• ₹401 — weekly SMA100
• ₹371 — weekly BB upper
• ₹356 — daily BB upper (immediate resistance)
• ₹341 — daily EMA10
• ₹340 — weekly EMA50 / daily EMA20
• ₹333 — daily EMA50
• ₹332 — daily SMA50
• ₹330 — daily SMA200
• ₹328 — daily BB lower
• ₹279 — weekly BB lower
• ₹276 — 52W low
---
📊 Stock Score — 22.25 / 30
• Category: Growth | Score: 4.75 | Why: Revenue +32%, profit +261% — exceptional; conservative FY27 guidance tempers forward view
• Category: Trend | Score: 2.75 | Why: Daily Stoch crossover good, but ADX 11.3 = no momentum; weekly ADX 19.8 building
• Category: Profitability | Score: 3.75 | Why: Net 6.8% good for jewellery; ROE 25.6% excellent; gross 16.6% constrained by gold commoditization
• Category: Financial | Score: 3.00 | Why: D/E 1.07, CR 1.54 — manageable; jewellery retail carries inventory leverage
• Category: Valuation | Score: 5.00 | Why: P/E 9.99 on 261% growth — arguably the best absolute valuation in the industrial/consumer mid-cap space today
• Category: Efficiency | Score: 3.00 | Why: ROE 25.6%, ROA 9.7% — strong returns; capital efficiency is a differentiator
---
The call
The fundamental score is among the highest in any stock analyzed today, yet the ADX of 11.3 says the market hasn't noticed — or is deliberately ignoring it due to conservative FY27 guidance. This is a classic value setup: extraordinary trailing numbers priced as if they're temporary. The ₹356 daily BB upper is the first activation level — a close above that on volume would be the market's admission that FY27 guidance was sandbagged. The weekly MACD at +4.68 provides higher-timeframe support that the fundamentals aren't a one-off. At 10x P/E with ROE of 25.6%, the downside is math-protected; the upside is whether the market re-rates from value to quality. The Stoch crossover at 40 is the first technical signal that accumulation may have begun.
View Full Report here: https://t.co/cKheyogEkE
Disclaimer: This post is AI-generated and strictly for educational and informational purposes only. It does not constitute, contain, or imply any investment advice, stock recommendations, financial tips, or solicitation to buy or sell any securities or financial instruments. There are no references or suggestions related to Buy/Sell, Entry/Exit, Stop Loss (SL), or Target levels. Any market data or chart images shared are solely to illustrate technical concepts. We are not SEBI Registered Advisors, do not promote, solicit, or endorse trading decisions, and do not accept any liability for actions taken based on this content.
No compensation, association, or financial relationship exists between us and any entities or securities mentioned herein. Viewers are strongly advised to conduct their own research and consult with a certified financial advisor or SEBI registered professional before making any investment or trading decisions.
#StockMarket #Stocks #StockTrading #Trading #Investing #Investment #Finance #Money #Trader #Investor #ShareMarket #StockAnalysis #TechnicalAnalysis #Charting #MarketAnalysis #Success #Motivation #Entrepreneurship #MoneyMatters #InvestSmart #BuildWealth #TradeSmart
💹 EOD OI Pulse
🗓 15-Jun-2026
FII going 🛡️ Defensive:
🔼 Index Futures: 2382 (Bullish)
🔽 Index Calls: -43307 (Bearish)
🔼 Index Puts: 2574 (Bearish)
🔼 Stock Futures: 6694 (Bullish)
PROs going ⚖️ Hedged:
🔽 Index Futures: -5326 (Bearish)
🔽 Index Calls: -123291 (Bearish)
🔽 Index Puts: -45343 (Bullish)
🔽 Stock Futures: -32644 (Bearish)
Overall Sentiment Interpretation next trading day:
FIIs are cautious, adopting a hedged bearish stance with weak conviction due to decreasing volumes. PROs, however, are aggressively setting up for a rangebound market by selling both Index Calls and Puts with strong volume on the put side, but their futures short adds a mild bearish tilt. This dynamic suggests a struggle between mild bearish sentiment and consolidation within a range.
💡 Final Market View: Sideways to Mildly Bearish
📊 Navigating the nuances, a tight range might be ahead! 🧐
⚠️ Disclaimer: This post is AI-generated and strictly for educational and informational purposes only. It does not constitute, contain, or imply any investment advice, stock recommendations, financial tips, or solicitation to buy or sell any securities or financial instruments. There are no references or suggestions related to Buy/Sell, Entry/Exit, Stop Loss (SL), or Target levels. Any market data or chart images shared are solely to illustrate technical concepts. We are not SEBI Registered Advisors, do not promote, solicit, or endorse trading decisions, and do not accept any liability for actions taken based on this content.
No compensation, association, or financial relationship exists between us and any entities or securities mentioned herein. Viewers are strongly advised to conduct their own research and consult with a certified financial advisor or SEBI registered professional before making any investment or trading decisions.
#StockMarketIndia #Nifty50 #BankNifty #FinTwit #Sensex #Trading #DalalStreet #FII #OptionsTrading #Investing #IndianEconomy #StockMarketNews #Intraday #Nifty #MarketOutlook #ShareMarket #Traders #NSE #BSE #SmartMoney #PriceAction #OpenInterest
📈 Today's Market Wrap-up:
🗓 15-Jun-2026
👉 Domestic Institutional Investors (DII) Activity:
🔼 Buy: ₹21,080.90 Cr.
🔽 Sell: ₹17,891.64 Cr.
🔼 Net Impact: ₹3,189.26 Cr. ➕ Strong buying by DIIs! 💪
👉 Foreign Institutional Investors (FII) Activity:
🔼 Buy: ₹15,650.20 Cr.
🔽 Sell: ₹15,450.15 Cr.
🔼 Net Impact: ₹200.05 Cr. ➕ FIIs showing a slight positive tilt! 💹
🔼 Combined net investment: ₹3,389.31 Cr.
💡 Market sentiment: Bullish
🔮 Market Trend: Positive momentum building with robust DII support and cautious FII inflows! 🚀 India shining bright! ✨
⚠️ Disclaimer: This post is AI-generated and strictly for educational and informational purposes only. It does not constitute, contain, or imply any investment advice, stock recommendations, financial tips, or solicitation to buy or sell any securities or financial instruments. There are no references or suggestions related to Buy/Sell, Entry/Exit, Stop Loss (SL), or Target levels. Any market data or chart images shared are solely to illustrate technical concepts. We are not SEBI Registered Advisors, do not promote, solicit, or endorse trading decisions, and do not accept any liability for actions taken based on this content.
No compensation, association, or financial relationship exists between us and any entities or securities mentioned herein. Viewers are strongly advised to conduct their own research and consult with a certified financial advisor or SEBI registered professional before making any investment or trading decisions.
#StockMarketIndia #FII #DII #NSE #BSE #Nifty50 #BankNifty #ShareMarketIndia #TradingUpdates #InstitutionalInvestors #CashMarket #MarketSentiment #InvestInIndia #StockMarketAnalysis #FinanceNews #DalalStreet #IndianEconomy #StockMarketDaily #InvestmentStrategy #EquityMarket #FIIActivity #MarketData #TradingSignals #Sensex #BullMarket #BearMarket #FinancialData #MarketTrends #StockMarketLearning #SRSFintech
On 15 June 2026, the market witnessed highly polarized, stock-specific action, with risk-on buying dominating the lower-priced and mid-cap spectrum while selective profit-booking cooled down some high-priced counters. The overall sentiment leaned towards aggressive momentum buying in top performers, contrasting with relatively controlled, mild corrections among the day's laggards. 🚀
Leading the explosive rally of the day, AGARIND locked in a stellar +20.00% gain to close at ₹580.25, closely followed by MCLOUD which rocketed +19.98% to ₹26.66. The buying frenzy continued with RUSHIL leaping +18.01% to ₹17.89, while DECNGOLD surged +17.62% to ₹192.61 and ABCOTS registered a powerful +17.20% jump to end at ₹246.33. Other notable gainers keeping the momentum alive included STERTOOLS rallying +14.22% to ₹239.54 and SCPL advancing +14.16% to ₹515.30. 🔥
On the flip side, the bears took control of select counters, leading to a sharp selloff in some high-value stocks. COCKERILL was the worst hit, declining -6.85% to ₹9,325.00, while ELECTHERM faced a brutal decline of -5.70% to ₹1,122.25. Selling pressure was also evident in GRMOVER which slipped -5.36% to ₹88.23, ANTELOPUS sliding -5.00% to ₹794.75, and NEPHROPLUS dropping -4.64% to ₹713.40. Popular names like AUROPHARMA and OLAELEC also remained under pressure, down -4.38% to ₹1,408.30 and -3.54% to ₹44.12 respectively. 📉
The trading session highlighted a clear theme of stock-specific volatility, where small and mid-sized businesses across diverse sectors such as mining, textiles, and technology attracted massive capital flows. Meanwhile, profit-booking was primarily concentrated in agricultural exporters like GRMOVER, healthcare players such as NEPHROPLUS and AUROPHARMA, and heavy-ticket engineering plays like COCKERILL. Overall, the market exhibited a strong risk-seeking appetite in selected momentum plays, offset by healthy corrections in others. ⚡
⚠️ Disclaimer: This post is AI-generated and strictly for educational and informational purposes only. It does not constitute, contain, or imply any investment advice, stock recommendations, financial tips, or solicitation to buy or sell any securities or financial instruments. There are no references or suggestions related to Buy/Sell, Entry/Exit, Stop Loss (SL), or Target levels. Any market data or chart images shared are solely to illustrate technical concepts. We are not SEBI Registered Advisors, do not promote, solicit, or endorse trading decisions, and do not accept any liability for actions taken based on this content.
No compensation, association, or financial relationship exists between us and any entities or securities mentioned herein. Viewers are strongly advised to conduct their own research and consult with a certified financial advisor or SEBI registered professional before making any investment or trading decisions.
#StockMarket #TopGainers #TopLosers #PreMarket #PostMarket #Investing #Trading #Finance #MarketAnalysis #Stocks #Business #NSE #BSE #IndianStockMarket #MarketUpdate #FinancialNews #Equity #Gainers #Losers #IntradayTrading #SwingTrading #LongTermInvesting #ShareMarketIndia
On 15-Jun-2026,
Indices:
🚀 Nifty 50 gained +0.98% to close at 23853.90 in a bullish session, propelled by heavy gains in Trent (+5.29%) and Shriram Finance (+4.79%), despite drags from NTPC (-1.64%).
📈 Nifty Midcap 50 climbed +1.37% to close at 17501.90, maintaining steady bullish momentum as Nifty Midcap 150 also gained +1.47%.
📈 Nifty Smallcap 100 closed +1.11% higher at 18400.00, reflecting a positive risk-on appetite though cooling down slightly from its pre-market expectation of +1.57%.
Sectoral Highlights:
🔥 Nifty Realty jumped a massive +3.96% to close at 800.05, accelerating from its pre-market level of +2.66% in a powerful breakout rally.
🚗 Nifty Auto surged +2.60% to close at 26977.50, powered by strong gains in Eicher Motors (+4.27%) and Maruti (+3.28%) as momentum intensified.
Metal Nifty Metal gained +1.78% to close at 13083.85, showing a steady recovery trend from its pre-market position of +1.37%.
🛡️ Nifty Pharma dipped -0.66% to close at 24220.10, facing extended profit-booking as defensive sectors underperformed.
📉 Nifty PSU Bank moderated to +0.62% to close at 8581.30, experiencing notable cooling and profit-booking from its strong pre-market gain of +1.71%.
Defensive Nifty Healthcare slid -0.41% to close at 15488.55, continuing its weak trend as defensive interest waned.
Wrap-up:
🌟 Overall investor sentiment remained highly bullish and risk-on, supported by a -2.51% drop in India VIX to close at 14.35. However, we saw a clear trend reversal where high-flying pre-market expectations in PSU Banks and Smallcaps moderated, while Realty and Auto registered massive extensions of their gains.
#Nifty50 #StockMarketIndia #NiftyRealty #NiftyAuto #Trent #ShriramFinance #EicherMotors #Maruti #NiftyMidcap #NiftySmallcap #NiftyPharma #NiftyPSUBank #IndiaVIX
⚠️ Disclaimer: This post is AI-generated and strictly for educational and informational purposes only. It does not constitute, contain, or imply any investment advice, stock recommendations, financial tips, or solicitation to buy or sell any securities or financial instruments. There are no references or suggestions related to Buy/Sell, Entry/Exit, Stop Loss (SL), or Target levels. Any market data or chart images shared are solely to illustrate technical concepts. We are not SEBI Registered Advisors, do not promote, solicit, or endorse trading decisions, and do not accept any liability for actions taken based on this content.
No compensation, association, or financial relationship exists between us and any entities or securities mentioned herein. Viewers are strongly advised to conduct their own research and consult with a certified financial advisor or SEBI registered professional before making any investment or trading decisions.
#StockMarketIndia #Nifty50 #BankNifty #Sensex #TradingViewIndia #DalalStreet #NiftyMidcap #ShareMarketIndia #InvestmentIndia #RetailInvestors #IndianStockMarket #FinanceIndia #StockMarketUpdates #DailyMarketReport #NSEIndia #BSEIndia #TechnicalAnalysis #FundamentalAnalysis #MoneyControl #CNBCTV18 #MarketMood #WealthCreation #FinancialEducation #InvestorAwareness
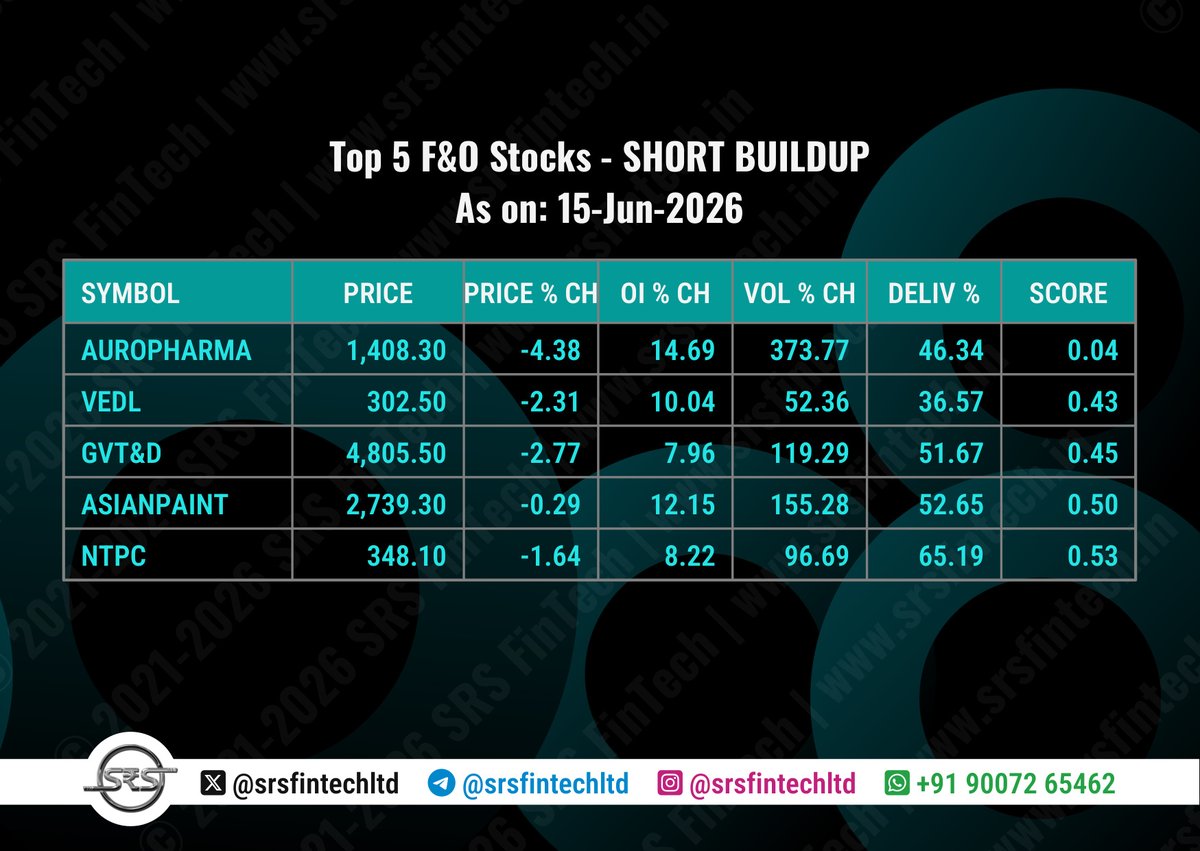
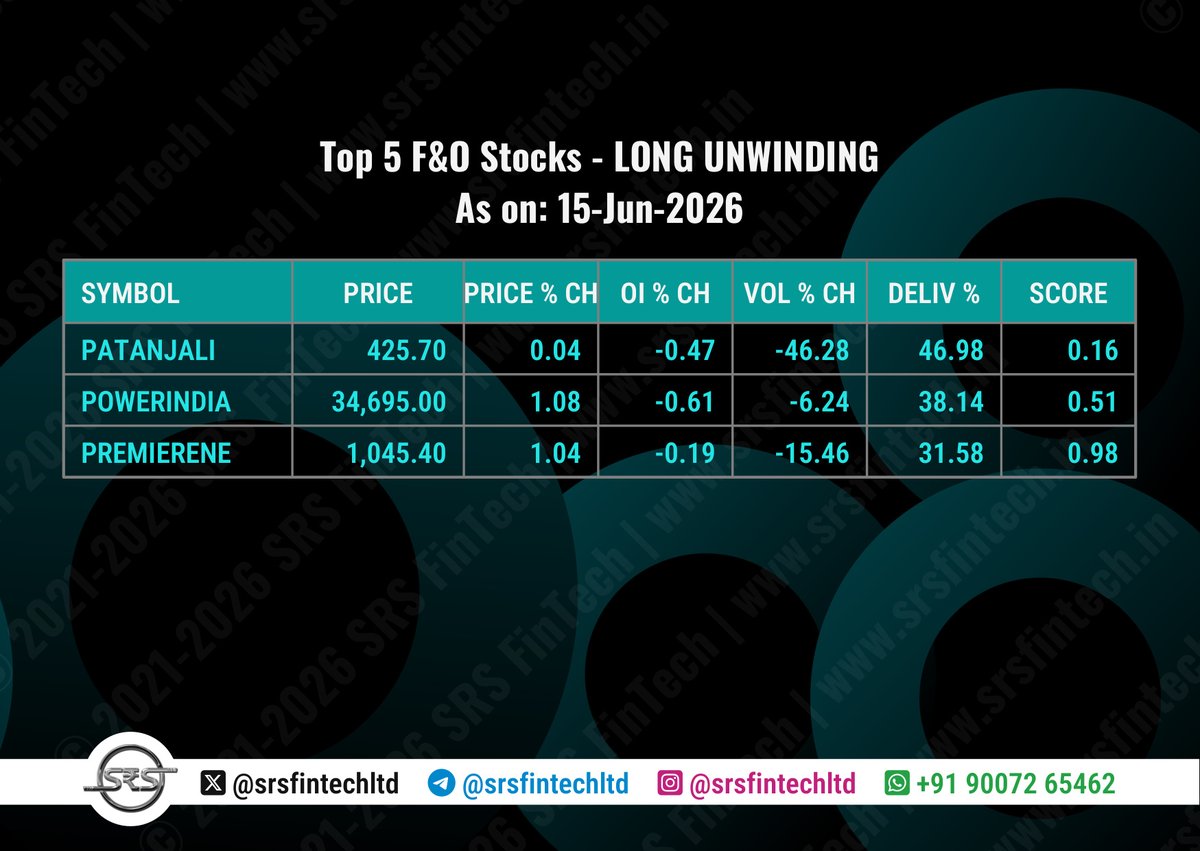
📊 F&O Market Top Stocks Report
15-Jun-2026
This report highlights the top 5 stocks across four key futures & options activity scenarios: Long Buildup, Short Buildup, Short Covering, and Long Unwinding, based on the latest trading day data.
Each stock is ranked by a score that combines multiple factors including price change %, open interest change %, volume change %, and delivery percentage. A lower score indicates stronger relative activity and potential market interest in that category.
⚠️ Disclaimer: This post is AI-generated and strictly for educational and informational purposes only. It does not constitute, contain, or imply any investment advice, stock recommendations, financial tips, or solicitation to buy or sell any securities or financial instruments. There are no references or suggestions related to Buy/Sell, Entry/Exit, Stop Loss (SL), or Target levels. Any market data or chart images shared are solely to illustrate technical concepts. We are not SEBI Registered Advisors, do not promote, solicit, or endorse trading decisions, and do not accept any liability for actions taken based on this content.
No compensation, association, or financial relationship exists between us and any entities or securities mentioned herein. Viewers are strongly advised to conduct their own research and consult with a certified financial advisor or SEBI registered professional before making any investment or trading decisions.
#StockMarket #Stocks #StockTrading #Trading #Investing #Investment #Finance #Money #Trader #Investor #ShareMarket #StockAnalysis #TechnicalAnalysis #Charting #MarketAnalysis #Success #Motivation #Entrepreneurship #MoneyMatters #InvestSmart #BuildWealth #TradeSmart #StockFundamentals #Dividend #FuturesTrading #OptionsTrading #FnOSegment #DerivativesMarket #OptionsStrategy #FuturesMarket #OptionsChain #EquityDerivatives #OptionsAnalysis #MarketVolatility #OptionsPremium #TradingStrategies #Hedging #RiskManagement #OptionsTrader
🔥 Delivery Volume Scans
15-JUN-2026 📈
High delivery volumes (>55%) indicate strong investor conviction as these shares are being taken for delivery rather than intraday trading. When coupled with above-average trading volumes, it often suggests accumulation by informed investors and institutions. Such stocks typically show reduced speculative activity and increased likelihood of sustained price movements. This data can help identify stocks with genuine buying interest and potential for medium to long-term moves.
⚠️ Disclaimer: This post is AI-generated and strictly for educational and informational purposes only. It does not constitute, contain, or imply any investment advice, stock recommendations, financial tips, or solicitation to buy or sell any securities or financial instruments. There are no references or suggestions related to Buy/Sell, Entry/Exit, Stop Loss (SL), or Target levels. Any market data or chart images shared are solely to illustrate technical concepts. We are not SEBI Registered Advisors; we do not promote, solicit, or endorse trading decisions, and do not accept any liability for actions taken based on this content.
No compensation, association, or financial relationship exists between us and any entities or securities mentioned herein. Viewers are strongly advised to conduct their own research and consult with a certified financial advisor or SEBI registered professional before making any investment or trading decisions.
#StockMarket #Stocks #StockTrading #Trading #Investing #Investment #Finance #Money #Trader #Investor #ShareMarket #StockAnalysis #TechnicalAnalysis #Charting #MarketAnalysis #Success #Motivation #Entrepreneurship #MoneyMatters #InvestSmart #BuildWealth #TradeSmart #StockFundamentals #Dividend #StockDelivery
MANALIPETC — ₹65.20 (+10.1%) | 52W: ₹39 — ₹81 | Market cap ₹1,117 Cr | Specialty Chemicals
Daily Strongly Positive, weekly Positive. Fully bullish across both timeframes. ADX 31.8 — strongest trending signal in today's coverage. Stoch 45 = mid-move, not exhausted.
Technicals:
MA stack: EMA10 ₹61.9 → EMA20 ₹60.5 → SMA50 ₹55.9 → SMA100 ₹54.8 — clean upward cascade.
Fundamentals
📷 Net margin 12.7% vs operating margin 4.7% — large non-operating income inflates the bottom line. Core business profitability is thin.
• P/E 8.6 · EPS ₹7.56 — deepest discount in specialty chemicals
• Revenue ₹1,022 Cr (+14.0%) — accelerating
• Net profit ₹130 Cr (+343.5%) — off a low base; sustainability over-indexing
• Gross margin 13.5% · Operating 4.7% · Net 12.7%
• EBITDA ₹82 Cr (8.0% margin)
• ROE 10.9% · ROA 8.6%
• D/E 0.11 · CR 4.51 — pristine balance sheet 📷
• New Chennai facility inaugurated Apr 2026, Plant-1 Manali restarted
• Tax disputes resolved
📷 Stock Score — 22.50 / 30
• Category: Growth | Score: 4.50 | Why: Revenue +14%, profit +343% — massive earnings turnaround
• Category: Trend | Score: 3.75 | Why: Fully bullish, ADX 31.8 strongest in scan, Stoch 45 = mid-move
• Category: Profitability | Score: 2.50 | Why: Gross 13.5%, EBITDA 8.0% — thin core; net margin inflated by non-operating income
• Category: Financial | Score: 4.50 | Why: D/E 0.11, CR 4.51 — fortress
• Category: Valuation | Score: 4.50 | Why: P/E 8.6 — unmatched discount in the sector
• Category: Efficiency | Score: 2.75 | Why: ROE 10.9%, ROA 8.6% — passable, below quality peers
Key Zones
• ₹68.60 — today's high
• ₹66.4 — daily BB upper
• ₹81.1 — 52W high
• ₹61.9 — EMA10
• ₹60.5 — EMA20
• ₹55.9 — SMA50
The tension is clear: P/E 8.6 and ADX 31.8 make it the cheapest name with the strongest trend. But the core business runs at a 4.7% operating margin while the sector leaders operate at 15-24%. The capacity expansion and plant restart are bets on closing that gap — if even half the gap closes, the re-rating potential is significant from these levels.
📷 Disclaimer: This post is AI-generated and strictly for educational and informational purposes only. It does not constitute, contain, or imply any investment advice, stock recommendations, financial tips, or solicitation to buy or sell any securities or financial instruments. The references or suggestions related to Buy/Sell, Entry/Exit, Stop Loss (SL), or Target levels are fully AI Generated and AI can make mistakes. We are not responsible for any losses or profit made out of this AI-generated content or omissions. Any market data or chart images shared are solely to illustrate technical concepts. We are not SEBI Registered Advisors; we do not promote, solicit, or endorse trading decisions, and do not accept any liability for actions taken based on this content.
No compensation, association, or financial relationship exists between us and any entities or securities mentioned herein. Viewers are strongly advised to conduct their own research and consult with a certified financial advisor or SEBI registered professional before making any investment or trading decisions.
#MANALIPETC #StockMarket #Stocks #StockTrading #Trading #Investing #Investment #Finance #Money #Trader #Investor #ShareMarket #StockAnalysis #TechnicalAnalysis #Charting #MarketAnalysis #Success #Motivation #Entrepreneurship #MoneyMatters #InvestSmart #BuildWealth #TradeSmart #StockFundamentals #Dividend
https://t.co/UDRtPExojB